Secrets That Global Warming Alarmists Don’t Want You To Know–Part 3 Biased Computers


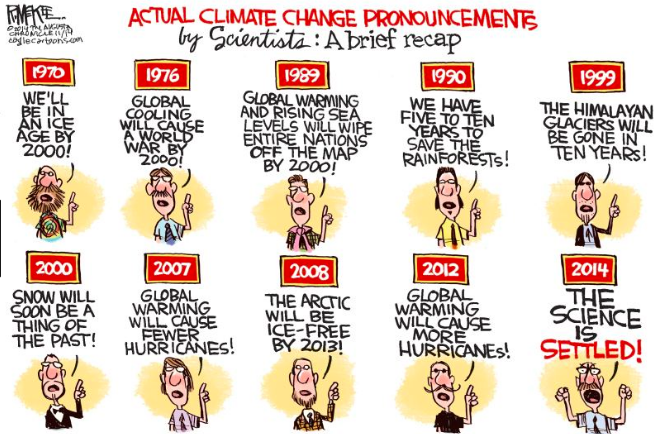
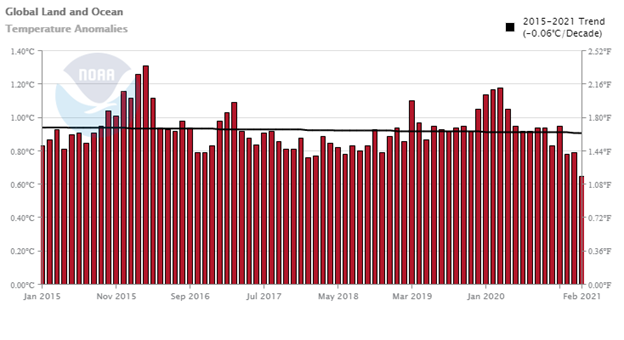
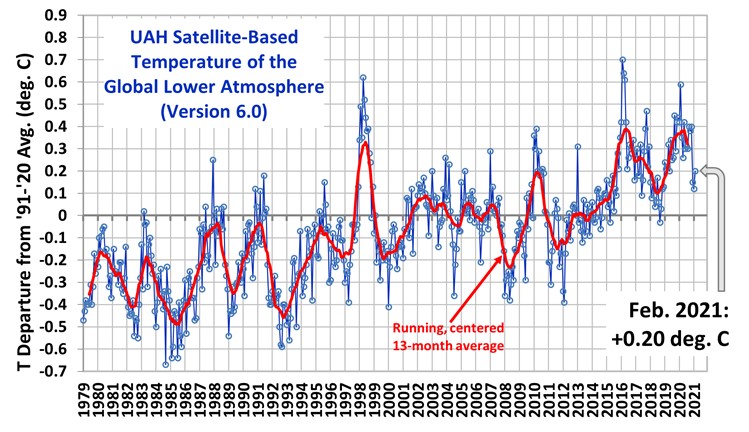
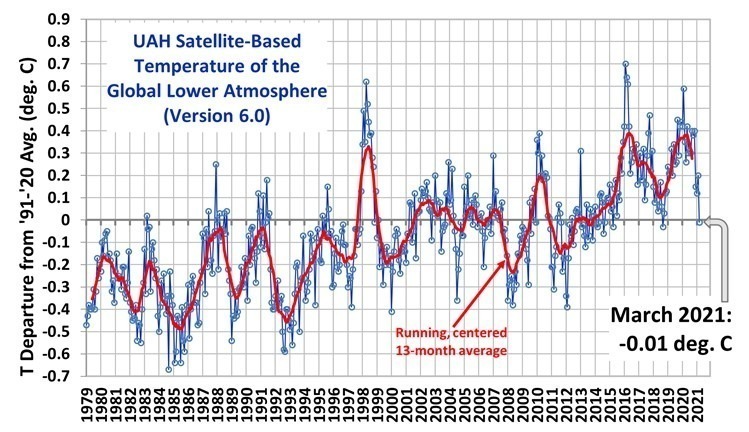
In the previous postings,  the computers predicting global temperatures were shown to be much higher than the actual measured temperatures  and that you are not being told that the actual measured global temperatures are currently falling and do not seem to have a link with the rising CO2 accumulating in the atmosphere. This posting looks at the future predictions of global temperatures and how they are biased to make you think they are going to be rising quickly.

To have some understanding how the computers are programed one needs to be acquainted with Equilibrium Climate Sensitivity (ECS) and Representative Concentration Pathways (RCP).

ECS

 Firstly, an examination of ECS.   The 1979 Charney Report, named for the Chairman of an Ad Hoc group stated:  

 “We believe, therefore, that the equilibrium surface global warming due to doubled CO2 will be in the range IC to 4C, with the most probable value near 3°C”.

 That means, for a doubling of atmospheric CO2, global temperature will rise approximately 1C due to CO2, and the CO2 induced increase in temperature will result in more water vapor.  Water vapor is a powerful greenhouse gas. That and some other minor changes in atmospheric gases will result in an additional rise of 2C.   Thus, CO2 doubling does not just create 1C rise but rather a 3C rise.  They acknowledged that there was a lot of uncertainty about this number. How water vapor and clouds interact are not yet known with any certainty.   

Climate sensitivity is expressed two ways. Transient Climate Sensitivity (TCS) is the initial effect of the change in CO2 concentration. ECS does not happen until the oceans heat come into equilibrium with atmospheric heat, for example. 

ECS is controversial.   There are those that do not believe in the CO2 effect at all.  They may not appreciate this postings discussion of ECS and RCP but the posting is addressing what the Alarmists believe.  Also, many others buy into the concept but conclude that the effect is much lower than the 3C rise due to a doubling of atmospheric CO2.  Down as low as 1C.  As well, there are alarmists that use ECS in the 4C range.

As can be seen in the Part 1 posting, the ECS being used has yielded too high of global temperatures.

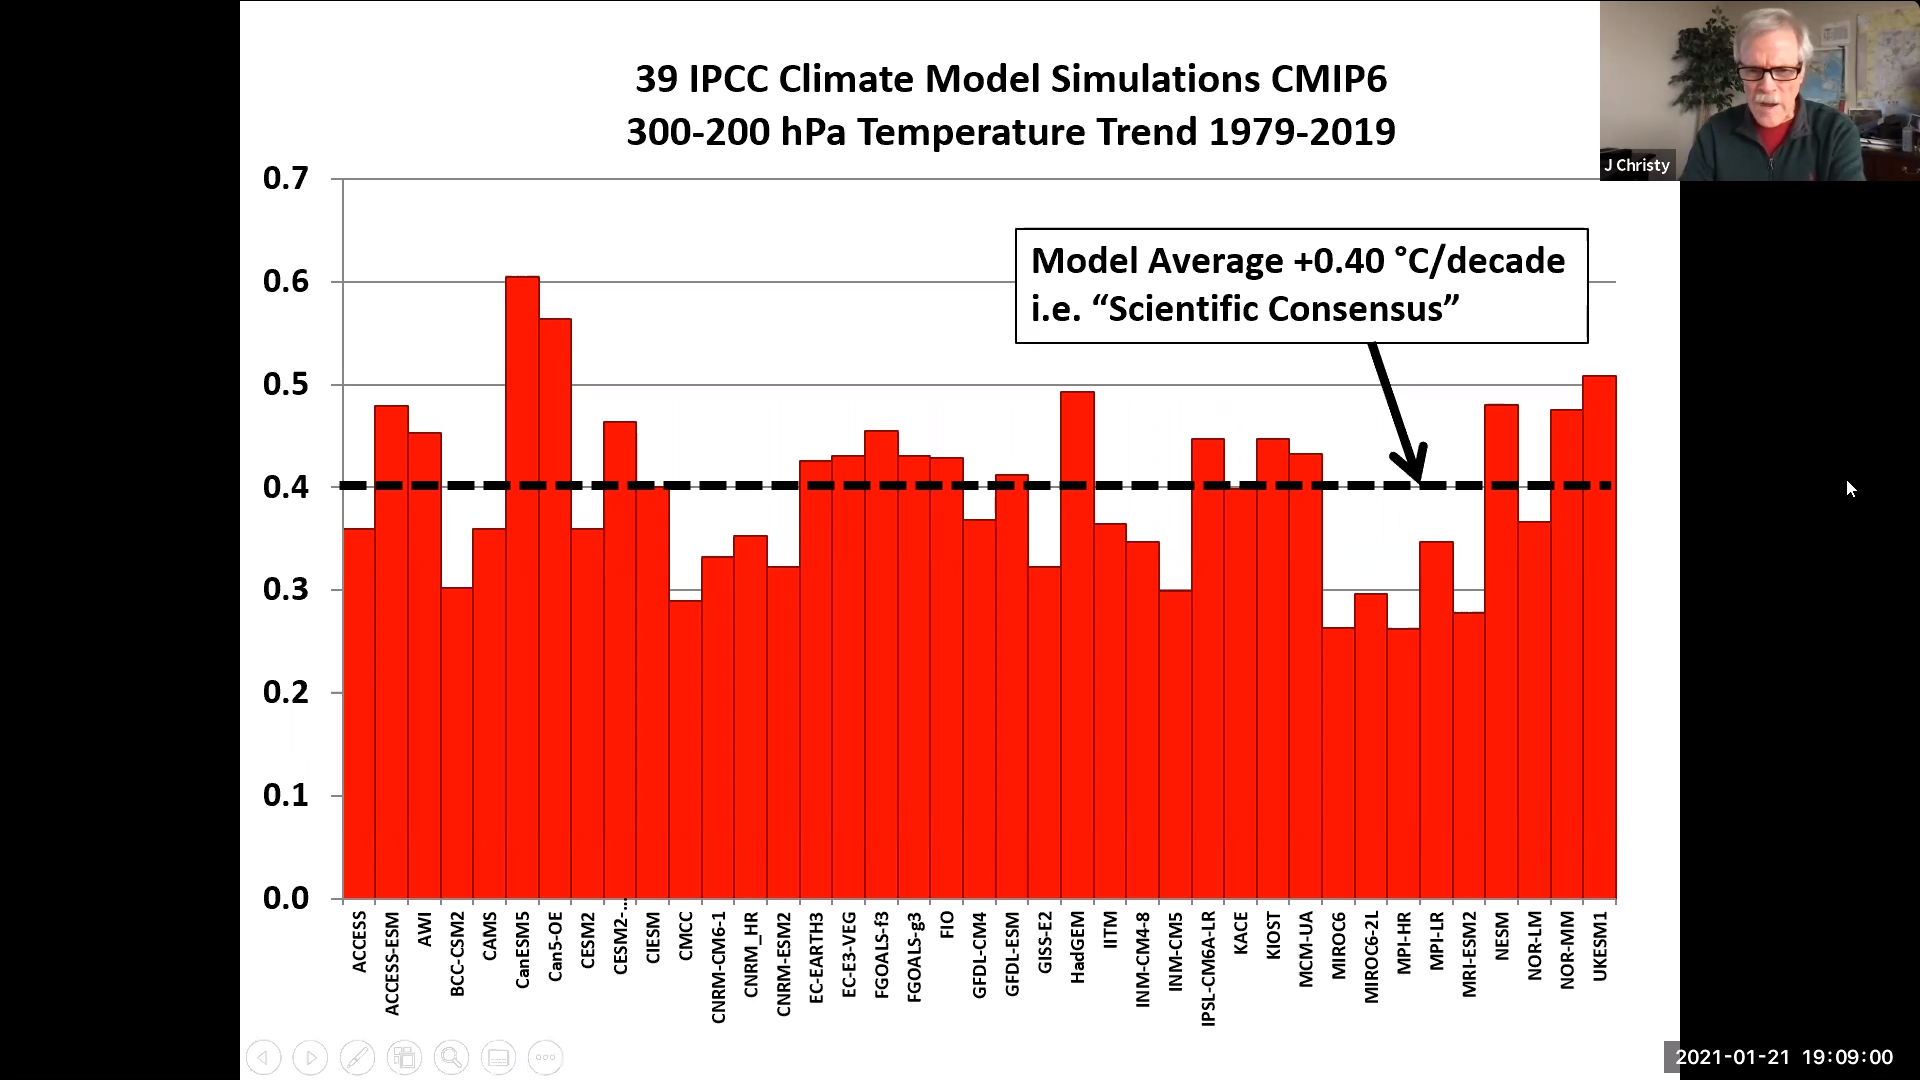
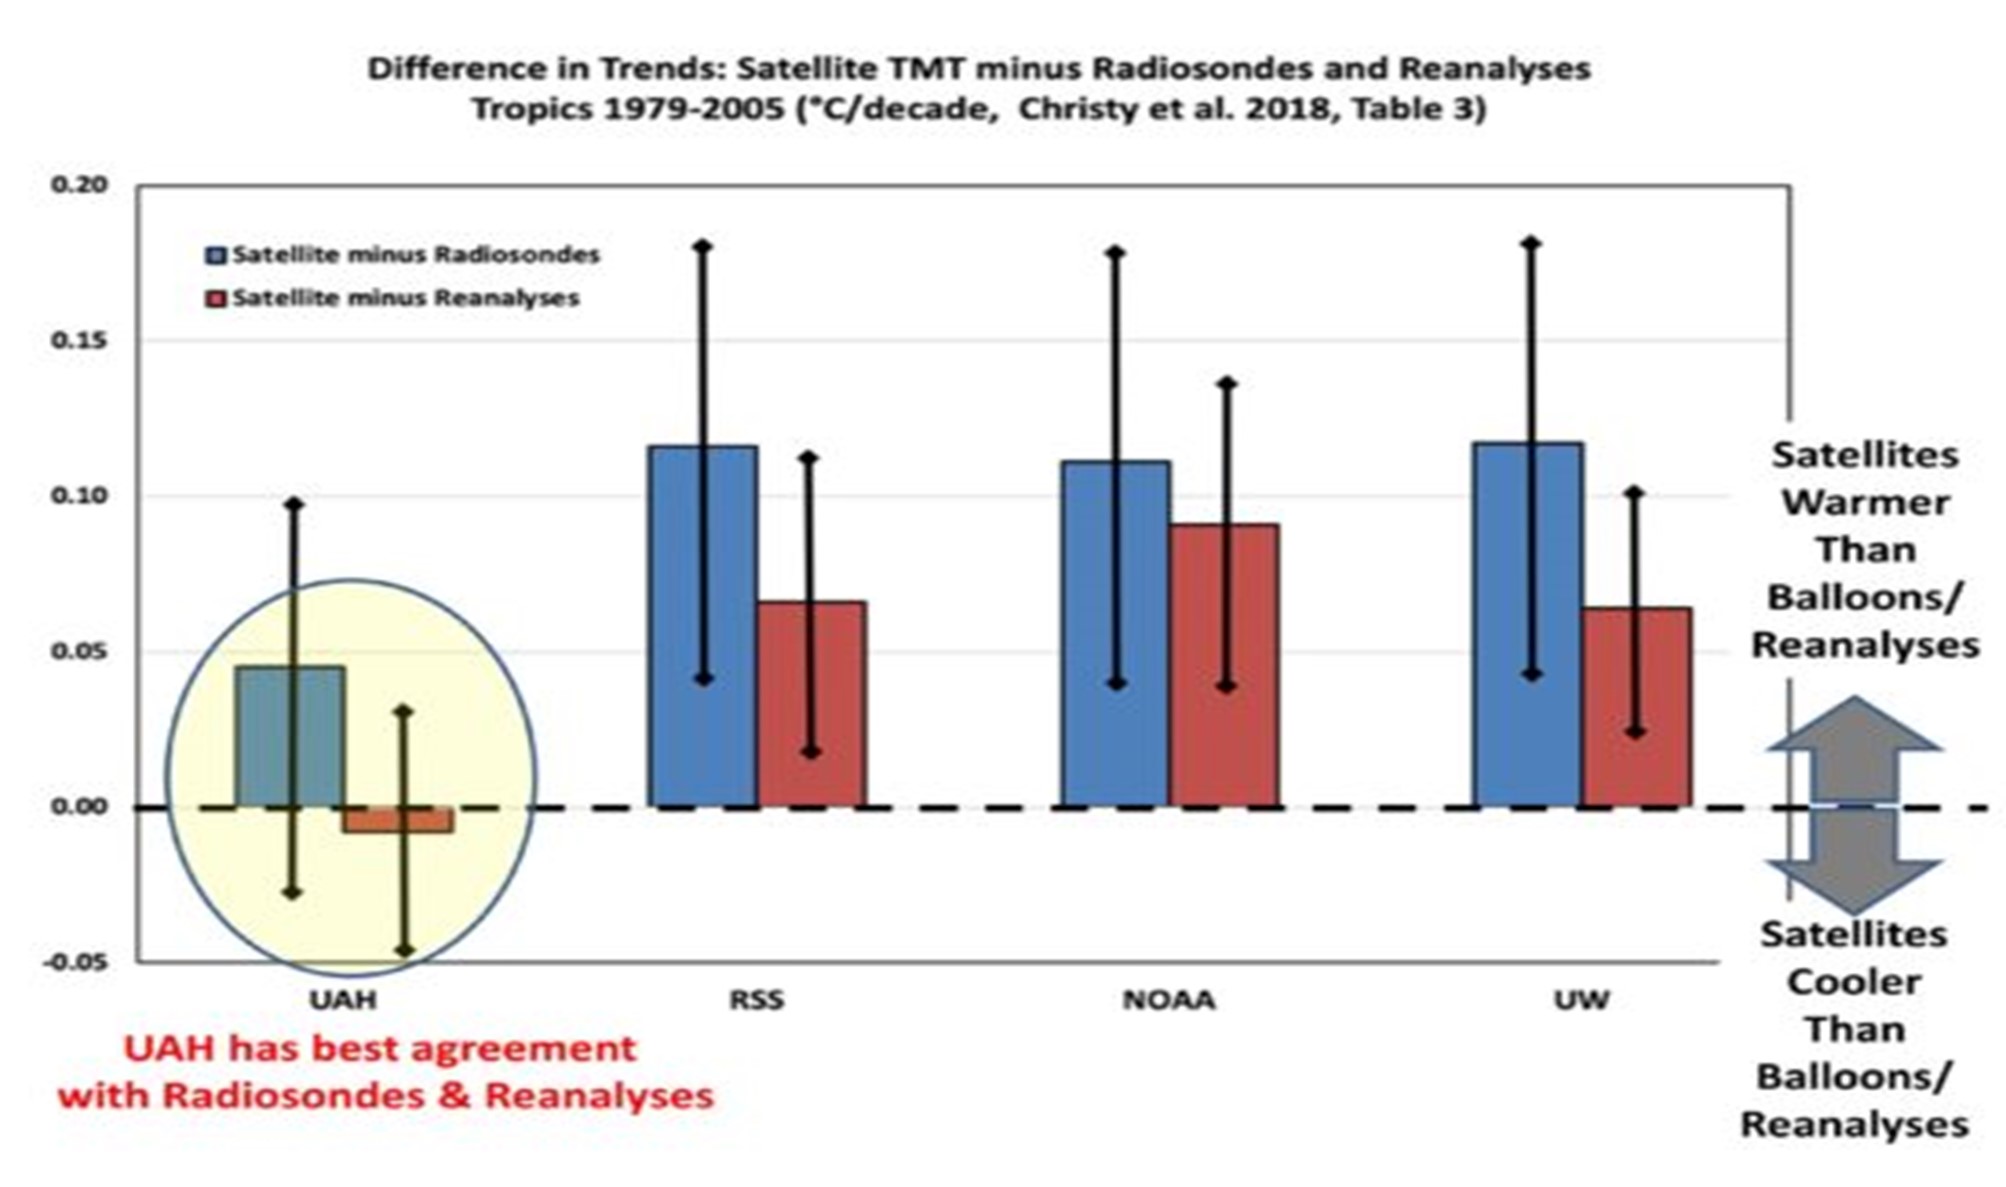
Tests of the new CMIP-6 climate computer programs conducted by McKitrick and Christy reported:     Pervasive Warming Bias in CMIP6 Tropospheric Layers – McKitrick – 2020 – Earth and Space Science – Wiley Online Library

It has long been known that previous generations of climate models exhibit excessive warming rates in the tropical troposphere. With the release of the CMIP6 (Coupled Model Intercomparison Project Version 6) climate model archive we can now update the comparison. We examined historical (hindcast) runs from 38 CMIP6 models in which the models were run using historically observed forcings. We focus on the 1979–2014 interval, the maximum for which all models and observational data are available and for which the models were run with historical forcings. What was previously a tropical bias is now global. All model runs warmed faster than observations in the lower troposphere and midtroposphere, in the tropics, and globally. On average, and in most individual cases, the trend difference is significant. Warming trends in models tend to rise with the model Equilibrium Climate Sensitivity (ECS), and we present evidence that the distribution of ECS values across the model is unrealistically high.”

If you are a climate computer programmer, you can increase the ECS, and it will result in an increase in forecast temperature.

RCP

Representative Concentration Pathway (RCP) is an estimate of the amount of CO2 in the atmosphere at any given time.  After studying numerous scenarios, more than the available computer time would allow, they settled on just 5 RCPs.

It is my understanding that the upcoming IPCC’s 6th Assessment Report will use somewhat revised versions of the original 5 pathways. These revisions are to accommodate current thinking about the options and potential pathways. Only RCP 8.5 remains as orginally conceived. At least one of the pathways will meet Paris Agreement goal of of keeping global temperature rise below 1.5C . In between 1.5 and 8.5are three others that do not meet the objective but are considered potential outcomes depending on mitigation policies. The pathways keep track of the forecast fossil fuel emissions of CO2” versus “years” beginning at the current time continuing out to the year 2100.  


The alarmists and many other warmers are using RCP8.5 as Business As Usual.  Most are not notifying the reader that the forecast CO2 in the atmosphere for their predicted temperatures is the HIGHLY UNLIKELY pathway. Some postings have said that it is physically impossible, requiring such things as all the minable coal would have to be burned. What does this amount to?   The alarmists are using the Highest CO2 concentration.  They are also using a Equilibrium Climate Sensitivity that historically is too high.   This combination will deliver Highly Unlikely predicted global temperatures.    They need to scare you into going along with the alarmist’s program.

Some scientists and engineers do not believe that carbon dioxide emissions and other so-called greenhouse gases are causing global temperature to rise.  My guess is that most of the scientists and engineers believe that those gases do influence the globe’s temperature.  Within the believing group, however, there is a divide as to how much temperature rise can be attributed to the greenhouse gases.  (Your host, cbdakota, is an agnostic skeptic that believes that on-the- whole, the sun is in control).

From a recent Dr. Roy Spencer blog:

Yes, more CO2 must produce some warming. But the amount of warming makes all the difference to global energy policies.
Seldom is the public ever informed of these glaring discrepancies between basic science and what politicians and pop-scientists tell us.
Why does it matter?
It matters because there is no Climate Crisis. There is no Climate Emergency.
Yes, irregular warming is occurring. Yes, it is at least partly due to human greenhouse gas emissions. But seldom are the benefits of a somewhat warmer climate system mentioned, or the benefits of more CO2 in the atmosphere (which is required for life on Earth to exist).
But if we waste trillions of dollars (that’s just here in the U.S. — meanwhile, China will always do what is in the best interests of China) then that is trillions of dollars not available for the real necessities of life.

Prosperity will suffer, and for no good reason.

Now take this to your children to read.
cbdakota

Secrets That Global Warming Alarmists Don’t Want You To Know- Part 2 -Current Temperatures Are Not Alarming


Recent global temperatures are said to be all time records.  Without any doubt, they say, a degree more will cause severe damage and perhaps be existential.  That is just another salvo of “we are all going to die” misinformation.   Unfortunately there seems to be no member of the media willing to publish a list of the many times we have been told we only have X number of years left before it is too late. The media people are too lazy to do so, or they are politically motivated to keep the scam alive.  Part 1 Secrets that Global Warming Alarmist Don’t Want You To Know Shows the inaccuracy of the Climate models.

Are global temperatures rising?

Not significantly.  And recently they are falling.

Look at the new satellite temperature measurement chart and notice that the March 2021 anomaly is similar to those in 2014-2015 time frame.  March anomaly dropped 0.2C.   And this is after two El Ninos that really boosted the temperature anomalies.  Will April and following months continue a cooling phase?  We can’t be sure, but odds are that it will.  Latest Global Temps « Roy Spencer, PhD (drroyspencer.com)

These satellite measurements are not an outliner.  And they are consistent with weather balloon temperature readings.  Chart Courtsey of Dr.Roy Spencer

The National Oceanic and Atmospheric Administration (NOAA) is a scientific agency within the United States Department of Commerce that focuses on the conditions of the oceans, major waterways, and the atmosphere.

The following NOAA chart shows that the combined global land and ocean temperature has not been rising for the last 5 years, in fact it shows a slight decline.  During this period, atmospheric CO2 has been rising.   They confirm the cooling trend.

Then there is the global warming hiatus.   From 1998 until 2013 there was almost no increase in global temperatures. 

See the NOAA chart below

This caused a lot of agony among the alarmists. Fifteen years, rising atmospheric CO2, four El Ninos with hardly any rise in temperature. The 4 El Ninos raised the temperature and then fell when a La Nina occurred.   NOAA charts from  Climate at a Glance | National Centers for Environmental Information (NCEI) (noaa.gov)

According to Wikipedia:

“It is believed that El Niño has occurred for thousands of years”  and  “There is no consensus whether climate change will have any influence on the occurrence, strength or duration of El Niño events, as research supports El Niño events becoming stronger, longer, shorter and weaker.” 

So, the observed rise in global temperature following an El Nino-La Nina is as likely to be caused by natural causes as by man-made causes. And the trend in the period of the hiatus was only +0.09/Decade.  At that rate, after 100 years, the global temperature rise would be less than 1C— hardly worth all the alarm.

Even at the +0.14c /decade rise of the satellite observed temperatures since 1979, it would take 70 years to raise it 1C.

The warmest ever and the most CO2 ever are claimed, seemingly, monthly by the alarmists.  You are to believe that the current period is the” perfect” climate and any change is perilous.

The alarmists want all the scientific work establishing previous climate condition shoved down the memory hole, never to be seen again.   The globe has seen higher CO2 concentrations in the atmosphere and higher temperatures than those being experienced today.  The chart below illustrates this.

Berner RA, Kothavala Z (2001)GEOCARBlll: CO2 over Phanerozoic time.

And we know that the globe has also been much colder.

So now you know that the global temperature is not rising, in fact for the last 5 years the temperature has been falling.  Further, you know that the Alarmists forecasts of rapidly increasing global warming are not happening.   Their computer programs are biased to predict increasingly warming temperatures in order to scare people into going along with their bogus science.  It is also clear that the rise in global temperatures might be just natural changes.  Do not discount natural changes.  What do you think began melting the glaciers that covered much of North America some 12 to 15 thousand years ago?  It was not CO2 from SUV exhaust pipes.   

I am going to use Dr. Roy Spencer’s comment in one of his recent blogs.  It goes like this:

Seldom is the public ever informed of these glaring discrepancies between basic science and what politicians and pop-scientists tell us.

Why does it matter?

It matters because there is no Climate Crisis. There is no Climate Emergency.

Yes, irregular warming is occurring. Yes, it is at least partly due to human greenhouse gas emissions. But seldom are the benefits of a somewhat warmer climate system mentioned, or the benefits of more CO2 in the atmosphere (which is required for life on Earth to exist).

But if we waste trillions of dollars (that’s just here in the U.S. — meanwhile, China will always do what is in the best interests of China) then that is trillions of dollars not available for the real necessities of life.

Prosperity will suffer, and for no good reason.

Go have your kids read this.

cbdakota

Secrets That Global Warming Alarmists Don’t Want You To Know –Part 1 Climate Models


A dramatic global temperature rise has been forecasts by the alarmists for decades.  Sea level is forecast to reach record heights as the globe’s ice melts.  At every opportunity they tell us that any major storm or weather disruption is due to rising temperature.  We are told that this rise in temperature must be stopped.  A little more than degree C has the potential to be existential.  How do they know this?  Their climate computers tell them.  These computers tell them that the atmospheric carbon dioxide (CO2) from the burning of fossil fuel will wreak this havoc.

The good news is that these computer forecasts of dramatic temperature rise are disproven by actual measurements of global temperature.

One of the recent examinations of the latest batch of climate computers (CMIP-6) was conducted by McKitrick and Christy. 

The above is a screen capture is from a Zoom lecture given by John Christy.   The upper straight line is the mean temperature forecast of the CMIP-6 and historical forecasts made by earlier computer models. The lower Green straight line is the mean of the actual measured temperature for this same period.  The two lines , computer and observed global temperature trends,  intersecting at zero in 1979 and based on 1979 to 2019 only.

The actual  temperature measurements are a blend of satellite and  radiosondes (weather balloons)  .  They confirm one another.

These are the predictions from which generate their alarming pronouncements. They are not reality.    

Science News, for 2/29/20  carries an article titled “Earth’s hot future” and subtitled “As climate models improve, worst-case scenarios are hard to pin down.” The subtitle does not inspire confidence is the predictions.  Then the article talks about how good these models are but they are missing an important piece of knowledge, that being the impact of clouds on climate.  

 Note the jumble the computer ensemble produce.  The individual computers shoot up and then drive downward with a vengeance.  If you could see it clearly, you would reject its output. Real temperatures do not swing that wildly.  So they put all the computer’s output together to average out a mean. The one consistent feature of these computers is that they all show rising temperatures.  Is  that  a “man-made” program bias having little to do with the science? (If the climate computers worked, they would only need one model, not dozens.)   

Another way of visualizing this is the following chart:

The forecast from the computers is for warming to rise at +0.40C per decade.   The observed (actual) warming has been +0.17C per decade. 

Christy says about the performance of the Climate Models used by the warmers:

”You know in any other science, if you have a period of time you’re testing and you go through the first period and you’re already off by a factor of two and a half, on the rate of warming.

You say I better stop i’m going to go back and see if I can fix something that isn’t the way and climate moms they let it go, because the scary story is the one that seems to get the most attention.”

The  charts are from an ICSF Zoom Meeting featuring John Christy as the main speaker. The link is ICSF Zoom Meeting – Zoom.           You will need a password  and it is    S+R$j6N%. 

 The  Christy and McKitrick format for the tests of the CMIP-6 can be found on this website   Pervasive Warming Bias in CMIP6 Tropospheric Layers (wiley.com).

The computers +0.40C per decade imply that the global temperature would increase  by 1.2C by 2050’s.  The alarmists target is to achieve net zero CO2 by that date.

Dr Roy Spencer’s recent posting reviews sea surface temperature versus  climate computer prediction.   He shows a chart that demonstrates that “Global Ocean Temperatures are Warming at Only ~50% the Rate of Climate Model Projections”.   It is another good gauge showing how the alarmists are not playing it straight.  He wraps up his posting with the following :

Seldom is the public ever informed of these glaring discrepancies between basic science and what politicians and pop-scientists tell us.

Why does it matter?

It matters because there is no Climate Crisis. There is no Climate Emergency.

Yes, irregular warming is occurring. Yes, it is at least partly due to human greenhouse gas emissions. But seldom are the benefits of a somewhat warmer climate system mentioned, or the benefits of more CO2 in the atmosphere (which is required for life on Earth to exist).

But if we waste trillions of dollars (that’s just here in the U.S. — meanwhile, China will always do what is in the best interests of China) then that is trillions of dollars not available for the real necessities of life.

Prosperity will suffer, and for no good reason.”

The climate predicting computers overstate the global temperatures by a wide margin as can be seen when compared to actual temperature measurements. Alarmists use them to put fear in to the pubic. Their predictions should never be used for making policy.

OK, now show this to your kids.

cbdakota

Global temperature anomaly drops 0.21 C in March.


The UAH satellite measurements of the lower troposphere temperature dropped 0.21C in March.  Dr Spencer believes that the recent la Nina is being felt globally.

The following is from Roy Spencer, PhD (drroyspencer.com):

Right on time, the maximum impact from the current La Nina is finally being felt on global tropospheric temperatures. The global average oceanic tropospheric temperature anomaly is -0.07 deg. C, the lowest since November 2013. The tropical (20N-20S) departure from average (-0.29 deg. C) is the coolest since June of 2012. Australia is the coolest (-0.79 deg. C) since August 2014.

The linear warming trend since January, 1979 remains at +0.14 C/decade (+0.12 C/decade over the global-averaged oceans, and +0.18 C/decade over global-averaged land).

YEAR MO GLOBE NHEM. SHEM. TROPIC USA48 ARCTIC AUST
2020 01  0.42  0.44  0.41  0.52  0.57 -0.22  0.41
2020 02  0.59  0.74  0.45  0.63  0.17 -0.27  0.20
2020 03  0.35  0.42  0.28  0.53  0.81 -0.96 -0.04
2020 04  0.26  0.26  0.25  0.35 -0.70  0.63  0.78
2020 05  0.42  0.43  0.41  0.53  0.07  0.83 -0.20
2020 06  0.30  0.29  0.30  0.31  0.26  0.54  0.97
2020 07  0.31  0.31  0.31  0.28  0.44  0.26  0.26
2020 08  0.30  0.34  0.26  0.45  0.35  0.30  0.25
2020 09  0.40  0.41  0.39  0.29  0.69  0.24  0.64
2020 10  0.38  0.53  0.22  0.24  0.86  0.95 -0.01
2020 11  0.40  0.52  0.27  0.17  1.45  1.09  1.28
2020 12  0.15  0.08  0.22 -0.07  0.29  0.43  0.13
2021 01  0.12  0.34 -0.09 -0.08  0.36  0.49 -0.52
2021 02  0.20  0.32  0.08 -0.14 -0.66  0.07 -0.27
2021 03 -0.01  0.12 -0.14 -0.29  0.59 -0.79 -0.79

cbdakota

Poll Shows Low Awareness of Scientific Facts


Rebloging  a survey  of public opinion regarding climate change commissioned by the Global Warming  Policy Forum.

GWPF Survey: Perceptions of climate impacts at odds with scientific data
A new Savanta ComRes poll commissioned by the Global Warming Policy Forum (GWPF) has revealed low levels of public awareness of key trends relating to climate change and international development. 
 
The survey of British adults suggests that the public perceive the impacts of climate change to be more negative than the academic research would suggest. However, there is also a significant minority of the public who say they are ‘not very’ or ‘not at all’ concerned by climate change.
 
In total, 28% of respondents said they were ‘very concerned’ about climate change, 42% said ‘fairly concerned’, 18% were ‘not very concerned’ and 6.4% described themselves as ‘not at all concerned’. 

To see the entire posting click on the following link:

GWPF email (mailchi.mp)

cbdakota

The Gold Standard—UAH Satellite Temperature Measurement


February’s UAH global temperature anomaly is +0.20C. That is up 0.08Cfrom January’s +0.12C. The Northern Hemisphere temperature increased despite a major drop in the US contiguous 48 temperature of -0.66C. The Southern Hemisphere went up slightly.

The following chart and table detail the global temperature anomaly.

UAH Global Temperature Update for February 2021: +0.20 deg. C « Roy Spencer, PhD (drroyspencer.com).  

Various regional LT departures from the 30-year (1991-2020) average for the last 14 months are:

YEAR MO GLOBE NHEM. SHEM. TROPIC USA48 ARCTIC AUST
2020 01  0.42  0.44  0.41  0.52  0.57 -0.22  0.41
2020 02  0.59  0.74  0.45  0.63  0.17 -0.27  0.20
2020 03  0.35  0.42  0.28  0.53  0.81 -0.96 -0.04
2020 04  0.26  0.26  0.25  0.35 -0.70  0.63  0.78
2020 05  0.42  0.43  0.41  0.53  0.07  0.83 -0.20
2020 06  0.30  0.29  0.30  0.31  0.26  0.54  0.97
2020 07  0.31  0.31  0.31  0.28  0.44  0.26  0.26
2020 08  0.30  0.34  0.26  0.45  0.35  0.30  0.25
2020 09  0.40  0.41  0.39  0.29  0.69  0.24  0.64
2020 10  0.38  0.53  0.22  0.24  0.86  0.95 -0.01
2020 11  0.40  0.52  0.27  0.17  1.45  1.09  1.28
2020 12  0.15  0.08  0.22 -0.07  0.29  0.43  0.13
2021 01  0.12  0.34 -0.09 -0.08  0.36  0.49 -0.52
2021 02  0.20  0.32  0.08 -0.14 -0.66  0.07 -0.27

The satellite systems for measuring temperatures were pioneered by Roy Spencer and John Christy.  Their University of Alabama at Huntsville (UAH)  satellite began making measurements in 1979. The satellite does not measure temperature directly. It uses microwave sensing of oxygen calibrated to temperature.  Over time it has been joined by other satellites using similar equipment.  The others are  RSS, NOAA, and the University of Washington.  At one time they tracked one another but then they made a change. In my opinion, because their readings are warmer than UAH, they are now considered the “standard. Historically, UAH reports warming at +0.14C/decade and the others read +0.208C/decade.

Spencer explains the nature of the controversy about who is providing the most accurate set of temperatures:

“The only direct comparisons to satellite-based deep-layer temperatures are from radiosondes and global reanalysis datasets (which include all meteorological observations in a physically consistent fashion). What we will find is that RSS, NOAA, and UW have remaining errors in their datasets which they refuse to make adjustments for.

From late 1998 through 2004, there were two satellites operating: NOAA-14 with the last of the old MSU series of instruments on it, and NOAA-15 with the first new AMSU instrument on it. In the latter half of this overlap period there was considerable disagreement that developed between the two satellites. Since the older MSU was known to have a substantial measurement dependence on the physical temperature of the instrument (a problem fixed on the AMSU), and the NOAA-14 satellite carrying that MSU had drifted much farther in local observation time than any of the previous satellites, we chose to cut off the NOAA-14 processing when it started disagreeing substantially with AMSU. (Engineer James Shiue at NASA/Goddard once described the new AMSU as the “Cadillac” of well-calibrated microwave temperature sounders).

Despite the most obvious explanation that the NOAA-14 MSU was no longer usable, RSS, NOAA, and UW continue to use all of the NOAA-14 data through its entire lifetime and treat it as just as accurate as NOAA-15 AMSU data. Since NOAA-14 was warming significantly relative to NOAA-15, this puts a stronger warming trend into their satellite datasets, raising the temperature of all subsequent satellites’ measurements after about 2000.

But rather than just asserting the new AMSU should be believed over the old (drifting) MSU, let’s look at some data. Since Scott Denning mentions weather balloon (radiosonde) data, let’s look at our published comparisons between the 4 satellite datasets and radiosondes (as well as global reanalysis datasets) and see who agrees with independent data the best:

Trend differences 1979-2005 between 4 satellite datasets and either radiosondes (blue) or reanalyses (red) for the MSU2/AMSU5 tropospheric channel in the tropics. The balloon trends are calculated from the subset of gripoints where the radiosonde stations are located, whereas the reanalyses contain complete coverage of the tropics. For direct comparisons of full versus station-only grids see the paper.

Clearly, the RSS, NOAA, and UW satellite datasets are the outliers when it comes to comparisons to radiosondes and reanalyses, having too much warming compared to independent data.

But you might ask, why do those 3 satellite datasets agree so well with each other? Mainly because UW and NOAA have largely followed the RSS lead… using NOAA-14 data even when its calibration was drifting and using similar strategies for diurnal drift adjustments. Thus, NOAA and UW are, to a first approximation, slightly altered versions of the RSS dataset.”

Thank you Roy for the explanation.  I will continue to treat the UAH data as the gold standard.

cbdakota

Paris Agreement As Viewed By Alarmist Postings.


Climate Home News is a publication that believes we are doomed unless we achieve net carbon zero as promoted by the Paris Agreement.   They are disappointed by the reluctance of some of the developed nations to actually comply with drastic reductions in fossil fuel emissions of CO2.  And two nations that are not “developed” nations, those being China and India are not into reductions either.  From Climate Home News recent email message to me, they give voice to their dilemma. The following are a few of their recent postings:

    They believed China was going to get religion and begin backing off from     fossil fuels, particularly Coal.  It did not happen.

China was expected to use Covid-19 cutbacks as a step to reduce use of fossil fuels.  Surprise the Chinese once again fooled the fools that believe Chinese environmental promises.

      Survey says Russian pipelines are leaking more methane than had    been previously believed to be the case.

French climate bill set for rocky ride after citizens’ assembly slams weak ambition

French climate bill is too weak for the warmers.  They cite some of the alarmist groups that are protesting the bill.

Oh my, the Japanese are building new coal plants and neither the US or Japan have a plan to phase out coal.  The Germans have a plan. They are planning on using coal until 2038.

A bonus entry by cbdakota that was not included in the recent Climate Home News postings.

Did you hear that the Russians blocked a UN plan to declare global warming a global emergency?    UN Security Council hears of climate threat, does nothing – POLITICO

Natural Causes for The Declining Global Temperature Part 1.


The global temperature anomaly, as read by the UAH satellite system, dropped in January about 0.03 C to + 0.12C.  This follows a drop of 0.25C to +0.15C in December of last year.  Since the last El Nino, when the anomaly peaked out at +0.50C in February 2020, the anomaly has dropped by 0.38C.

NOTE: We have changed the 30-year averaging period from which we compute anomalies to 1991-2020, from the old period 1981-2010. This change does not affect the temperature trends.

Dr Spencer’s note above, alerts the reader that the anomaly chart was change beginning in January 2021. I believe the scientific organization are all remaking their charts to comply with the new averaging period.   I suspect that it is to make more room above the averaging period.  

Why is the global temperature falling? Has something happened to the Green House gases?  Let us take a quick tour of the natural forces and see what part they are playing.

El Nino-Southern Oscillation

Currently the La Nina is dominating the Tropical Pacific Ocean.  NOAA published an advisory saying:

La Niña—the cool phase of the El Niño-Southern Oscillation climate pattern—was firmly in place across the tropical Pacific in December 2020. Forecasters estimate a 95% chance La Niña will last through Northern Hemisphere winter. La Niña can influence seasonal climate in the United States. Conditions so far have not looked especially La Niña-like, but winter is far from over.

El Nino -La Nina is a naturally occurring phenomena in that it has been observed much longer than the industrial era of fossil fuel C02 emissions. 

Solar Cycle 25

Solar Cycle 25 has been underway since December 2019.   The forecasts comparing SC 25 to SC24 were mostly that they would be comparable. Cycle 24 was the least active SC in 100 years. 

The more active the sun is, the more solar wind and conversely a less active sun produces less solar wind. The Sun’s magnetic field carried by the solar wind regulates the number of cosmic rays that enter the atmosphere.   The less active the sun, more cosmic rays enter the atmosphere.  Thus, low activity should form more cloud cover, thus increasing the albedo. A briefing on how this works is briefly described by a posting on GWPF titled “Force Majeure, The Sun’s role in climate control”, written by Henrik Svensmark:     

“The fundamental idea is that cosmic ray ionisation in the atmosphere is important for the formation and growth of small aerosols into CCN, which are necessary for the formation of cloud droplets and thereby clouds. Changing the number density of CCN changes the cloud microphysics, which in turn changes both the radiative properties and the lifetime of clouds.” (CNC is an acronym for Cloud Condensation Nuclei)

 This would reduce the amount of solar radiation that reaches the Earth’s surface, thus reducing global temperature.

Currently, the solar activity is at a low.

 So, where are we?

The El Nino is a natural phenomenon, that raises the global temperature, and it is usually followed by a La Nina that results in a lowering the global temperature.  We are experiencing a La Nina now.

Solar Cycle 25 in underway and it is forecast to be of low activity.  Time delays are often suggested for the impact of Solar Cycles activity.  This may be the case here and that the impact of Solar Cycle 24 is just now beginning to be felt.

Part two will look briefly at two other natural phenomena that many believe are important in effecting the global temperature.   They are the Atlantic Multidecadal Oscillation (AMO) and the Pacific Decadal Oscillation (PDO).

cbdakota

MCGA (Making China Great Again) –Joe Biden Version.


The following posting is from the Gatestone Institute titled “China doesn’t have to lift a finger to push Biden around”.   The following is from that posting:

“China’s challenge to America is comprehensive, on every front. So far, Biden has taken steps that certainly encourage Beijing. His rejoining the Paris Agreement, his cancellation of the Keystone XL Pipeline, and his repeal of the ban on Chinese equipment in the American electrical grid, among others, favor, directly or indirectly, Beijing. Also of great concern is the failure of Commerce Secretary nominee Gina Raimondo to confirm that Huawei Technologies will remain on the department’s Entity List.

Analysts say Beijing is testing Biden. Yes, but so far the Chinese do not need to lift a finger. The new president is giving them what they want, and they are not even having to ask.”

Maybe the Chinese did not ask but rather told President Biden what they want.  Considering the verified connection of the President’s son with the Chinese and the information obtained from his computer hard drive, the possibility of collusion with the Chinese is credible.  

Rejoining the Paris Agreement and the cancellation of the Keystone Pipeline will weaken the US and that is in the interest of the Chinese.  I will have something to say about those issues later but allowing Chinese equipment in the electrical grid potentially gives them a means of shutting down the grids whenever they would like.

Not using the Huawei technologies in our communication systems is also to prevent them from shutting down our systems and to prevent them spying by eavesdropping.

We convinced the UK not to use Huawei for these reasons.  And now we have a Commerce Secretary nominee that may change our view of the danger. 

We are turning up Chinese spies, and Chinese’s bought and paid for academics and Universities. We have found out that the Chinese have been stealing our technology.   Most damaging has been our military secrets.  So, you will not convince me that they are friendly.  They want to bury the US.

Cbdakota

Alamists Have the Media on Their Side.


I have been consulting or blogging about climate change for some 20+ years.  I began in an advisory role to a member of Delaware’s Legislative body.  That followed by setting up a climate change website.  Alas, I gotten older.  My zeal has not changed but my reduced stamina for research has resulted fewer postings.  And my level of frustration is peaking.

Unfortunately, one thing is unchanging.  That is the alarmists’ predictions are way over the top. I mean by that, their global temperature forecasts, principally made by their computers, are always higher than the measured temperature.  Their statements pronouncing that things are worse that they ever have been, like tornados, hurricanes, droughts, sea level rise, disappearance of the polar ice, end of snow, etc. are refuted by the data regarding those issues.  

I believe that the number of skeptics has increased over those 20+ years, thanks to the increase in number of outstanding skeptic blogs, like WUWT, Icecap, Climate Depot, Principia Scientific, Junk Science, DrRoySpencer, SePP, GWPF and a whole host of other outstanding ones—-just too many to name.

But the skeptics still have trouble getting through the walls erected by the mainstream media. Why the media have dropped their investigative role and adopted a full- throated support for the alarmist is beyond my ability to understand.  Because the predictions of apocalypse by apocalypse made by the alarmers that have not come true, you would think that the media would treat the continuing barrage of over-the-top predictions with distain.  Instead, the predictions get headlines and sycophantic stories.

The alarmist’s kind of “science” should not be the basis for formulating legislation.  Politicians may be good lawyers, but they are typically poor scientists.  Some are opposed to capitalism and want socialism.  Look at President Biden’s Green New Deal site and you will find many of them.  Others are swayed by the media pressure and think they better go along with the crowd.  Some may actually believe the alarmists rants.  Very few of them are scientifically knowledgeable enough to see through the scam.  Today, I do not have confidence that a majority of the Senate Republicans are skeptics.  

The science is not settled so no new legislation, please!

It seems to me that there are only a few things that will swing the pendulum our way.  One is a decline in the living standards and the economy.  Higher prices for everything caused by the cost of electricity, the cost of gasoline, the cost of home heating, and generally the subsequent rise of the cost of living. These are issues that the typical citizen feels and that might change the politicians.

As former President Obama said, 

 Obama: My Plan Makes Electricity Rates Skyrocket – YouTube

The other pendulum swinger is for the global temperature to go flat or begin to drop.  The global temperature went flat for about 15 to 18 years around the turn of the century.  It began to climb again when two El Ninos happened.  They are natural causes, not atmospheric CO2 concentration.  

I have been researching what may bring about big cost of living rises and what are the factors that will cause global temperature to rise or fall in the future.   If I can get something cogent on those two topics, I will post my thoughts.

cbdakota