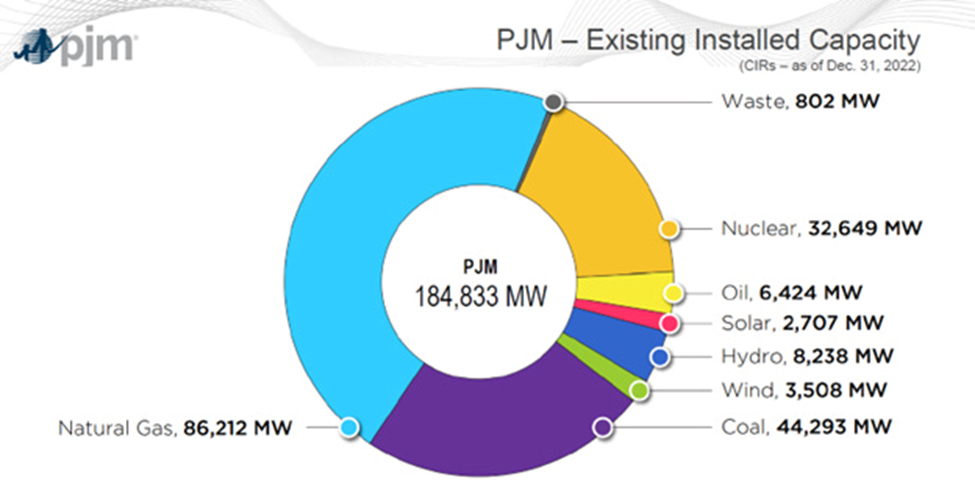
There are a number of grids servicing the US. The Pennsylvania, New Jersey Maryland grid (PJM) is well managed. It is the largest grid in the US. It services 13 States and the District of Columbia. It is the grid that provides my electricity and it has managed to avoid brownouts and blackouts. The reason is that the ratio of fossil fuel (thermal) energy generation to wind and solar generation is 20 to 1. If Nuclear is included the ratio is 26 to1.
The chart shows the PJM Existing Installed Capacity.
The issue PJM is facing is how to make their way through the EPA and States forcing an energy transition. The following explains their fear of losing enough spare capacity to continue to make their Grid reliable:
“Maintaining an adequate level of generation resources, with the right operational and physical characteristics , is essential for PJM’s ability to serve electrical demand through the energy transition. Our research highlights four trends below that we believe, in combination, present increasing reliability risks during the transition, due to a potential timing mismatch between resource retirements, load growth and the pace of new generation entry under a possible “low new entry” scenario: · The growth rate of electricity demand is likely to continue to increase from electrification coupled with the proliferation of high-demand data centers in the region. · Thermal generators are retiring at a rapid pace due to government and private sector policies as well as economics. · Retirements are at risk of outpacing the construction of new resources, due to a combination of industry forces, including siting and supply chain, whose long-term impacts are not fully known. · PJM’s interconnection queue is composed primarily of intermittent and limited-duration resources. Given the operating characteristics of these resources, we need multiple megawatts of these resources to replace 1 MW of thermal generation.” (My highlighting added).
According to PJM this is what it will look like if the State and Feds current plans are not adjusted.
Completely unworkable. Solar, the major electrical source, only available in the day.
The “Storage” at 55,037 watts, is at present, nonexistent. Even if it were charged by excess solar wattage, it, along with the other electrical generators, would not be enough to satisfy peak demands.
PJM management wants everyone to note that the States, not PJM, have the responsibility to maintain resource adequacy on their electric systems.
The EPA has several regulations that will cause a loss of significant reliable capacity of coal based and Natural gas (Thermal Plants) plants. The following are from the PJM’s study:
EPA REGULATIONS
Effluent Limitation Guidelines: will force closing 3,400 MW thermal based capacity.
Coal Combusting Residuals: Will force closing 2,700 MW thermal-based capacity.
Good Neighbor Rule: Will force closing 4,400 MW thermal-based capacity.
STATE ORDINACES
Forcing retirement of the following thermal based capacity.
Illinois: 5,800 MW thermal-based capacity.
New Jersey: 3,100 MW thermal-base capacity.
Virginia-North Carolina: 1,533 MW of thermal-based capacity.
Indiana: 1,318 MW of thermal-based capacity.
Maryland: 305 MW thermal-based capacity.
PJM has avoided system blackouts because they maintain a 22% reserve but the 2030 projected reserve based upon their study will only be 3% .
There two organizations that are commissioned to make the Grids reliable.
The Federal Energy Regulatory Commission, or FERC, is an independent agency that regulates the interstate transmission of electricity, natural gas, and oil.
The North American Electric Reliability Corporation (NERC) is a nonprofit corporation that ensures the reliability of the bulk power system in North America, including the continental United States and Canada.
FERC and NERC have launched a joint review of the performance of the bulk power system during recent winter storms that brought Arctic air across much of North America. The review will look at winter preparation activities and gather information to help guide future winter storm preparations and operations. .The review will look at progress made since FERC and NERC completed joint inquiries into two recent winter storms, Uri in 2021 and Elliott in 2022. The team plans to deliver the results of the review no later than June 2024.
FERC, in my readings, appears to know that renewables are not reliable.
It is obvious that the transition from thermal based electricity to renewable based electricity is not under control. The PJM grid may be the most reliable large grid in the nation. And if corrections are not made, it’s reserve will be only 3% in six years, and that will spell blackouts
“The sales of 20,000 EVs began last month and will continue over the course of 2024, the rental giant said Thursday in a regulatory filing. Hertz will record a non-cash charge in its fourth-quarter results of about $245 million related to incremental net depreciation expense.
The dramatic about-face, after Hertz announced plans in 2021 to buy 100,000 Tesla Inc. vehicles, underscores the waning demand for all-electric cars in the US. EV sales growth slowed sharply over the course of 2023, rising just 1.3% in the final quarter as consumers were put off by high costs and interest rates.”
Just more evidence that the general population do not want the EV.
The title is paraphrasing the Ragin Cajun, political adviser to the Clintons, James Carville. Carville said when asked about the biggest issue in an upcoming election, “it’s the economy, stupid” I contend that the biggest issue for the electric vehicle (EV) is the battery.
The battery represents the proposed transition from gasoline and diesel fuel to electricity. The transition will not be easy, if at all. Usually, major transitions have occurred because some new thing is better than the existing thing. That is not happening here. The EV is more costly, is less flexible, not as capable and is planned to be charged from an electrical grid that is sourced from wind turbines and solar cells. The latter, the so-called renewable energy, has not demonstrated that it is capable of keeping the grids supplying a reliable supply of electricity 24/7. Nowhere. Nada. see here But politicians keep throwing money at these schemes. You must wonder why they would do that. Well maybe not.
The EV sales are not displacing gasoline and diesel vehicles because they are better. No. It is replacing those fuel driven vehicles by Government fiat. Governments are giving EVs huge subsidies, and enacting regulatory systems making gasoline and diesel vehicles attain goals that are not reachable nor necessary. Six states have legislated that no gasoline or diesel-powered vehicle can be manufactured or sold after 2030 to 2035. And the Feds are considering that too.
The WSJ blog posted Car Dealers to Biden: EV’s Are Not Selling reporting that 3900 US car dealerships wrote a letter to President Biden saying his EV sales mandate is not working. They told him that:
“Dealers have a 103-day supply of EVs compared to 56 days for all cars. It takes them on average 65 days to sell an EV, about twice as long as for gas-powered cars. EV sales are slowing though manufacturers have slashed prices and increased discounts.
But most consumers aren’t “ready to make the change,” in part because EVs are still too expensive. Many apartment renters also don’t have garages for home charging, and public charging networks are spotty with one in four not functional, according to one study.
“Customers are also concerned about the loss of driving range in cold or hot weather,” the auto dealers say. “Some have long daily commutes and don’t have the extra time to charge the battery.
The dealers want the Administration to “tap the brakes” on its proposed tailpipe emissions rules that would effectively mandate that EVs comprise two-thirds of car sales by 2032
The dealers’ letter is an important political signal that progressive climate coercion isn’t as popular as Democrats think. Americans don’t like to be told what to do or what they must buy. As the dealers put it, “many people just want to make their own choice about what vehicle is right for them.” Imagine that.
The liabilities that are built in the EV battery are, to name a few:
The Range—how many miles can a charged battery propel a vehicle?
How long does it take to charge the battery?
What is the life of the battery?
How much is the cost of a replacement battery?
How safe are these batteries?
Will insurance rates be hiked up?
If most the materials needed to make a battery are suppled from China, is that worrisome?
Battery recycling?
Major electrical revisions to supply @ home charging?
New fees replacing gasoline tax such as miles driven tax or a tax for charger use.
Government overreach?
The future postings will address these liabilities.
The mainstream media said Hurricane Hillary was the first storm to land in Southern California in 80 years. Well, the Wall Street Journal provided a chart showing that 6 other named storms have come ashore in Southern California in the past 80 years.
And the media has claimed that Hillary is proof of Climate Change, meaning that the globe Is warming because of the use of fossil fuels. But, but, but, the 6 previous ones happened in the last century. How do they explain that? Easy, they ignore it. The Church of Global Warming does not care about facts.
First thing you should see is the following chart showing CO2 emissions by nations and by continent. It looks at major contributors.
The chart tells us that China is the primary source of CO2 emissions. The chart also shows what the two other major industrialized contributors, the North American continent and the European Union. The North American Continent is made up of Cananda, Mexico and America with the America being the biggest emitter.
The worldpopulationreview provided this list:
Top 10 Countries with the Highest CO₂ Emissions in the World (Unit: million tons CO₂) – 2020 EDGAR:*
These numbers are a little dated as the US emissions continue to decrease and the Chinese and Indian emissions are increasing.
Asia, consisting of China, India, Japan, Korea, Australia, etc. are already emitting twice as much as North America and Europe combined. Leading the Asian nations are China and India. They are not going to stop building coal based plants. Their rationale is that they need this to bring the living standards of their people up to our standards. China and India’s populations are each more than 1 billion. They are on their way to more than triple the emissions difference. Excluding Japan, Korea, and Australia , many of the other Asian nations are underway with plans to use fossil fuels to create wealth for their people.
China has said that in 2030, they will begin to reduce CO2 emissions. I doubt that they will, because for years they have announced they were through building coal based power plants. Rather they continually change their mind and announce they are building more of them. They are the world’s largest manufacturer of solar cells. So, it is not that they do not have renewable energy access, but rather they are enlightened enough to know that solar and wind will never replace fossil fuels.
And what are we doing? Why, we are spending trillions of dollars on wind and solar energy sources. The idea of replacing fossil fuels is an illusion. Certain factions are touting a future where wind and solar are the sole sources of energy. No North American or European nation have ever been able to supply their customers on a 24/7 basis and it is doubt full that they ever will. For example, Germany, with wind and solar nameplate capacity in place, that exceeds the nation’s electrical demand, have been unable to run without their fossil fuels plants.
And now, a couple of quotes:
“Even if the United States were to get rid of all fossil fuels, this would only make a difference of two-tenths of one degree Celsius in the year 2100, according to Heritage Foundation chief statistician Kevin Dayaratna.”
And a quote from President Biden’s Climate Tsar, John Kerry.
“The fact is that even if every American citizen biked to work, carpooled to school, used only solar panels to power their homes, if we each planted a dozen trees, if we somehow eliminated all of our domestic greenhouse gas emissions, guess what — that still wouldn’t be enough to offset the carbon pollution coming from the rest of the world,” Kerry said in 2015.
On November 30, 2020 Roger Pielke, jr posted “The Unstoppable Momentum of Outdated Science”. It was subtited : “Much of climate research is focused on implausible scenarios of the future, but implementing a course correction will be difficult”.
It is almost a year and a half since posting but the problem still exists.
President Biden has called for 50% of all new car and light truck sales be Zero Emission Vehicles (ZEV) by 2030. Even more draconian laws from States like California say:
“…….. all new cars sold in the state by 2035 be free of greenhouse gas emissions like carbon dioxide”.
That means no gasoline vehicle sales can be made in California after 2035.
What is the outcome of these proposals that only allow ZEV to be made? The Fuels Institute, a proponent of the man-made global warming, posted “Reducing carbon emissions effectively-now and tomorrow” has the answer. The charts premise is that of California’s pathway, meaning 100% of new car sales are ZEVs and no new fossil fuel powered cars can be sold.
“As the chart shows, in a hypothetical scenario in which all U.S. light duty vehicle sales are required to be ZEV in 2035, the market would likely only convert 16.5% of vehicles in operation to ZEV by that time. This would leave 83.5% of vehicles in 2035 still operating primarily on liquid fuels used in combustion engines with a potential life expectancy of longer than 20 years. This means that BEVs and a cleaner electricity grid will not be able to significantly cut transportation-related CO2e emissions for many years to come, resulting in increased atmospheric concentrations that will linger for another 100-plus years
It might be possible for the manufacturers to make enough ZEVs, but it may not make any difference if the manufacturers can. The cost, the range anxiety, the charging time, fires, etc. have turned off the common man buying ZEVs so far.
This view looks north on Plumas Street, just north of Bridge Street in the heart of the Yuba City, California business district. The massive Northern California flood of 1955 remains the deadliest to hit the Yuba City and Marysville region. 38 were killed, 280 homes were destroyed and over 1500 were damaged. The Shanghai Bend on the west levee of the Feather River, about one mile south of Yuba City was breached around midnight on Christmas Eve, and a wall of water cascaded into Sutter County, which forced thousands of residence to evacuate their homes. Photo courtesy of the U.S. Air Force, 136th Engineer Aviation Brigade from Beale Air Force Base. Photo taken December 25, 1955.
Courtesy photo U.S. Force 136th Engineer Aviation Brigade
The American Thinker site posted a blog “Too Wet? Too Dry? It’s All Climate Change”. The author Brian Joondeph debunks the catastrophic global warming. He begins with:
“Climate change, as defined by the United Nations: “Refers to long-term shifts in temperatures and weather patterns. These shifts may be natural, such as through variations in the solar cycle.” That’s actually a good definition.”
“But not willing to leave well enough alone, the UN goes further, spoiling a simple and straightforward definition with: “But since the 1800s, human activities have been the main driver of climate change, primarily due to burning fossil fuels like coal, oil and gas.”
“It is amazing that before humans burned fossil fuels two centuries ago, it was only natural cycles that changed the climate, not backyard barbecues, gas stoves, and SUVs. Yet the UN does not explain how previous ice ages developed due to global cooling, followed by melting of mile-thick ice over the upper Midwest due to global warming, multiple times over the Earth’s history, long before there was any significant human activity.”
“Climate change” was first mentioned in 1975, but this was a time when climate scientists could not decide if temperatures were rising or falling, attributing sinister causes rather than natural and cyclic warming and cooling trends which have long preceded humans and their activities”.
“Since then, climate change has engulfed more than temperature, adding weather events such as hurricanes, tornadoes, blizzards, droughts, and flooding. It seems that any deviation from a sunny day with temperatures in the mid ’70s with a light breeze is evidence of climate change and Republicans scheming to destroy the planet”
“The New York Times, in 2014, ran an opinion piece titled, “The end of snow?” predicting the demise of winter sports and the Winter Olympics due to global warming. Eight years later in 2022, the New York Times told us, “How climate change can supercharge snowstorms.”. Or also in 2022 how, “The deadly freeze that swept the United States was extraordinary, but while scientists know that global warming can intensify extreme weather, the effects on winter storm are tricky to untangle.”
“Tricky indeed. Climate change causes both not enough and too much snow. How does that work? But it’s not only snow but water, both not enough and too much, all due to omnipotent climate change.”
From there he examines the droughts in California. He cites the California Department of Water Resources relating the droughts are frequent. They also say floods are frequent too.
“Again, floods are normal and expected. They are nothing new. Here are photos of floods going back 150 years. “
RealClear Energy posted an entry by Robert Bryce titled “Solar Energy Rejections in 2022 that refutes mainstream media’s assertion that the rejections are due to energy companies “misinformation. The following comes from Bryce’s entry:
“You won’t read about this in The New York Times or TheNew Yorker, but 2022 was a record year for the number of solar energy projects that were rejected by rural communities in the United States.
As I show in the Renewable Rejection Database, nearly 80 rural governments either banned or restricted solar energy projects last year
In all, more than 40 Ohio townships adopted measures last year that prohibit the construction of large solar or wind projects, or both. Across the U.S., about 106 communities have rejected or restricted solar projects since 2017. The number of wind rejections also jumped last year, with 55 communities enacting ordinances or other measures that prohibit the installation of large wind facilities. Since 2015, about 360 communities across the U.S. have rejected or restricted wind projects. (Note that last year, I published numbers that were slightly higher than that. In my continuing updates to the database, I found some entries that were duplicates and deleted them.)
To be sure, these facts, and these numbers, don’t fit with the narrative being peddled by legacy media outlets. Last year, National Public Radio ran an article claiming that rural Americans were peddling “misinformation” in their efforts to prevent wind and solar projects from being built in their neighborhoods. Last month, an article published in TheNew York Times claimed that opposition to wind projects in Michigan included “anti-wind activists with ties to groups backed by Koch Industries.” But the reporter who wrote the article, David Gelles, didn’t provide any proof of any Koch connections. (Gelles did not reply to two emails asking him for substantiation of his claim.) Last month in The New Yorker, climate activist Bill McKibben claimed that “front groups sponsored by the fossil-fuel industry have begun sponsoring efforts to spread misinformation about wind and solar energy.” But like Gelles, McKibben didn’t provide any proof for his claim.
In all of the years I’ve been reporting on these issues, I have seen no evidence of Koch funding or “front groups” sponsored by the hydrocarbon sector. What I have seen is an increasing effort by the wind and solar lobbies and their claqueurs to discredit people who stand in the way of these projects. Perhaps that’s not surprising. Tens of billions of dollars in federal tax credits are at stake. Companies like Apex Clean Energy can’t feed at the federal trough if they don’t build projects.
Land-use conflicts are the binding constraint on the growth of renewables. The fundamental limitation isn’t money, it’s physics. Wind and solar energy have low power density. That means that attempting to use them to displace large quantities of hydrocarbons will require staggering amounts of land. For instance, last year, Jesse Jenkins and several of his colleagues at Princeton University produced a model to predict how much new wind and solar capacity could be built due to the supertanker of cash that Congress earmarked for renewables in the Inflation Reduction Act. In a Q&A published in these pages last year, Jenkins told me that the land required to accommodate the hundreds of megawatts of new wind and solar under the IRA would require a land area about the size of Tennessee. Here’s a newsflash: we don’t have any spare Tennessees lying around.
Rural Americans are fighting back against wind and solar projects because they want to retain the character of their townships, ranches, farms, and villages. And no amount of spin from The New York Times will change that fact.”
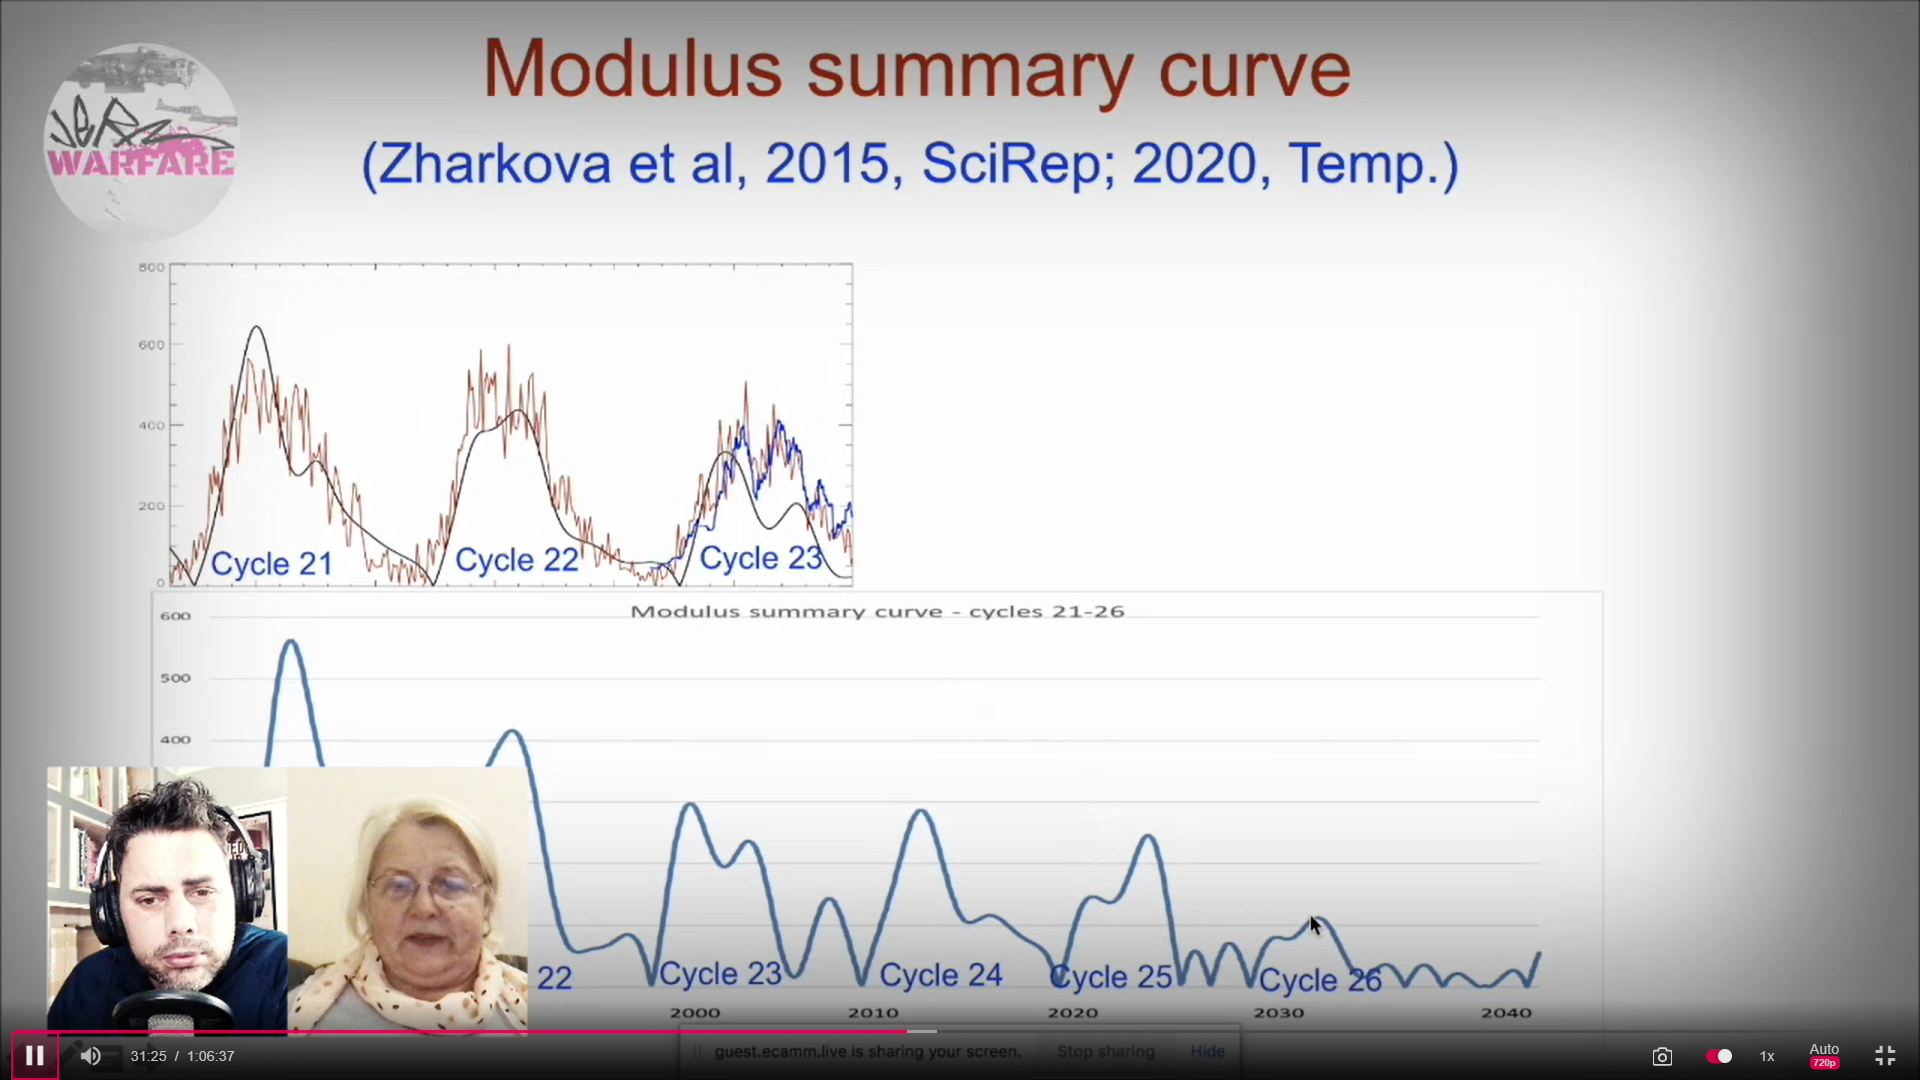
The chart above shows the forecast for Solar Cycles 25, 26 and beyond by Valentina Zharkova.Phd. She believes that she and her team have determined how to forecast solar cycle activity. Solar Cycle 25 is underway and she predicts it will be less active than Solar Cycle 24 and Solar Cycle 26 will be much less active.
Madame Zharkova is much bolder than many other experts with respect to when or if there will be a solar minimum. Before we discuss Madame Zharkova, let’s look into some of the issues that surround the question of an upcoming Solar Minimum.
** The video begins at (2 minutes and 14 seconds.)
To begin with, look at the December 2022 Global temperature. It dropped to an anomaly of 0.05C from November 2022’s 0.17C anomaly. This measurement continues the decline of global temperatures since the last El Nino where the anomaly peaked at about 0.4 C. (Red line)
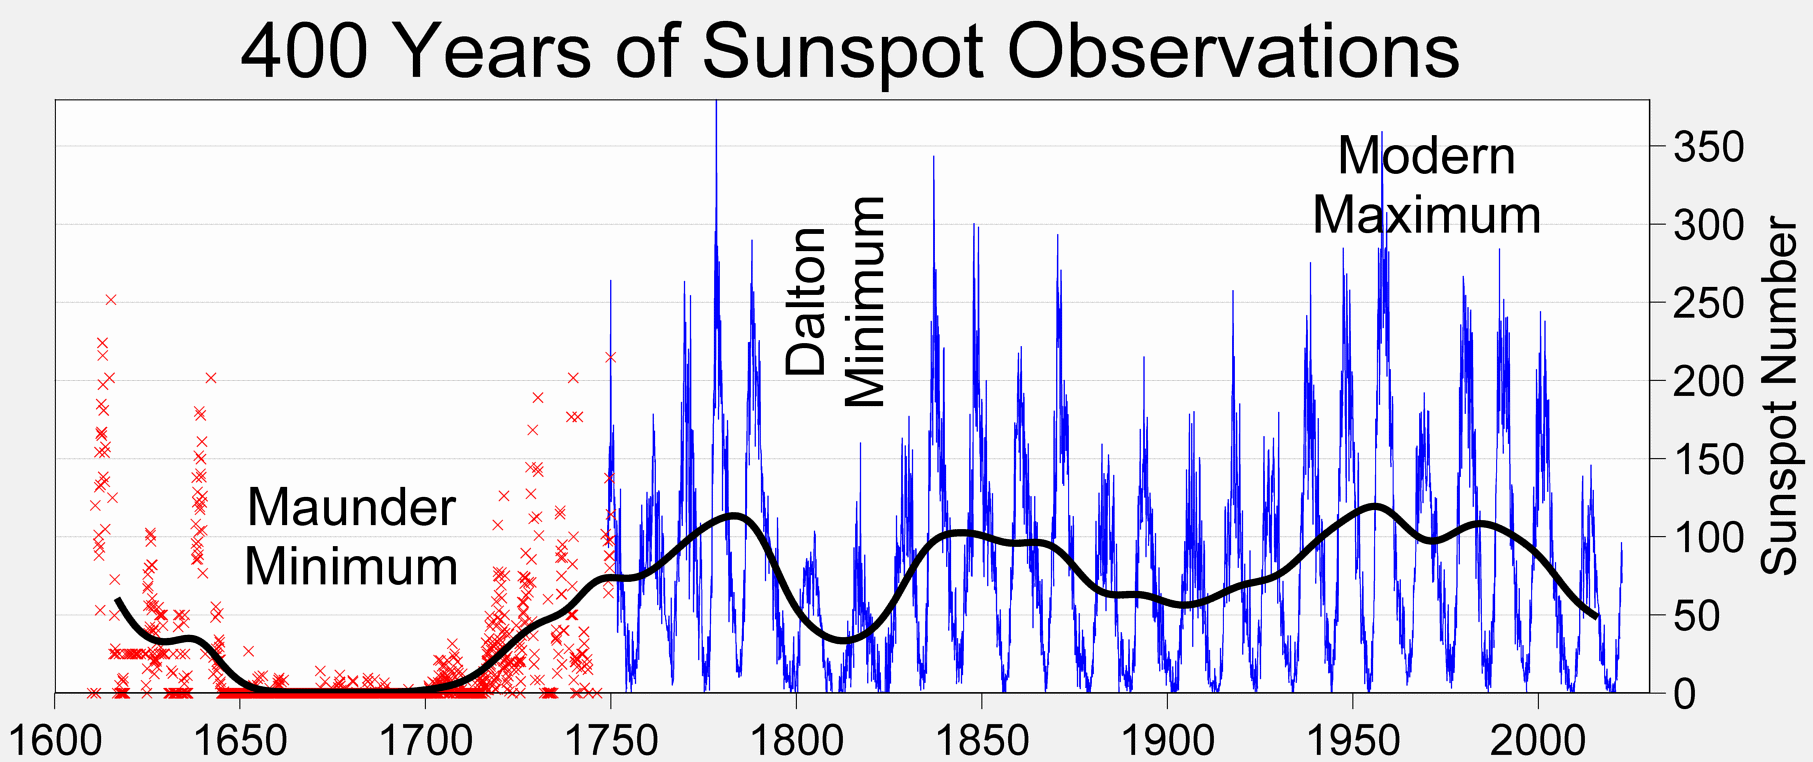
This has resulted in a number of people saying we are on our way to another “little ice age”. Let’s look at several predictions of serious global cooling
ENSO is the system name acronym for and the Southern Oscillation. It a major factor affecting global temperature.
The El Nino (ocean warming) and the La Nina (ocean cooling) are considered natural phenomena, meaning that they are not man-made actions. A simplistic description of this phenomena is that over a period of time sun and or submerged volcanos, warm a body of western Pacific Ocean, lying along the equator and its temperature rises. This causes atmospheric changes and the hot water flows eastward to the coast of South America. This is called El Nino. After several years the conditions change and the body of water flows westward and cool, deep ocean water along South America coast rises This is the La Nina.. This ebb and flow has a major effect on global weather.
The above chart illustrates the Nino and Nina occurrences from 1990 to the present. Comparing the temperature chart and the Ninos charts show that when an El Nino occurs the global temperature rises. Conversely global temperature drops when a La Nina occurs. The charts seems to show that El Ninos are stronger that La Ninas. (It would be interesting if someone had measured the chart area for the two.)
Now eyeballing the charts, it looks like the strong El Ninos, a natural occurrence, are the major mover of the global temperatures.
Examining the global temperature chart, the period following the 1997 -1998 El Nino, stretching out to about 2015 shows that global temperature is flat, in other words, no significant change in global temperature was recorded. Something like 15/16 years. This happened even though atmospheric C02 was increasing. Does this relegate CO2 to be only a minor forcing? Does this indicate that the sun (or volcanos) are causing global temperatures to rise?
Viewing Solar Cycles.
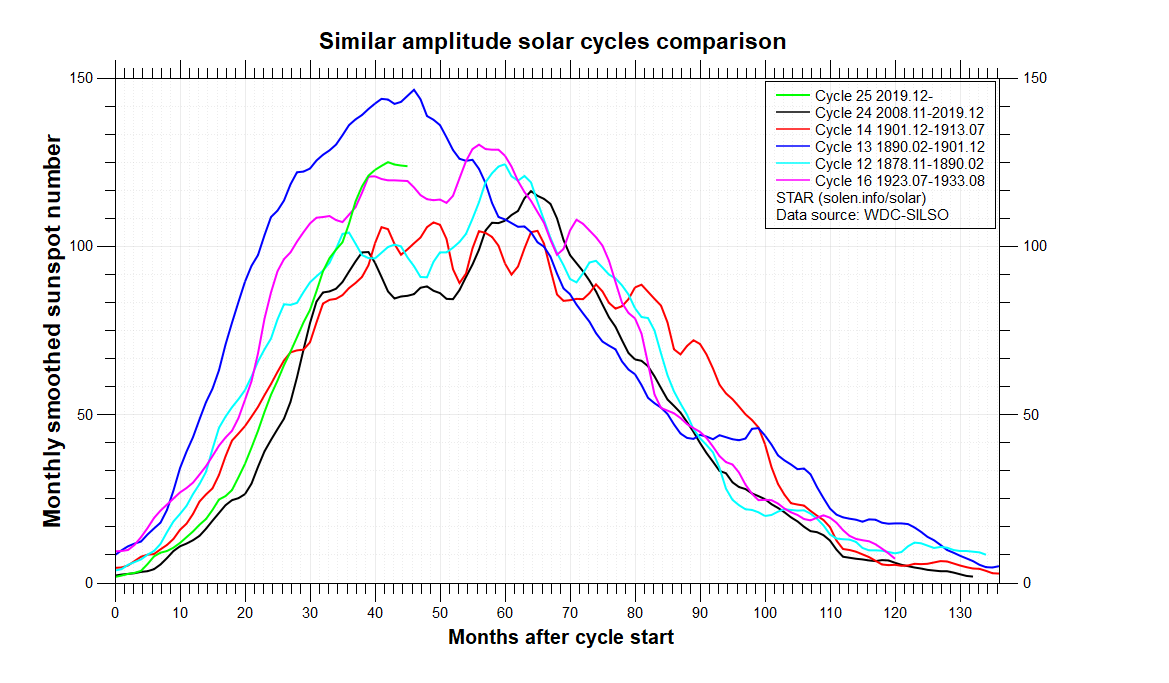
Solar Cycle 24 was much less active than its predecessors. The new Cycle 25 activity is almost identical to Solar Cycle 24 as can be seen in the following chart
Cycle 25 at 30 months after cycle start is the green line and that is where Cycle 24, the black line, was at thirty months. The other Cycles, from other years, that had unusually low activity are shown on this chart. Cycle 24 the black line was less activity than the others.
For contrast, the following chart shows the “Modern Maximum”, group of Cycles, meaning very active. The chart is a little dated as the last rising blue line is Solar Cycle 24.
The solar cycles 24 and 25 are substantially less active than their predecessors. There is really no strong signal yet that the temperature is dropping due to low activity Solar Cycles. Perhaps there is a time delay built into the system.
Cloud Formation due to weak Solar Cycles
This allows us to examine three theories. First comes the Svensmark theory: From the posting “comes this description of the theory:
“In 1995, Henrik Svensmark discovered a startling connection between the cosmic ray flux from space and cloud cover. He found that when the sun is more active–more sunspots, a stronger magnetic field, larger auroras, stronger solar winds, etc.–fewer cosmic rays strike the earth and cloud cover is reduced, resulting in warmer temperatures.” When the sun is inactive, more of them penetrate the atmosphere. Upon reaching the lower atmosphere where more sulphur dioxide, water vapor, and ozone is present, the cosmic rays ionize the air, releasing electrons that aid in the formation of more CCN and form more dense clouds. This increase in low-cloud amount reflects more solar energy to space, cooling the planet.”
CERN set up chambers to test this theory. While there was some verification, they said that cosmic rays did form clouds, but the formation was much too small to have any effect. It appears that there are many that still think Svensmark is correct. We will have to wait to see future developments.
There are some new theories positing that Ultra Violet (UV) is a player.
First some UV information from Wiki: “The Sun emits ultraviolet radiation at all wavelengths, including the extreme ultraviolet where it crosses into X-rays at 10 nm. Sunlight in space at the top of Earth’s atmosphere is composed of about 50% infrared light, 40% visible light, and 10% ultraviolet light, for a total intensity of about 1400 W/m2 in vacuum.[22]
The atmosphere blocks about 77% of the Sun’s UV, when the Sun is highest in the sky (at zenith), with absorption increasing at shorter UV wavelengths. At ground level with the sun at zenith, sunlight is 44% visible light, 3% ultraviolet, and the remainder infrared.[23][24] Of the ultraviolet radiation that reaches the Earth’s surface, more than 95% is the longer wavelengths of UVA, with the small remainder UVB. Almost no UVC reaches the Earth’s surface.[25]
The shorter bands of UVC, as well as even more-energetic UV radiation produced by the Sun, are absorbed by oxygen and generate the ozone in the ozone layer when single oxygen atoms produced by UV photolysis of dioxygen react with more dioxygen. The ozone layer is especially important in blocking most UVB and the remaining part of UVC not already blocked by ordinary oxygen in air.”
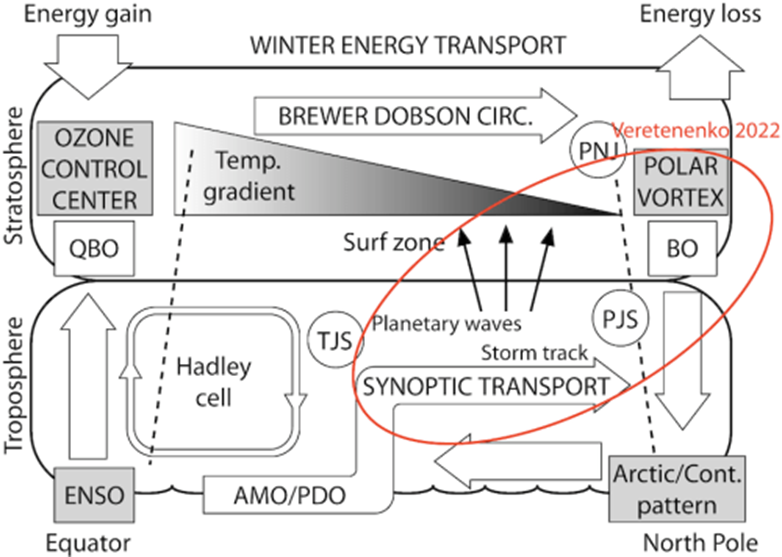
Here is one of the UV theories It is called the Winter GateKeeper Hypothesis. I would like to say that I know enough to describe this hypothesis, but I can not. Dr Judith Curry has posted it on her site, which I think is a favorable appraisal of this hypothesis. She has also noted another researcher which seems to have a favorable opinion. So I will give you a summary:
“The Winter Gatekeeper Hypothesis integrates different components of the transport system in the stratosphere, troposphere, and ocean. A schematic of the energy processes involved is presented in Fig. 8.1, with energy transport represented by white arrows. Solar modulation starting in the stratosphere affects all transport, and Vinós (2022) showed a solar effect on ENSO and the polar vortex. The mechanism by which solar activity modulates ENSO activity is still unknown, but this author proposes a solar modulation of the Brewer-Dobson tropical upwelling, known as the “tropical route” of the “top-down mechanism” (Maycock & Misios 2016; Vinós 2022).”
“Fig. 8.1. Northern Hemisphere winter meridional transport outline. The energy gain/loss ratio at the top of the atmosphere determines the maximal energy source in the tropical band and the maximal energy sink in the Arctic in winter. Incoming solar energy is distributed in the stratosphere and troposphere/surface where it is subjected to different transport modulations. Energy (white arrows) ascends from the surface to the stratosphere at the tropical pipe (left dashed line) and is transported towards the polar vortex (right dashed line) by the Brewer–Dobson circulation. Stratospheric transport is determined by UV heating at the tropical ozone layer, which establishes a temperature gradient affecting zonal wind strength through thermal wind balance, and by the quasi-biennial oscillation (QBO). This double control determines the behavior of planetary waves (black arrows) and determines if the polar vortex undergoes a biennial coupling with the QBO (BO). In the tropical ocean mixed-layer, ENSO is the main energy distribution modulator. While the Hadley cell participates in energy transport and responds to its intensity by expanding or contracting, most energy transport in the tropics is done by the ocean. Changes in transport intensity result in the main modes of variability, the AMO, and PDO. Outside the tropics, most of the energy is transferred to the troposphere, where synoptic transport by eddies along storm tracks is responsible for the bulk of the transport to high latitudes. The strength of the polar vortex determines the high latitudes winter climate regime. A weak vortex promotes a warm Arctic/ cold continents winter regime, where more energy enters the Arctic exchanged by cold air masses moving out. Jet streams (PJS, polar; TJS, tropical; PNJ, polar night) constitute the boundaries and limit transport. Red oval, the part of the Winter Gatekeeper Hypothesis studied in Veretenenko 2022. Figure from Vinós 2022”
Finally, a few notes about the Zharkova theory.
From the posting in Principia Scientific titled “The Woman Who Could Cancel Net Zero”comes another theory. The woman in this case is Professor Valentina Zharkova of the University of Northumbria. The professor’s fields are applied mathematics, plasma physics, pattern recognition, solar-terrestrial physics and solar activity. She forecasts that “in the next 30yrs, global warming problem will be last thing in our mind. Then the solar cycles return to being active.
With her team, she has studied the Sun’s many magnetic fields. She says that sunspots are not a strong enough signal to base any predictions on. So the team separated the magnetic fields in separate components with a principal component analysis using Eigen vectors and Eigen values. She used the output to create a method to predict solar cycle activity. She maintains that she demonstrated that the teams work can closely match the past solar cycles and they can use it to project the future solar cycle activity.
It would be enormous step in understanding the Sun if Dr Zharkova’s system proves out. It might well be a big hit on the man-made global warming theory, too.


