Monthly Archives: September 2015

“ Average Global Temperature”? Do You Know What It Represents?


The warmers are saying that we cannot let the global temperature increase by more than 2ºC. According to them, really bad things will happen if we exceed that number. The 2ºC must be another of those “tipping points” that we have heard so much of in recent years. Most all of which have come and gone with out any noticeable effect.

What is the global temperature? You almost never hear it expressed like a typical temperature reading you get each day from the weather stations.   The only place I can find a description stated as a typical temperature reading is from the World Meteorological Organization saying that the average global temperature, between 1961 and 1990, was 14ºC (57.2ºF). But I find nothing more recent. One reason is that an agreement around a specific temperature is difficult to come by.

At the South Pole, the highest temperature ever recorded was 12.3º C (9.9ºF).  Singapore’s record low was 19.4ºC (66.9ºF). So where is the average?   An average global temperature does not exist in the real world.  I will discuss near the end of this posting.

Anomalies are used instead.  A long-term average is used for reference and the tempanomaliestemperature differences from that are termed anomalies.   Positive anomalies and negative anomalies are increases or decreases, respectively, from this long-term reference. Further these changes are very small. If you made a chart plotting a series of numbers of slowly warming normal temperature readings say:14.0ºC, 14. 01ºC, 14.01ºC, 14.02ºC, 14.02ºC, 14.03ºC,  you probably would not be able to visibly detect any change.   How frightening would that be?  Everything looks more dramatic when you plot the anomalies (0.01, 0.02, 0.o2, etc.).

Continue reading

“How Reliable Are The Climate Models” (Reblogged from WUWT)


I am reblogging a posting from WUWT by Mike Jonas titled: How reliable are the climate models?” The first chart in the WUWT posting illustrated the climate model unreliability.  The fact that climate models are not reliable has been covered on my blog, Climate Change Sanity, and many others. Often we talk about the fact that water vapor is the major “greenhouse” gas and not carbon dioxide (C02). Yet this issue is not the only reason these models have gone astray.   The WUWT blog discusses a number of other physical properties that have an effect on the “coupled nonlinear chaotic system” that is our atmosphere, that the models do not attempt to model.

The models are the basis for all the things that are forecast to happen —sea level rise, weather chaos, etc –  with their forecasts of very high global temperatures cause by CO2. Do we have a problem? Maybe but the climate models are unable to tell us anything.

cbdakota

WATTS UP WITH THAT

How reliable are the climate models?
Guest Blogger / 3 days ago September 17, 2015
Guest essay by Mike Jonas

michaels-102-ipcc-models-vs-reality

There are dozens of climate models. They have been run many times. The great majority of model runs, from the high-profile UK Met Office’s Barbecue Summer to Roy Spencer’s Epic Fail analysis of the tropical troposphere, have produced global temperature forecasts that later turned out to be too high. Why?

The answer is, mathematically speaking, very simple.

The fourth IPCC report [para 9.1.3] says : “Results from forward calculations are used for formal detection and attribution analyses. In such studies, a climate model is used to calculate response patterns (‘fingerprints’) for individual forcings or sets of forcings, which are then combined linearly to provide the best fit to the observations.”

To a mathematician that is a massive warning bell. You simply cannot do that. [To be more precise, because obviously they did actually do it, you cannot do that and retain any credibility]. Let me explain :


CLICK HERE TO READ THE REST OF THIS WUWT POSTING

“Recycling In Recent Years Has Become A Money-Sucking Enterprise.”


The Washington Post (WP) posted “American recycling is stalling, and the big dcrecycling61434652573blue bin is one reason why.” The posting was made June 20 and has been sitting in my “things to write about” box for a while. Yesterday’s report on Fox News about Seattle fining residents that put food, recyclable or yard waste in their garbage reminded me of that article.

So what is the reason for the recycling stalling? According to the article, recycling is no longer profitable.   The District of Columbia (DC) Council made a $1.2milion payment to Waste Management last year apparently to keep them recycling DC wastes. In 2011 DC made a profit of $389,000, but the situation has changed.

Continue reading

New Oil And Gas Find In The Mediterranean.


A large field (named Zohr) containing up to 30 trillion cubic feet of natural gas has been discovered off the coast of Egypt. The Italian oil group Eni, owner of rig_3424204bthis field, says it is almost 5000 feet below the water surface and covers an area of about 40 square miles. Eni proposes that it be piped into Egypt for use.

The Telegraph.co.uk posting titled ‘Supergiant’ gas field discovered in Mediterranean” says:

“Egypt consumed 1.7 trillion cubic feet of natural gas last year, according to BP’s most recent Statistical Review of World Energy. At the same rate of consumption, the Zohr discovery could supply the country for almost two decades.

Continue reading

What US Counties Are Frequently Hit By Hurricanes? See Charts To Find Out.


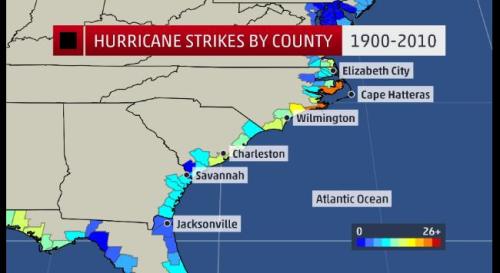
It is fitting that this posting, as well as the two preceding, be about US hurricanes as this is the time for them to get generated off the coast of Africa and begin their journey to the US. The following charts show the US shore line, by county, along the Gulf of Mexico and the Atlantic Ocean and how many hurricanes have made landfall in those counties for the period of 1900 to 2010.

Beginning with chart 1 along the Gulf Coast:

huricanestrikes1fb68b187-c115-40e2-a295-3ac3bce920f7The  scale on the right shows the range of strikes from 0 to 26+.

Chart 2 along the  Eastern Gulf coast around to the Southern Atlantic Coast

f5cc3e02-39c4-45ce-b7f9-f8ef9d9d7f34

Chart 3 goes the South East Atlantic coast.

1b0aeafc-8124-4415-9d1f-0b90b15aaf21

Chart 4 shows Mid-Atlantic coast

9b4ac7f4-980f-46f6-9ad0-275d741ffd68

Chart 5 shows the Northeast coast

f645eafe-258d-48e0-9f4d-96d7bfd60732

The charts are all courtesy of Weather.com

Some thoughts.  Perhaps  you could play the odds and say I can build along this coast line because hurricanes seldom strike here. One of my friends grew up on the Rhode Island/Connecticut border (see chart 5) and he tells of the massive hurricane that struck there in 1938.  Chart 5 counties do not get pummeled like the Gulf coast, Florida on the Atlantic and the Gulf sides, and the northeastern part of North Carolina Chart 3).  Anyway, I would not bet the farm based upon these charts.

When you are in the possible path of a hurricane,  things can get pretty uncomfortable.  No need tell you-all that, that live in counties frequently threatened. My first one was in Beaumont Tx.  At the last moment it veered west toward the Winnie-Anahuac area and did not make to much of an impact on the Neches River area.  In 2005 I worked with my son rehabbing his Tampa house that he wanted to sell.  A hurricane was on its way and the exact landfall point was still being guessed at.  I was told by the natives that Tampa almost never got hit by hurricanes.  That hurricane was category 3 “Wilma”.  Fortunately Wilma made land fall south of Tampa and none of the rehabbing work was ruined.

Lets hope that no big one come in this year.

cbdakota

No Category 3 Hurricanes Making US Landfall In Nearly 10 Years.


If by October 24 this year no category 3 or higher hurricane has made landfall in the USA, it will be ten years since the last major hurricane did so. Major hurricanes are those designated category 3 or higher.

Hurricane Wilma was the last major hurricane (category three) to make landfall in the United States on October 24, 2005. Wilma, carried winds of 120MPH, when it came ashore in the southwestern coast of Florida. Katrina, also a category 3 hurricane, preceded Wilma having come ashore in the Gulf Coast on August 29, 2005.

The US uses the Saffir-Simpson hurricane intensity scale to rate the potential damage/danger that the storm brings.

Cate Damage Windspeed, MPH Windspeed, M/S
1 Minimal 74-95 33-42
2 Moderate 96-110 43-49
3 Extensive 111-129 50-58
4 Extreme 130-156 59-69
5 Cata’rophic Greater than 156 Greater than 69

If conditions are just right, tropical storms like Sandy that came ashore in sandy-pier-rollerc_2384216kAtlantic City on October 29, 2005 can cause enormous damage. Sandy dropped over 11 inches of rain on Atlantic City.  Associated storm surges played havoc along the coastline and into the New York Harbor area where water flooded sections of New York City.   Some storms like Sandy, said to have caused damage estimated to be more than $36 billion, sometimes fight above their weight class.   This usually occurs where there are much building and settlement along the coast.

“Man-made global warming” is forecast to make hurricanes become more frequent and more dangerous.   Although it appears that the correlation between man-made global warming and hurricanes is some what tenuous, that has not stopped those who choose “alarm” over science to shout how bad it is and how bad it will be.

And now for some forecasts by the alarmists from a posting on Fabius Maximus.com. :   “Since Katrina, climate activists have beat a steady drumbeat warning of doom.

See ten even more outlandish predictions from the big 3 networks.

Some thoughts. Hurricanes seem to have a cycle of sorts, as shown in my previous posting. So, category 3 hurricanes may make a comeback at any time. But if increased global temperature is the reason for more hurricanes, perhaps the current pause and the lack of a lot of hurricanes or any major hurricanes prove the global temperatures have not been rising. One has to wonder if the real Man– made global temperature rise is the result of the manipulation of the raw temperature readings. Or at least a lot of it.

cbdakota


Hurricanes Typically Peak in Early September, But At The Moment, There Are No Active Hurricanes.


“As we reach the historical peak of the Atlantic hurricane season, there are no active hurricanes in the Atlantic or the Pacific basins. If fact, Wednesday afternoon marked the first time that we had no active hurricanes in the Atlantic or the Pacific since Aug. 26, according to Phil Klotzbach of Colorado State University and blogger for wunderground.com.“  The preceding quote is from a Weather.com posting on 10 September titled “There Are No Active Hurricanes in Atlantic or Pacific as Peak of the Season Arrives

The posting says that normally by this time, we would have had 3 hurricanes but so far we have had but one—Hurricane Danny that existed from 20-22 August.   The postings adds:” When looking at long-term averages of hurricanes and tropical storms in the Atlantic Basin, there is a broad maximum from late August through September. However, within this broader period is a peak that typically occurs around Sept. 10 or 11, depending on what data is used for the calculation.

The following chart illustrates the peak hurricane season.

peaks-by-typehuricame

Continue reading

Study Shows Global Tree Count 7.6X Larger Than Previously Thought.


Nature .com posted a study titled “Mapping tree density at a global scale”. This appalachiansimagesstudy dramatically changes our understanding of the number of trees on the globe. The study’s count is 3.04 trillion trees (3.04X10^12), which replaces the previous estimate of global trees of 400billion (400X10^9). As a point of reference, the study also expresses the change as trees per humans. Considering the currently estimated total global population of 7.2 billion (7.2X10^9), the study now shows the old count of 61 trees per person has grown to 422 trees per person.

New Count Old Count
TREES, BILLIONS 3,040 400
TREES PER (WORLD) CAPITA, 422 61

TABLE 1—NATURE .COM STUDY

Continue reading

Don’t Worry About The National Debt, Radical Islam or Aggressive Nations, The Biggest Danger Is Global Warming


President Obama goes to Alaska to put before the members of the Arctic Council, alaskaoila pact that commits the member nations to fight global warming to save the Arctic. But China and India (holders of “permanent observer” status) wont sign it. They cite the need to expand their economies, wanting to approach the economic levels of the developed nations. Nothing new here. Indeed, Obama signed a pact with China to allow China to continue to increase their CO2 emission until 2030. In that same pact, he committed the USA to reducing its emissions by 26%-28% from 2005 levels by 2025. This pact signed last year, received high praise from the fawning mainstream media.


Continue reading