
February’s UAH global temperature anomaly is +0.20C. That is up 0.08Cfrom January’s +0.12C. The Northern Hemisphere temperature increased despite a major drop in the US contiguous 48 temperature of -0.66C. The Southern Hemisphere went up slightly.
The following chart and table detail the global temperature anomaly.
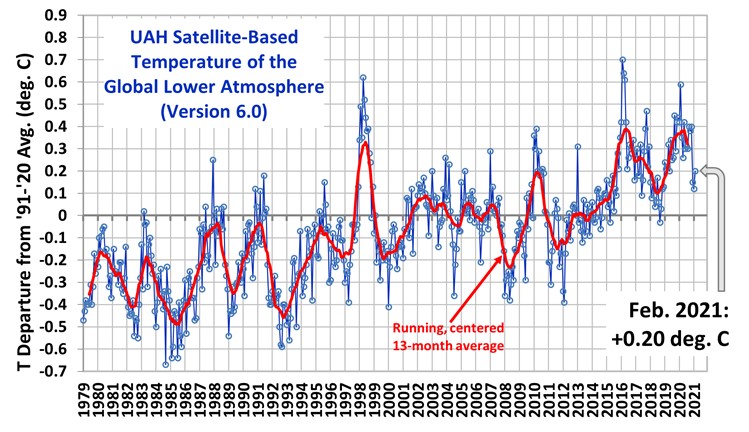
UAH Global Temperature Update for February 2021: +0.20 deg. C « Roy Spencer, PhD (drroyspencer.com).
Various regional LT departures from the 30-year (1991-2020) average for the last 14 months are:
YEAR MO GLOBE NHEM. SHEM. TROPIC USA48 ARCTIC AUST
2020 01 0.42 0.44 0.41 0.52 0.57 -0.22 0.41
2020 02 0.59 0.74 0.45 0.63 0.17 -0.27 0.20
2020 03 0.35 0.42 0.28 0.53 0.81 -0.96 -0.04
2020 04 0.26 0.26 0.25 0.35 -0.70 0.63 0.78
2020 05 0.42 0.43 0.41 0.53 0.07 0.83 -0.20
2020 06 0.30 0.29 0.30 0.31 0.26 0.54 0.97
2020 07 0.31 0.31 0.31 0.28 0.44 0.26 0.26
2020 08 0.30 0.34 0.26 0.45 0.35 0.30 0.25
2020 09 0.40 0.41 0.39 0.29 0.69 0.24 0.64
2020 10 0.38 0.53 0.22 0.24 0.86 0.95 -0.01
2020 11 0.40 0.52 0.27 0.17 1.45 1.09 1.28
2020 12 0.15 0.08 0.22 -0.07 0.29 0.43 0.13
2021 01 0.12 0.34 -0.09 -0.08 0.36 0.49 -0.52
2021 02 0.20 0.32 0.08 -0.14 -0.66 0.07 -0.27
The satellite systems for measuring temperatures were pioneered by Roy Spencer and John Christy. Their University of Alabama at Huntsville (UAH) satellite began making measurements in 1979. The satellite does not measure temperature directly. It uses microwave sensing of oxygen calibrated to temperature. Over time it has been joined by other satellites using similar equipment. The others are RSS, NOAA, and the University of Washington. At one time they tracked one another but then they made a change. In my opinion, because their readings are warmer than UAH, they are now considered the “standard. Historically, UAH reports warming at +0.14C/decade and the others read +0.208C/decade.
“The only direct comparisons to satellite-based deep-layer temperatures are from radiosondes and global reanalysis datasets (which include all meteorological observations in a physically consistent fashion). What we will find is that RSS, NOAA, and UW have remaining errors in their datasets which they refuse to make adjustments for.
From late 1998 through 2004, there were two satellites operating: NOAA-14 with the last of the old MSU series of instruments on it, and NOAA-15 with the first new AMSU instrument on it. In the latter half of this overlap period there was considerable disagreement that developed between the two satellites. Since the older MSU was known to have a substantial measurement dependence on the physical temperature of the instrument (a problem fixed on the AMSU), and the NOAA-14 satellite carrying that MSU had drifted much farther in local observation time than any of the previous satellites, we chose to cut off the NOAA-14 processing when it started disagreeing substantially with AMSU. (Engineer James Shiue at NASA/Goddard once described the new AMSU as the “Cadillac” of well-calibrated microwave temperature sounders).
Despite the most obvious explanation that the NOAA-14 MSU was no longer usable, RSS, NOAA, and UW continue to use all of the NOAA-14 data through its entire lifetime and treat it as just as accurate as NOAA-15 AMSU data. Since NOAA-14 was warming significantly relative to NOAA-15, this puts a stronger warming trend into their satellite datasets, raising the temperature of all subsequent satellites’ measurements after about 2000.
But rather than just asserting the new AMSU should be believed over the old (drifting) MSU, let’s look at some data. Since Scott Denning mentions weather balloon (radiosonde) data, let’s look at our published comparisons between the 4 satellite datasets and radiosondes (as well as global reanalysis datasets) and see who agrees with independent data the best:
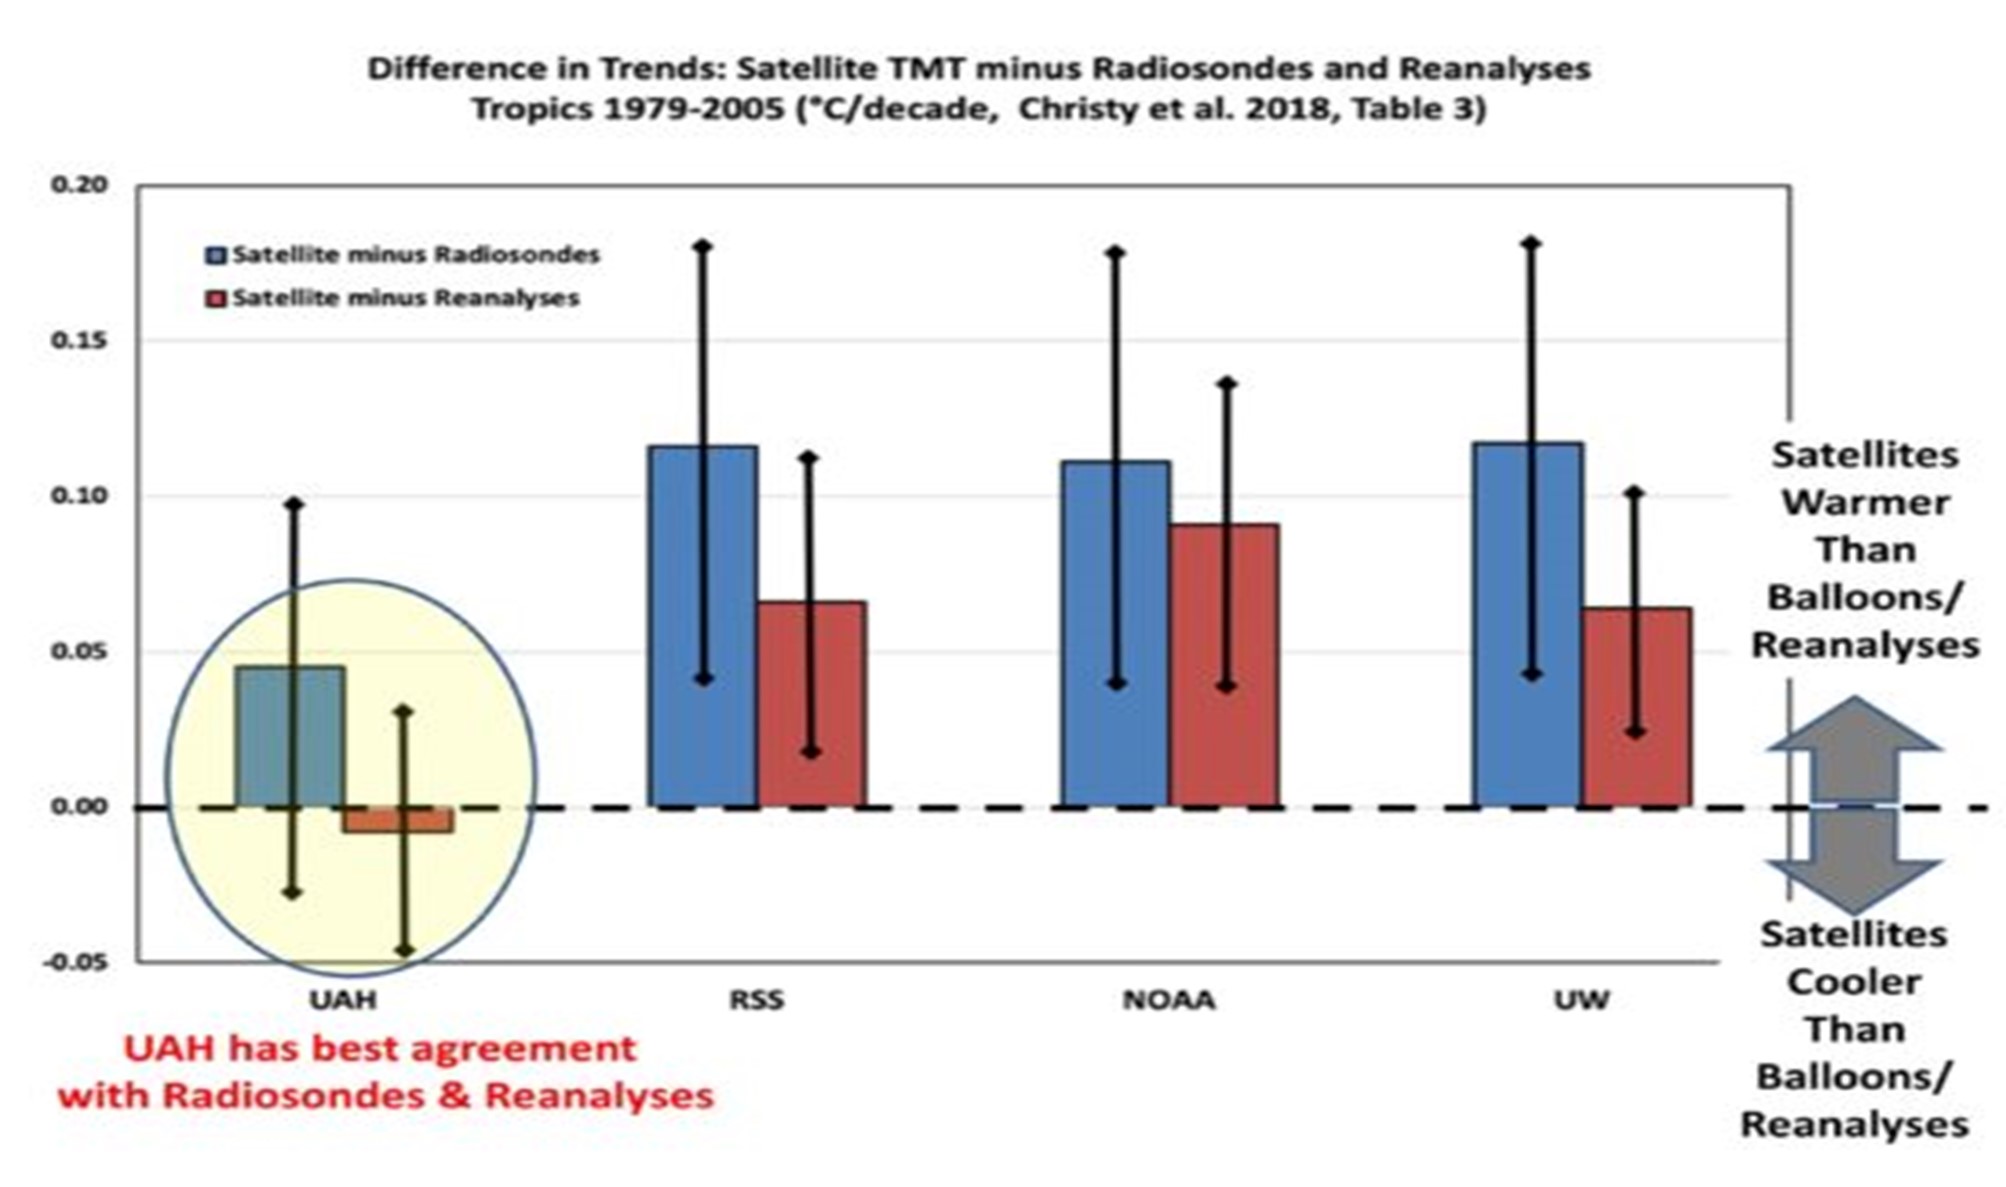
Trend differences 1979-2005 between 4 satellite datasets and either radiosondes (blue) or reanalyses (red) for the MSU2/AMSU5 tropospheric channel in the tropics. The balloon trends are calculated from the subset of gripoints where the radiosonde stations are located, whereas the reanalyses contain complete coverage of the tropics. For direct comparisons of full versus station-only grids see the paper.
Clearly, the RSS, NOAA, and UW satellite datasets are the outliers when it comes to comparisons to radiosondes and reanalyses, having too much warming compared to independent data.
But you might ask, why do those 3 satellite datasets agree so well with each other? Mainly because UW and NOAA have largely followed the RSS lead… using NOAA-14 data even when its calibration was drifting and using similar strategies for diurnal drift adjustments. Thus, NOAA and UW are, to a first approximation, slightly altered versions of the RSS dataset.”
Thank you Roy for the explanation. I will continue to treat the UAH data as the gold standard.
cbdakota
