Category Archives: ENSO

Will there be a solar minimum soon?


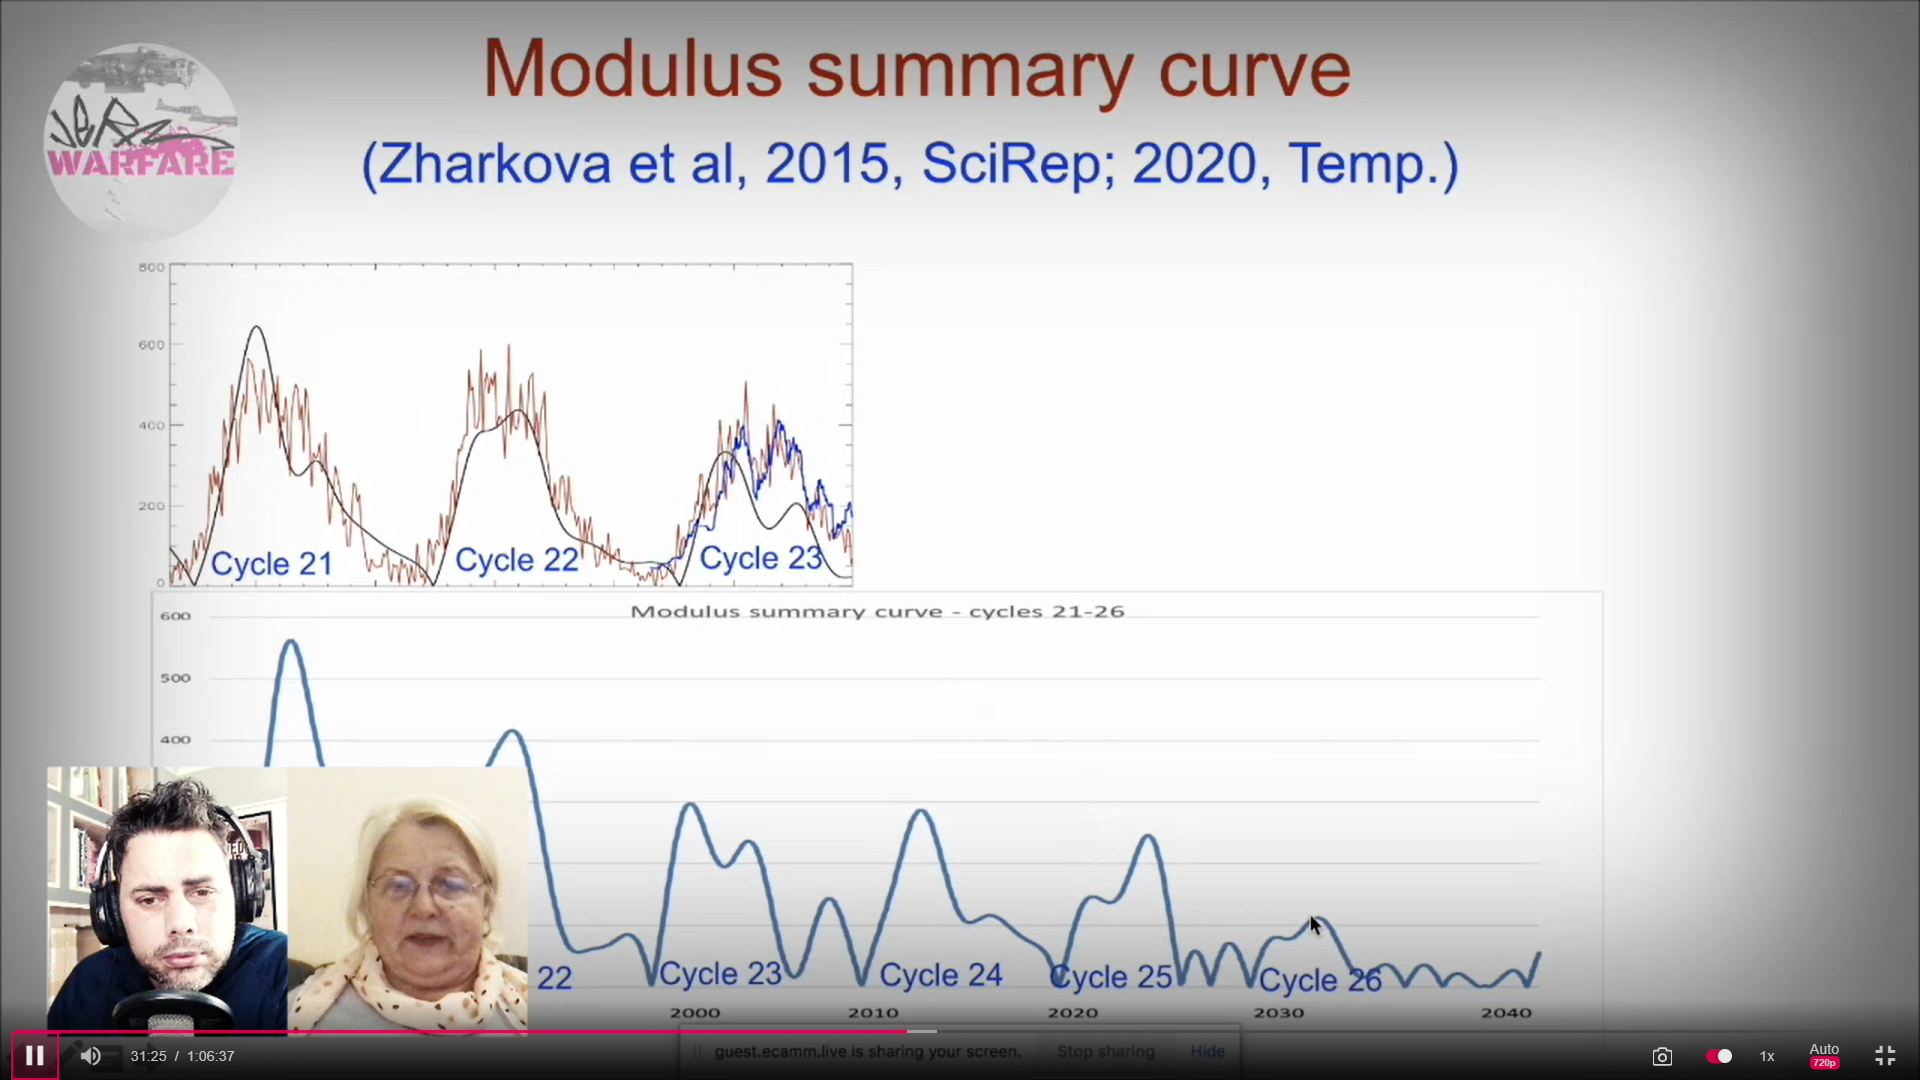
Chart from video of interview of Dr Zharkova Phd ** Click on charts to enlarge

The chart above shows the forecast for Solar Cycles 25, 26 and beyond by Valentina Zharkova.Phd. She believes that she and her team have determined how to forecast solar cycle activity. Solar Cycle 25 is underway and she predicts it will be less active than Solar Cycle 24 and Solar Cycle 26 will be much less active.

Madame Zharkova is much bolder than many other experts with respect to when or if there will be a solar minimum. Before we discuss Madame Zharkova, let’s look into some of the issues that surround the question of an upcoming Solar Minimum.

** The video begins at (2 minutes and 14 seconds.)

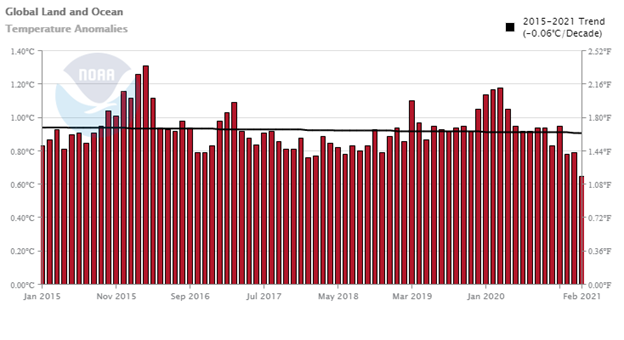
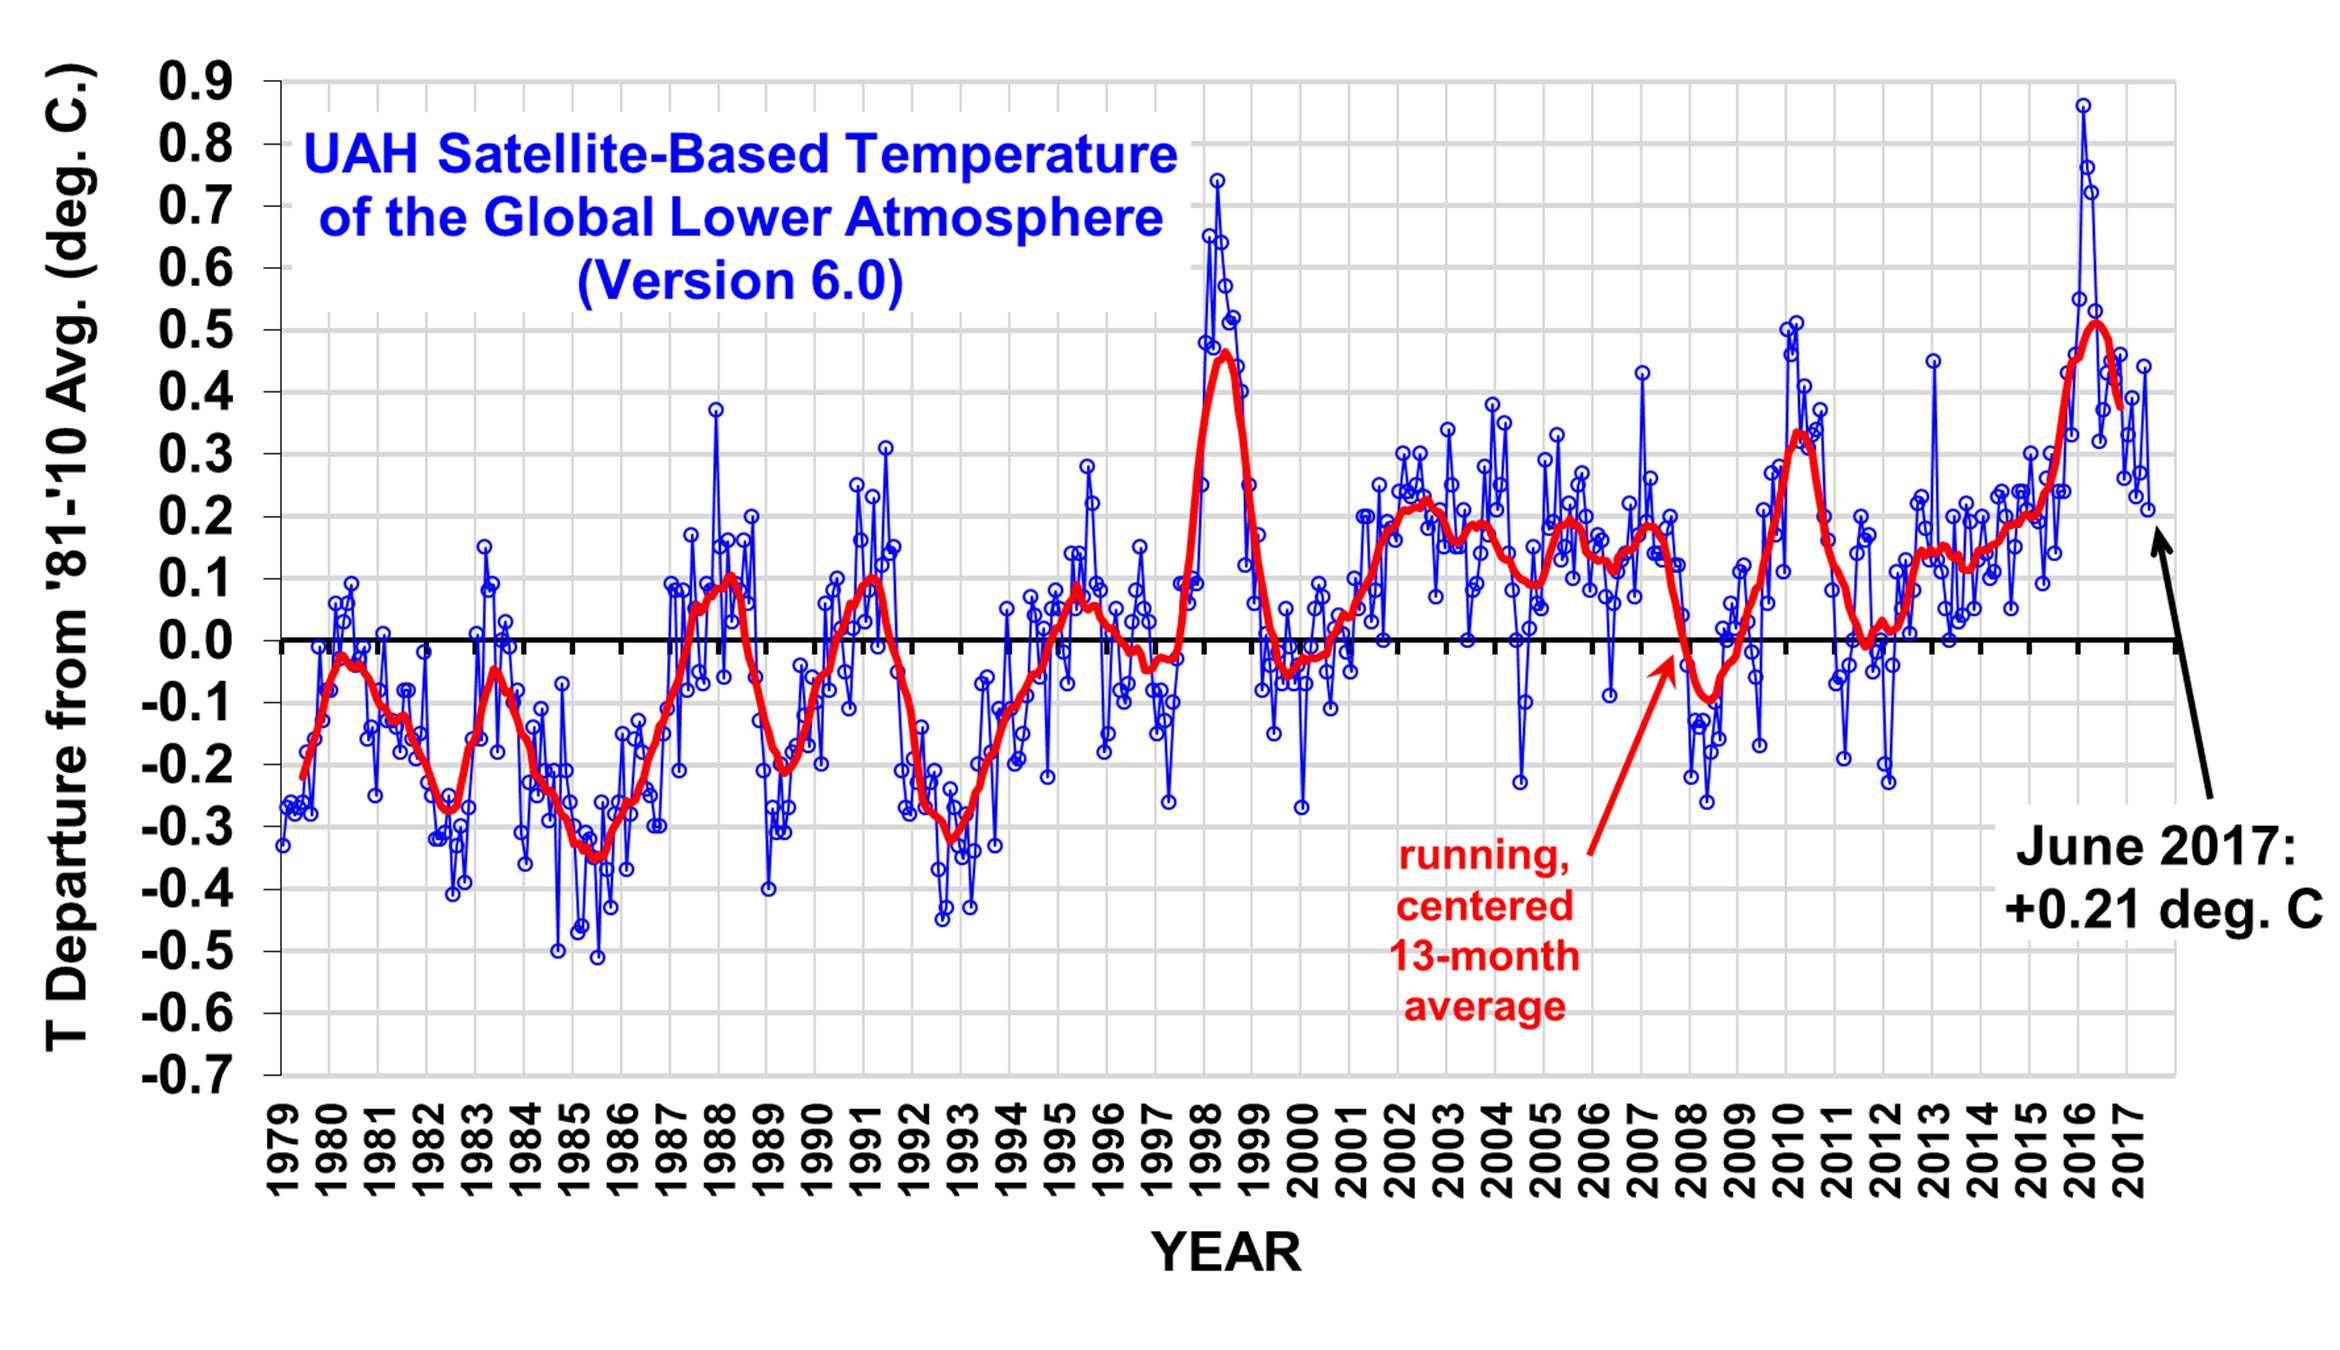
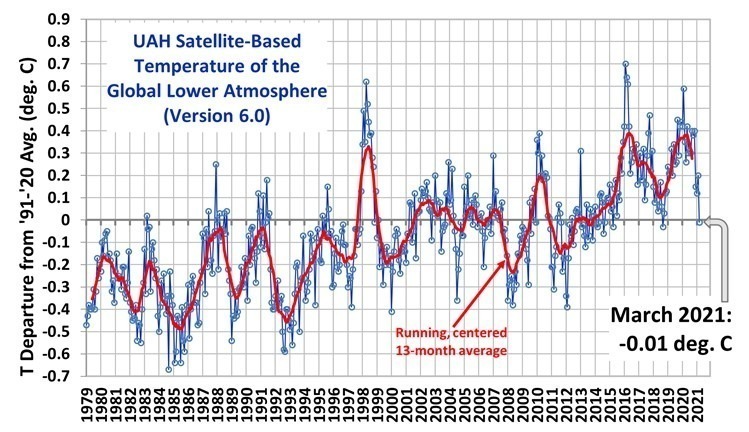
To begin with, look at the December 2022 Global temperature.  It dropped to an anomaly of 0.05C from November 2022’s 0.17C anomaly.  This measurement continues the decline of global temperatures since the last El Nino where the anomaly peaked at about 0.4 C. (Red line)

The chart above is from a Dr Roy Spencer posting.

This has resulted in a number of people saying we are on our way to another “little ice age”.   Let’s look at several predictions of serious global cooling

ENSO is the system name acronym for and the Southern Oscillation. It a major factor affecting global temperature.

The El Nino (ocean warming) and the La Nina (ocean cooling) are considered natural phenomena, meaning that they are not man-made actions.  A simplistic description of this phenomena is that over a period of time sun and or submerged volcanos, warm a body of western Pacific Ocean, lying along the equator and its temperature rises. This causes atmospheric changes and the hot water flows eastward to the coast of South America. This is called El Nino.  After several years the conditions change and the body of water flows westward and cool, deep ocean water along South America coast rises This is the La Nina.. This ebb and flow has a major effect on global weather.

The above chart illustrates the Nino and Nina occurrences from 1990 to the present.  Comparing the temperature chart and the Ninos charts show that when an El Nino occurs the global temperature rises. Conversely global temperature drops when a La Nina occurs. The charts seems to show that El Ninos are stronger that La Ninas.  (It would be interesting if someone had measured the chart area for the two.)

Now eyeballing the charts, it looks like the strong El Ninos, a natural occurrence, are the major mover of the global temperatures. 

Examining the global temperature chart, the period following the 1997 -1998 El Nino, stretching out to about 2015 shows that global temperature is flat, in other words, no significant change in global temperature was recorded. Something like 15/16 years.  This happened even though atmospheric C02 was increasing. Does this relegate CO2 to be only a minor forcing? Does this indicate that the sun (or volcanos) are causing global temperatures to rise?

Viewing Solar Cycles.

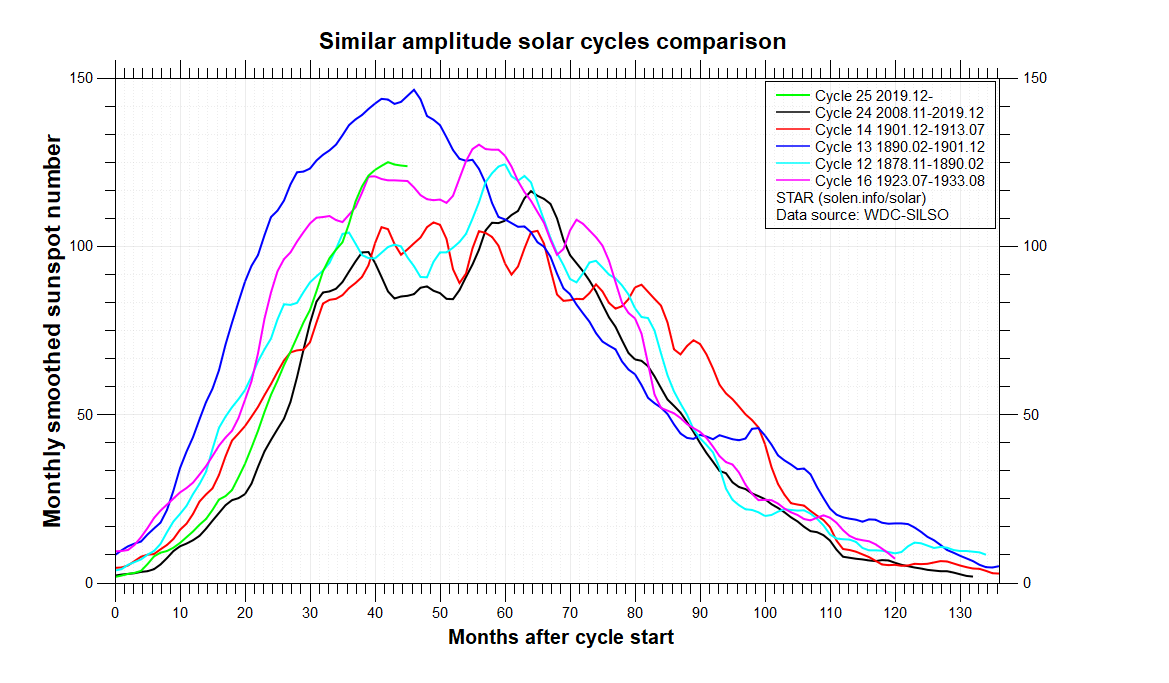
Solar Cycle 24 was much less active than its predecessors. The new Cycle 25 activity is almost identical to Solar Cycle 24 as can be seen in the following chart

The chart above is courtsey of Solan.Info.

Cycle 25 at 30 months after cycle start is the green line and that is where Cycle 24, the black line, was at thirty months. The other Cycles, from other years, that had unusually low activity are shown on this chart. Cycle 24 the black line was less activity than the others.

For contrast, the following chart shows the “Modern Maximum”, group of Cycles, meaning very active. The chart is a little dated as the last rising blue line is Solar Cycle 24.

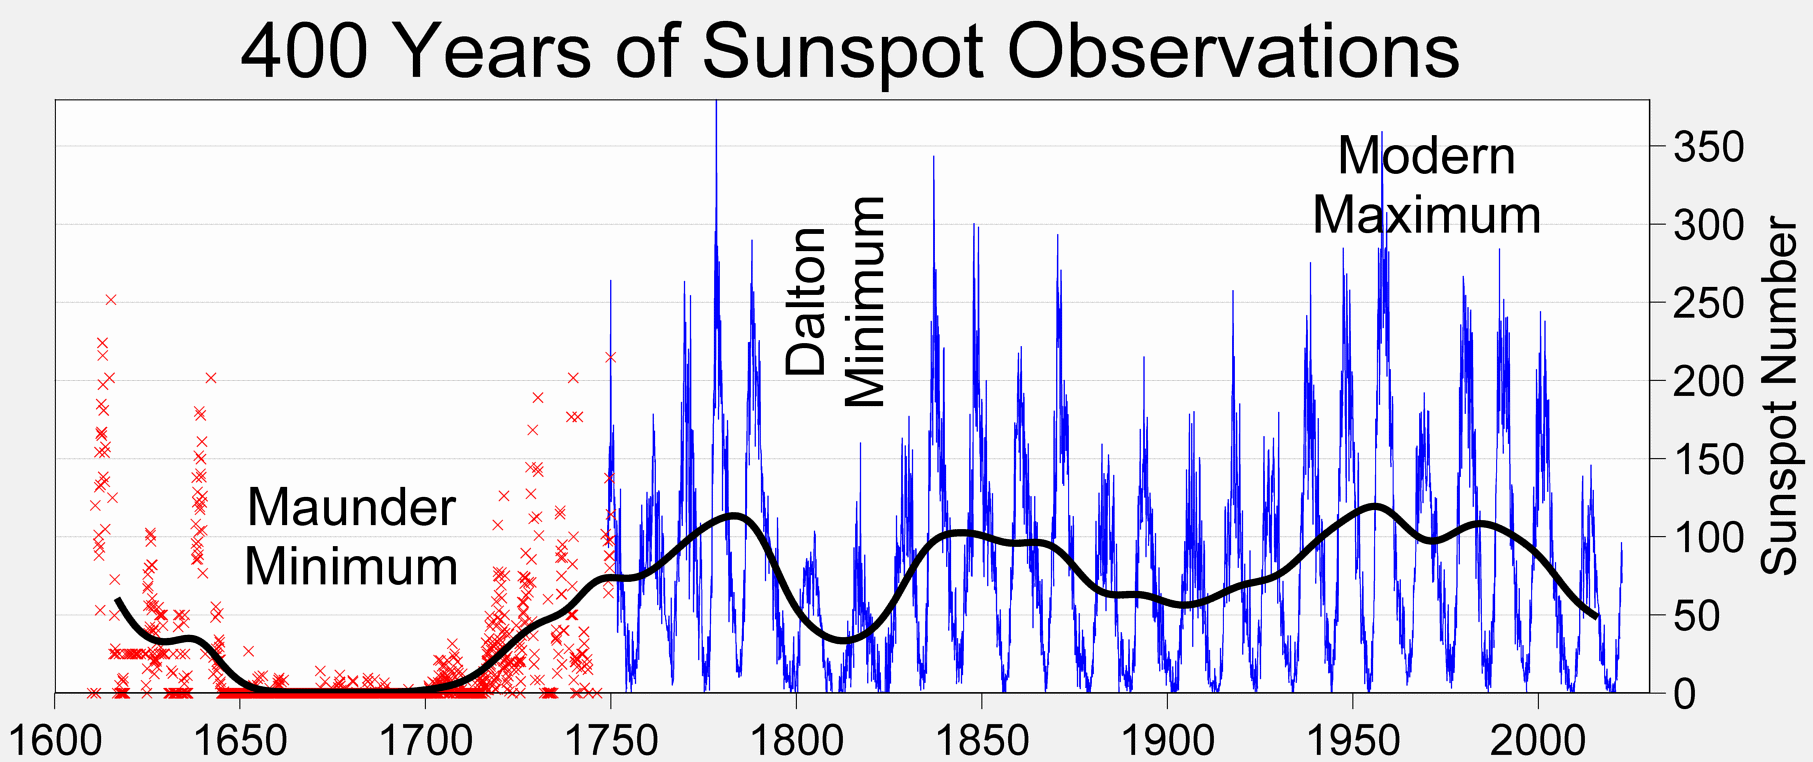
The solar cycles 24 and 25 are substantially less active than their predecessors.  There is really no strong signal yet that the temperature is dropping due to low activity Solar Cycles. Perhaps there is a time delay built into the system.

Cloud Formation due to weak Solar Cycles

This allows us to examine three theories.  First comes the Svensmark theory: From the posting “comes this description of the theory:

“In 1995, Henrik Svensmark discovered a startling connection between the cosmic ray flux from space and cloud cover. He found that when the sun is more active–more sunspots, a stronger magnetic field, larger auroras, stronger solar winds, etc.–fewer cosmic rays strike the earth and cloud cover is reduced, resulting in warmer temperatures.”  When the sun is inactive, more of them penetrate the atmosphere. Upon reaching the lower atmosphere where more sulphur dioxide, water vapor, and ozone is present, the cosmic rays ionize the air, releasing electrons that aid in the formation of more CCN and form more dense clouds. This increase in low-cloud amount reflects more solar energy to space, cooling the planet.”

CERN set up chambers to test this theory. While there was some verification, they said that cosmic rays did form clouds, but the formation was much too small to have any effect.  It appears that there are many that still think Svensmark is correct.  We will have to wait to see future developments.

There are some new theories positing that Ultra Violet (UV) is a player.   

First some UV information from Wiki: “The Sun emits ultraviolet radiation at all wavelengths, including the extreme ultraviolet where it crosses into X-rays at 10 nm. Sunlight in space at the top of Earth’s atmosphere is composed of about 50% infrared light, 40% visible light, and 10% ultraviolet light, for a total intensity of about 1400 W/m2 in vacuum.[22]

The atmosphere blocks about 77% of the Sun’s UV, when the Sun is highest in the sky (at zenith), with absorption increasing at shorter UV wavelengths. At ground level with the sun at zenith, sunlight is 44% visible light, 3% ultraviolet, and the remainder infrared.[23][24] Of the ultraviolet radiation that reaches the Earth’s surface, more than 95% is the longer wavelengths of UVA, with the small remainder UVB. Almost no UVC reaches the Earth’s surface.[25] 

The shorter bands of UVC, as well as even more-energetic UV radiation produced by the Sun, are absorbed by oxygen and generate the ozone in the ozone layer when single oxygen atoms produced by UV photolysis of dioxygen react with more dioxygen. The ozone layer is especially important in blocking most UVB and the remaining part of UVC not already blocked by ordinary oxygen in air.”

Here is one of the UV theories It is called the Winter GateKeeper Hypothesis. I would like to say that I know enough to describe this hypothesis, but I can not. Dr Judith Curry has posted it on her site, which I think is a favorable appraisal of this hypothesis. She has also noted another researcher which seems to have a favorable opinion. So I will give you a summary:

“The Winter Gatekeeper Hypothesis integrates different components of the transport system in the stratosphere, troposphere, and ocean. A schematic of the energy processes involved is presented in Fig. 8.1, with energy transport represented by white arrows. Solar modulation starting in the stratosphere affects all transport, and Vinós (2022) showed a solar effect on ENSO and the polar vortex. The mechanism by which solar activity modulates ENSO activity is still unknown, but this author proposes a solar modulation of the Brewer-Dobson tropical upwelling, known as the “tropical route” of the “top-down mechanism” (Maycock & Misios 2016; Vinós 2022).”

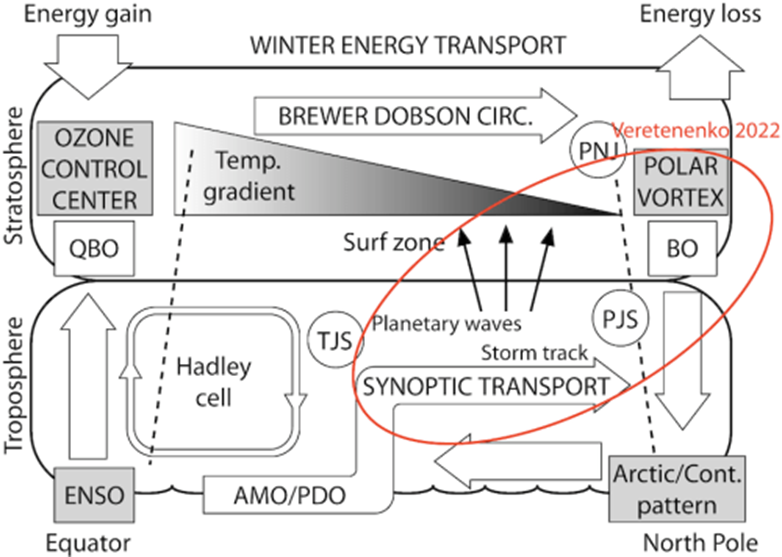
“Fig. 8.1. Northern Hemisphere winter meridional transport outline. The energy gain/loss ratio at the top of the atmosphere determines the maximal energy source in the tropical band and the maximal energy sink in the Arctic in winter. Incoming solar energy is distributed in the stratosphere and troposphere/surface where it is subjected to different transport modulations. Energy (white arrows) ascends from the surface to the stratosphere at the tropical pipe (left dashed line) and is transported towards the polar vortex (right dashed line) by the Brewer–Dobson circulation. Stratospheric transport is determined by UV heating at the tropical ozone layer, which establishes a temperature gradient affecting zonal wind strength through thermal wind balance, and by the quasi-biennial oscillation (QBO). This double control determines the behavior of planetary waves (black arrows) and determines if the polar vortex undergoes a biennial coupling with the QBO (BO). In the tropical ocean mixed-layer, ENSO is the main energy distribution modulator. While the Hadley cell participates in energy transport and responds to its intensity by expanding or contracting, most energy transport in the tropics is done by the ocean. Changes in transport intensity result in the main modes of variability, the AMO, and PDO. Outside the tropics, most of the energy is transferred to the troposphere, where synoptic transport by eddies along storm tracks is responsible for the bulk of the transport to high latitudes. The strength of the polar vortex determines the high latitudes winter climate regime. A weak vortex promotes a warm Arctic/ cold continents winter regime, where more energy enters the Arctic exchanged by cold air masses moving out. Jet streams (PJS, polar; TJS, tropical; PNJ, polar night) constitute the boundaries and limit transport. Red oval, the part of the Winter Gatekeeper Hypothesis studied in Veretenenko 2022. Figure from Vinós 2022”

Finally, a few notes about the Zharkova theory.

From the posting in Principia Scientific titled “The Woman Who Could Cancel Net Zero”comes another theory.   The woman in this case is  Professor Valentina Zharkova of the University of Northumbria. The professor’s fields are applied mathematics, plasma physics, pattern recognition, solar-terrestrial physics and solar activity. She forecasts that “in the next 30yrs, global warming problem will be last thing in our mind. Then the solar cycles return to being active.

With her team, she has studied the Sun’s many magnetic fields.   She says that sunspots are not a strong enough signal to base any predictions on.  So the team separated the magnetic fields in separate components with a principal component analysis using Eigen vectors and Eigen values. She used the output to create a method to predict solar cycle activity. She maintains that she demonstrated that the teams work can closely match the past solar cycles and they can use it to project the future solar cycle activity.

It would be enormous step in understanding the Sun if Dr Zharkova’s system proves out. It might well be a big hit on the man-made global warming theory, too.

cbdakota

November Global Temperature


The November global temperature as reported by the University of Alabama Huntsville (UAH) ***came in at an anomaly of +0.17C. The black dot on the chart is shown to be + 0.17C above the arbitrary fixed line.  Recent monthly global temperature readings were

July  +0.36 ;  Aug.  +0.28;    Sept.  +0.24 ;   Oct.  +0.32 ;

The measurements are the up and down lines, and the fixed line nominally has half of the temperature measurements above and half below the line.  The two peaks, about 2017 and 2020 are the effect of El Ninos, naturally occurring phenomena. Not man-made.

Temperature has been declining since those two El Ninos.   The opposite effect is a La Nina that usually occurs following an El Nino.  Currently the global weather is experiencing a La Nina. La NInas typically result in drought conditions in the southwestern part of the US, for example.  

Chart is courtesy of Dr. Roy Spencer.

While the chart is up there, following the very large El Nino that occurred in 1998/1999, the average temperature from then until about 2014/2015, did not rise. This 15/16-year period experienced continual rising of CO2 in the atmosphere.  So, you can draw several conclusions as to why did it not rise?  One is that there are natural forcing agents that were cooling the atmosphere. Two, is that maybe CO2 is not really what is theorized to be. 

Detailed look at regions like North America, Southern Hemisphere, the Arctic, etc.by clicking here  DrRoySpencer.PhD

***There are a number of organizations that chart global temperature.  The best source is the UAH satellite data.  It is the first that used satellites when it began in 1978/1979 and has continued to date.  The satellite system measures the ocean temperature as well as the ground temperature. Others source temperature data from stations located around the globe.  But these stations are concentrated in places that are inhabited and for the rest of the globe, they make estimations. 

Confirming the accuracy of the UAH temperature measurements is that they match closely to the primarily land-based radiosonde (weather balloons) temperature measurements.  The real temperature of the globe is contested.  But the change in temperature from month to month is generally agreed to.  You may have wondered why the Alarmist always speak about an anomaly increase in temperature of 1.5C., and not a specific temperature.  

cbdakota

Tidal Pumping Drives Weather and Climate, including “Extreme Weather”


(Revised Nov 13, 2022)

The following is a guest posting by Richard Cronin. He provides a well-documented discussion of how Tidal Pumping drives weather and Climate.

By Richard Cronin

There is no “climate crisis”. The internal heat of the Earth delivered to the ocean floor is grossly misunderstood.

 An entirely unappreciated energy input onto the surface of our planet is Tidal Pumping. Not pumping water. Shifting our tectonic plates due to the Earth’s gyrations (Precession, Obliquity, Perihelion, and Orbital Eccentricity) in addition to our varying distance from the planetary gravity fields everywhere from the Sun out to Jupiter.

Milankovitch cycles have nothing to do with solar radiation. They have everything to do with tidal pumping. This information has been coming forward over the last decade by geologists, geophysicists, and astrophysicists.  Unfortunately, these disciplines have been overlooked in the discussion about climate.

Tidal pumping by the Sun, Precession of the Equinoxes, Obliquity, Perihelion, Orbital Eccentricity, as well as planetary alignments (particularly Sun, Venus, & Jupiter) move Earth’s tectonic plates.  Therefore, all of Earth’s internal heat is delivered to the surface, notably into the waters at the two (2) terminal points of the Pacific’s Ring of Fire. The seismic heat injection is Enormous. Per NASA, this energy input is approx. 99.5 % of all solar radiation but the flawed paradigm is that the internal heat of the Earth is dissipated in Mantle Convection. Mantle Convection and Subduction do not exist.

Per NASA’s very calculations: “The interior of the earth contributes more than 99.5 percent of the total heating of the surface compared with the sun!

This answer, of course is quite wrong because it assumes that 100% of the internal energy is radiated to the surface. In fact, the internal heat source drives powerful convective currents in the mantle so that nearly all of this thermal energy is lost.”

https://image.gsfc.nasa.gov/poetry/ask/a11779.html

The energy statement is true, but the dissipation of the internal heat into Mantle Convection is wrong. There is no Mantle Convection. The internal heat is delivered to the surface, specifically the ocean floor of our planet and greatly exceeds any causation from minuscule trace gases in our atmosphere.

At the Winter Solstice, the incrementally closer distance between the Sun and Southern Hemisphere induces greater plate movement across the Southern Hemisphere and greater seismicity in the Peru-Chile Trench to drive the El Niño. Alternately, these tidal stresses can find relief and induce greater seismicity in the Tonga-Kermadec Trenches to drive the La Niña. Elevated surface water temperatures near Papua-New Guinea are due to a heat plume emitted from the Tonga Trench, but the heating of these surface waters is also affected by the multi-plate, seismically active regions to the east of Papua-New Guinea, including the New Hebrides and New Britain Trenches. Ergo, sea surface temperatures are highest in these regions east of Papua New Guinea.

Current sea surface temperatures showing cooler waters in the central Pacific and elevated temperatures east of Papua New Guinea. Entirely typical of a strong La Niña:

In “Plate Climatology”, James Edward Kamis describes a single “Source Point” for the La Niña and El Niño as centered on the multi-plate, seismically active regions to the east of Papua-New Guinea. It seems doubtful to me that this region could drive the El Niño off the coast of Peru. I hold that the ENSO is a binodal condition, at either end of the Ring of Fire.

Via bathyscaphic ocean floor mapping, Hillier and Watt (2007) provided an estimate of 1.0 to 3.5 million oceanic seamounts which by definition are formed by submarine volcanoes. This estimate excludes estimates above latitudes 60 degrees North and South. See “Global distribution of seamounts from ship-track bathymetry data” in references.

The Dust Bowl years of the 1930s were caused by a strong, sustained La Niña. Drought across the plains states in summer months , punctuated by springtime flooding conditions further north.

The La Niña brings flooding monsoons across Bangladesh, while the Northern Hemisphere suffers extreme drought in the summer months. Extreme low water conditions across rivers of America’s interior as well as Europe. Yet earlier this spring the Yellowstone River flooded over its banks.

The geochemical reactions throughout the Upper and Lower Mantle are all exothermic (give off heat). Activation Energy is supplied by planetary Decompression. Fischer-Tropsch and Sabatier reactions produce methane and petroleum in unimaginable quantities. (See link). Most is diffused from the ocean floor. Land-based sources are minuscule. 

Hydrothermal vents and plain old ocean floor seepage is immeasurable and these acidic discharges react with alkaline ocean waters to release the Heat of Neutralization and the Heat of Dilution.

We have been under pronounced La Niña conditions since autumn of 2020. Last year we went thru the alphabet in hurricane names. Entirely typical of La Niña.

An estimated 50 million tons of water vapor spewed from the Tonga Trench volcano on Jan. 15, 2022. This largest submarine volcano ever observed will produce a warm, wet planet for years. A Richter 7.3 submarine earthquake struck off Tonga on Nov. 11, 2022. 

Areas of drought are also caused by an increase in katabatic winds. Moisture condenses on the southern face of the Himalayas, producing monsoons and floods across northern India and Bangladesh. Dry, hot winds flowing down from the Himalayas cause continuous dry conditions for Central Asia.

Significant tidal pumping stresses coincided with the Precession of the planet on Dec. 21, 2021 to tear open the Tonga Trench. Another stress-inducing event is the Perhelion, the closest approach between Earth and Sun, associated with the Earth’s elliptical orbit. The Perihelion occurs two (2) weeks after the Solstices. On April 30, 2022, there was a planetary alignment of Venus-Earth-Mars-Jupiter. On Sept. 26, Jupiter made its closest approach to Earth in 59 years. Tremendous tidal pumping stresses. Tremendous seismic energy release. Totally ignored.

References listed by date. Most of this information was issued in the last half decade. Copy and paste the titles into any web browser.

“Institute for Celestial Geodynamics” ( D. Zbikowski, et al )

“Continental Drift Theory – Unresolved Issues “

“Plate Climatology” by James Edward Kamis. Book published 2019.

“Topological inconsistency of continental drift on the present-sized Earth”

R Meservey. Science. 1969.

“Problem of Convection in the Earth’s Mantle”

E. N. Lyustikh, published in Geophysical Research Letters: 01 January 1969

“Pump-like Tidal Driving of Tectonic Plates – Plates 1” George W. Moore, AAPG Bulletin, GeoScience World, June 1, 1975

“The earth tides”

Judah Levine, December 1982 (NIST)

“Earth tides and the degassing of the Earth”

Khitarov, N. I. ; Voitov, G. I. , March 1982 (NIST)

“Global distribution of seamounts from ship-track bathymetry data”

J.K. Hillier, A.B. Watts, Geophysical Research Letters, July, 2007

—> By definition seamounts are formed by volcanic activity. Hillier and Watt estimate 1 to 3.5 million seamounts and this excludes allowance for regions higher than Latitude 60 degrees. Conservatively, active submarine volcanoes are in the tens of thousands.

“Can Earth’s rotation and tidal despinning drive plate tectonics?”

F. Riguzzi, et al, 2009

“Researchers discover new force driving Earth’s tectonic plates”

Cande & Stegman, Univ. of S. California, July 7, 2011

“On Ohmic heating in the Earth’s core II: Poloidal magnetic fields obeying Taylor’s constraint”.    Jackson, Livermore & Ierley, Aug., 2011

“Earth Expansion Evidence: a Challenge for Geology, Geophysics and Astronomy”

G. Scalera, S. Cwojdzinski, National Institute of Geophysics & Vulcanology (Italy), 4-Oct-2011 

“Spin-driven tidal pumping: Tidally driven changes in planetary spin coupled with secular interactions between planets.” R. Greenburg et al, Feb. 2013

“Tidal strain and tidal stress in the Earth’s interior” W. Kia, et al, Chinese Journal of Geophysics, November, 2013

“Tidal Stresses – How Gravity Heats Things Up”, Tim James, Dec. 2, 2013 ( author of ‘Astronomical: From Quarks to Quasars, the Science of Space at its Strangest’)

“Secular Increase in the Earth’s LOD (Length of Day) Strongly Implies that the Earth Might Be Expanding Radially on a Global Scale”   G.G. Nyambuya ,

4-March-2014

“Asian monsoons in a late Eocene greenhouse world”

A. Licht, G. Dupont-Nivet, et al, Nature, 4-August 2014

—> “But monsoons are still poorly understood, and today’s climate models disagree about how increased carbon dioxide (CO2) in the atmosphere will alter them.”

—> “Asian monsoon began ….. recently several independent teams to around 40 million years ago.” (same duration as Central Asian drought)

“Jupiter’s effect on Earth’s climate”

O. G. Sorokhtin, et al Nov., 2014

“Stanford geologists refute coal development theory” Boyce, Nelson at Stanford 2-Feb. 2016

—> Coal, oil, and gas are NOT produced from squished trees. Fischer-Tropsch (F/T) and Sabatier reactions produce oil and gas on all planets. The only true “fossil fuel” is lignite (brown coal, soft coal, thermal coal) derived from peat bogs of the Tertiary Period. It has only 25 to 35% Carbon value. 

—> Heavy crudes, petroleum tars, sub-bituminous coal, bituminous coal vent off volatiles to yield Anthracite (black coal, hard coal) which is 95% Carbon. These carbonaceous fuels all derive from F/T and Sabatier reactions. 

“One Paradox of Plate Tectonics”

Laszlo Attila Horvath, July-2016

“Resilience of the Asian atmospheric circulation shown by Paleocene dust provenance”

A. Light, G. DuPont-Nivet et al 

Nature Communications 4-August-2016

—> “Our results show that dust sources and near-surface atmospheric circulation have changed little since at least 42 Myr.” (same duration as India-Bangladesh monsoons)

—> “Neither Tibetan uplift nor the decrease in atmospheric carbon dioxide concentration since the Eocene seem to have changed the atmospheric pattern in central Asia,” Licht said. “Wind patterns are influenced by CHANGES IN THE EARTH’S ORBIT over tens or hundreds of thousands of years, but over millions of years these wind patterns are very resilient.”

“Pervasive upper mantle melting beneath the western US” 

S. Hier-Majumber, B. Tauzin, et al  Earth and Planetary Science Letters. April-2017

—> Just above Transition Region there are Carbonate melts, source of CO and CO2 by acidic attack from sulfur compounds (SO2, etc) produced in the Lower Mantle. CO and CO2 are reagents for Fischer-Tropsch and Sabatier reactions to produce methane and water. Just in the Western U.S. ALONE, centered on Yellowstone, this carbonate melt zone measures approx. 1.8 million sq. km with a thickness ranging from 25 to 70 km. Decomposing just 1 % of this Yellowstone carbonate layer would be equivalent to burning 2.3 trillion barrels of oil.

“The Very Deep Origin of the World’s Biggest Diamonds”

Gemological Institute of America, Winter 2017

—> “Culligan-like diamonds contain …. iron-rich metallic inclusions surrounded by a fluid jacket composed of methane and hydrogen.” This is a Fischer-Tropsch reaction. Iron is the catalyst.

—> Fischer-Tropsch reactions proceed as follows: CO + 3H2, under Reducing Conditions (O2 deficient) and in the presence of an Iron or Cobalt catalyst and starting at 350C, yields methane and water. Further dwell time in a geological “trap” will produce petroleum — in unimaginable quantities. Sabatier reactions perform in much the same way with with CO2 instead of CO catalysts of Vanadium and Silica. CO2 methanation.

“Spectral, spatial-statistical, and graphical evidence that gravitational interaction with the Moon assists in driving Earth’s tectonic plates Part 1”D.Zbikowski, Institute for Celestial Geodynamics,  January 2018

“A global forecast for great earthquakes and large volcanic eruptions in the next decade” D. Zbikowski, Institute for Celestial Geodynamics, Sept. 2018

—> “Movement of Earth’s rotational axis with respect to the globe generates motion of the north and south rotational poles upon the surface. Motion of the north rotational pole with respect to the net surface consists of roughly circular wobbles with a quasi-annual period. The wobbles of polar motion are formed primarily from two components-the free Chandler wobble (433 days) and the forced annual wobble (seasonal, 365 days).”

“Empirical evidence for stability of the 405 kiloyear Jupiter-Venus eccentricity cycle over hundred of millions of years.

D.V. Kent, P.E. Olsen, C. Rasmussen, et al, Rutgers University , May 7, 2018

—> “Every 405,000 years, gravitational tugs from Jupiter and Venus slightly elongate Earth’s orbit, an amazingly consistent pattern that has influenced our planet’s climate for at least 215 million years and allows scientists to more precisely date geological events like the spread of dinosaurs, according to a Rutgers-led study.”

“The Ability of Significant Tidal Stress to Initiate Plate Tectonics” by Zanazzi & Triaud, Jan. 2019

“Seismic monitoring reveals tidal stresses in the Earth’s crust”,   C. Sens-Schönfelder, et al, Physics World, 15-April-2019

“The phenomenon of subduction is incompatible with Earth’s surface geometry and geomorphology” Lazlo Attila Horvath, July 2019

“Milankovitch (Orbital) Cycles and Their Role in Earth’s Climate”

Alan Buis, NASA Jet Propulsion Laboratory, February 27, 2020

“Tidal modulation of plate motions”

D. Zaccagnino, C. Doglioni, Earth-Science Reviews, June 2020

—> “While mantle convection is fundamental ingredient of geodynamics the driving mechanism of plate tectonics remains elusive. ….. GPS measurements are now accurate enough that, on long baselines, both secular plate motions and periodic tidal displacements are visible.”

—> “Tidal oscillations also correlate with the seismic release.”

“Solar system planetary alignment triggers tides and earthquakes”

S. Awadh, 2021

“Beyond Plate Tectonics”by James Maxlow. Book published 1-Dec.-2021

“Links of planetary energetics to moon size, orbit, and planet spin: A new mechanism for plate tectonics”

A. Hofmeister, Univ. of Washington (St. Louis), January 2022

—> “Tug of sun, moon could be driving plate motions on ‘imbalanced’ Earth”

“The hot zones of global Mw ≥ 5 earthquakes and their decadal migration during 1989–2019”

Jin Chen & Hong Tang, Journal of Geosciences, March 2022

“Precession helped drive glacial cycles in the Pleistocene.”

S. Barker, A. Starr,  Geophysical Research Letters. 26-May-2022

GLOBAL-SCALE TIDAL FORCING AND PLATE TECTONICS HAVE BOTH SHAPED THE TECTONIC EVOLUTION OF EUROPA. C. E. Detelich, et al, 53rd Lunar and Planetary Science Conference (2022)

Richard F. Cronin – BChE, MBA, P.E. (retired)

Global Temperature Anomalies Warm 0.13C in May 2021


The UAH satellite temperatures for May warmed by 0.13C, making the anomaly +0.08C.  I can hear the voice of a friend of mine saying “the change is way beyond the limits of meaningful measurement.”  Ok, but the cumulative measurements have meaning in that they do mimic warming or cooling  trends.  So, I will continue to report these anomalies.  

YEAR MO GLOBE NHEM. SHEM. TROPIC USA48 ARCTIC AUST
2020 01  0.42  0.44  0.41  0.52  0.57 -0.22  0.41
2020 02  0.59  0.74  0.45  0.63  0.17 -0.27  0.20
2020 03  0.35  0.42  0.28  0.53  0.81 -0.96 -0.04
2020 04  0.26  0.26  0.25  0.35 -0.70  0.63  0.78
2020 05  0.42  0.43  0.41  0.53  0.07   0.83 -0.20
2020 06  0.30  0.29  0.30  0.31  0.26  0.54  0.97
2020 07  0.31  0.31  0.31  0.28  0.44  0.27  0.26
2020 08  0.30  0.34  0.26  0.29  0.69  0.24  0.64
2020 10  0.38  0.53  0.22  0.24  0.86  0.95 -0.01
2020 11  0.40  0.52  0.27  0.17  1.45  1.09  1.28
2020 12  0.15  0.08  0.22 -0.07  0.29  0.44  0.13
2021 01  0.12  0.34 -0.09 -0.08  0.36  0.49 -0.52
2021 02  0.20  0.31  0.08 -0.14 -0.66  0.07 -0.27
2021 03 -0.01  0.12 -0.14 -0.29  0.59 -0.78 -0.79
2021 04 -0.05  0.05 -0.15 -0.28 -0.02  0.02  0.29
2021 05  0.08  0.14  0.03  0.06 -0.41 -0.04  0.02

The La Nina looks to have ended.  I see that some experts are saying it may return in about 6 months. 

cbdakota

Secrets That Global Warming Alarmists Don’t Want You To Know- Part 2 -Current Temperatures Are Not Alarming


Recent global temperatures are said to be all time records.  Without any doubt, they say, a degree more will cause severe damage and perhaps be existential.  That is just another salvo of “we are all going to die” misinformation.   Unfortunately there seems to be no member of the media willing to publish a list of the many times we have been told we only have X number of years left before it is too late. The media people are too lazy to do so, or they are politically motivated to keep the scam alive.  Part 1 Secrets that Global Warming Alarmist Don’t Want You To Know Shows the inaccuracy of the Climate models.

Are global temperatures rising?

Not significantly.  And recently they are falling.

Look at the new satellite temperature measurement chart and notice that the March 2021 anomaly is similar to those in 2014-2015 time frame.  March anomaly dropped 0.2C.   And this is after two El Ninos that really boosted the temperature anomalies.  Will April and following months continue a cooling phase?  We can’t be sure, but odds are that it will.  Latest Global Temps « Roy Spencer, PhD (drroyspencer.com)

These satellite measurements are not an outliner.  And they are consistent with weather balloon temperature readings.  Chart Courtsey of Dr.Roy Spencer

The National Oceanic and Atmospheric Administration (NOAA) is a scientific agency within the United States Department of Commerce that focuses on the conditions of the oceans, major waterways, and the atmosphere.

The following NOAA chart shows that the combined global land and ocean temperature has not been rising for the last 5 years, in fact it shows a slight decline.  During this period, atmospheric CO2 has been rising.   They confirm the cooling trend.

Then there is the global warming hiatus.   From 1998 until 2013 there was almost no increase in global temperatures. 

See the NOAA chart below

This caused a lot of agony among the alarmists. Fifteen years, rising atmospheric CO2, four El Ninos with hardly any rise in temperature. The 4 El Ninos raised the temperature and then fell when a La Nina occurred.   NOAA charts from  Climate at a Glance | National Centers for Environmental Information (NCEI) (noaa.gov)

According to Wikipedia:

“It is believed that El Niño has occurred for thousands of years”  and  “There is no consensus whether climate change will have any influence on the occurrence, strength or duration of El Niño events, as research supports El Niño events becoming stronger, longer, shorter and weaker.” 

So, the observed rise in global temperature following an El Nino-La Nina is as likely to be caused by natural causes as by man-made causes. And the trend in the period of the hiatus was only +0.09/Decade.  At that rate, after 100 years, the global temperature rise would be less than 1C— hardly worth all the alarm.

Even at the +0.14c /decade rise of the satellite observed temperatures since 1979, it would take 70 years to raise it 1C.

The warmest ever and the most CO2 ever are claimed, seemingly, monthly by the alarmists.  You are to believe that the current period is the” perfect” climate and any change is perilous.

The alarmists want all the scientific work establishing previous climate condition shoved down the memory hole, never to be seen again.   The globe has seen higher CO2 concentrations in the atmosphere and higher temperatures than those being experienced today.  The chart below illustrates this.

Berner RA, Kothavala Z (2001)GEOCARBlll: CO2 over Phanerozoic time.

And we know that the globe has also been much colder.

So now you know that the global temperature is not rising, in fact for the last 5 years the temperature has been falling.  Further, you know that the Alarmists forecasts of rapidly increasing global warming are not happening.   Their computer programs are biased to predict increasingly warming temperatures in order to scare people into going along with their bogus science.  It is also clear that the rise in global temperatures might be just natural changes.  Do not discount natural changes.  What do you think began melting the glaciers that covered much of North America some 12 to 15 thousand years ago?  It was not CO2 from SUV exhaust pipes.   

I am going to use Dr. Roy Spencer’s comment in one of his recent blogs.  It goes like this:

Seldom is the public ever informed of these glaring discrepancies between basic science and what politicians and pop-scientists tell us.

Why does it matter?

It matters because there is no Climate Crisis. There is no Climate Emergency.

Yes, irregular warming is occurring. Yes, it is at least partly due to human greenhouse gas emissions. But seldom are the benefits of a somewhat warmer climate system mentioned, or the benefits of more CO2 in the atmosphere (which is required for life on Earth to exist).

But if we waste trillions of dollars (that’s just here in the U.S. — meanwhile, China will always do what is in the best interests of China) then that is trillions of dollars not available for the real necessities of life.

Prosperity will suffer, and for no good reason.

Go have your kids read this.

cbdakota

Global temperature anomaly drops 0.21 C in March.


The UAH satellite measurements of the lower troposphere temperature dropped 0.21C in March.  Dr Spencer believes that the recent la Nina is being felt globally.

The following is from Roy Spencer, PhD (drroyspencer.com):

Right on time, the maximum impact from the current La Nina is finally being felt on global tropospheric temperatures. The global average oceanic tropospheric temperature anomaly is -0.07 deg. C, the lowest since November 2013. The tropical (20N-20S) departure from average (-0.29 deg. C) is the coolest since June of 2012. Australia is the coolest (-0.79 deg. C) since August 2014.

The linear warming trend since January, 1979 remains at +0.14 C/decade (+0.12 C/decade over the global-averaged oceans, and +0.18 C/decade over global-averaged land).

YEAR MO GLOBE NHEM. SHEM. TROPIC USA48 ARCTIC AUST
2020 01  0.42  0.44  0.41  0.52  0.57 -0.22  0.41
2020 02  0.59  0.74  0.45  0.63  0.17 -0.27  0.20
2020 03  0.35  0.42  0.28  0.53  0.81 -0.96 -0.04
2020 04  0.26  0.26  0.25  0.35 -0.70  0.63  0.78
2020 05  0.42  0.43  0.41  0.53  0.07  0.83 -0.20
2020 06  0.30  0.29  0.30  0.31  0.26  0.54  0.97
2020 07  0.31  0.31  0.31  0.28  0.44  0.26  0.26
2020 08  0.30  0.34  0.26  0.45  0.35  0.30  0.25
2020 09  0.40  0.41  0.39  0.29  0.69  0.24  0.64
2020 10  0.38  0.53  0.22  0.24  0.86  0.95 -0.01
2020 11  0.40  0.52  0.27  0.17  1.45  1.09  1.28
2020 12  0.15  0.08  0.22 -0.07  0.29  0.43  0.13
2021 01  0.12  0.34 -0.09 -0.08  0.36  0.49 -0.52
2021 02  0.20  0.32  0.08 -0.14 -0.66  0.07 -0.27
2021 03 -0.01  0.12 -0.14 -0.29  0.59 -0.79 -0.79

cbdakota

Natural Causes for The Declining Global Temperature Part 1.


The global temperature anomaly, as read by the UAH satellite system, dropped in January about 0.03 C to + 0.12C.  This follows a drop of 0.25C to +0.15C in December of last year.  Since the last El Nino, when the anomaly peaked out at +0.50C in February 2020, the anomaly has dropped by 0.38C.

NOTE: We have changed the 30-year averaging period from which we compute anomalies to 1991-2020, from the old period 1981-2010. This change does not affect the temperature trends.

Dr Spencer’s note above, alerts the reader that the anomaly chart was change beginning in January 2021. I believe the scientific organization are all remaking their charts to comply with the new averaging period.   I suspect that it is to make more room above the averaging period.  

Why is the global temperature falling? Has something happened to the Green House gases?  Let us take a quick tour of the natural forces and see what part they are playing.

El Nino-Southern Oscillation

Currently the La Nina is dominating the Tropical Pacific Ocean.  NOAA published an advisory saying:

La Niña—the cool phase of the El Niño-Southern Oscillation climate pattern—was firmly in place across the tropical Pacific in December 2020. Forecasters estimate a 95% chance La Niña will last through Northern Hemisphere winter. La Niña can influence seasonal climate in the United States. Conditions so far have not looked especially La Niña-like, but winter is far from over.

El Nino -La Nina is a naturally occurring phenomena in that it has been observed much longer than the industrial era of fossil fuel C02 emissions. 

Solar Cycle 25

Solar Cycle 25 has been underway since December 2019.   The forecasts comparing SC 25 to SC24 were mostly that they would be comparable. Cycle 24 was the least active SC in 100 years. 

The more active the sun is, the more solar wind and conversely a less active sun produces less solar wind. The Sun’s magnetic field carried by the solar wind regulates the number of cosmic rays that enter the atmosphere.   The less active the sun, more cosmic rays enter the atmosphere.  Thus, low activity should form more cloud cover, thus increasing the albedo. A briefing on how this works is briefly described by a posting on GWPF titled “Force Majeure, The Sun’s role in climate control”, written by Henrik Svensmark:     

“The fundamental idea is that cosmic ray ionisation in the atmosphere is important for the formation and growth of small aerosols into CCN, which are necessary for the formation of cloud droplets and thereby clouds. Changing the number density of CCN changes the cloud microphysics, which in turn changes both the radiative properties and the lifetime of clouds.” (CNC is an acronym for Cloud Condensation Nuclei)

 This would reduce the amount of solar radiation that reaches the Earth’s surface, thus reducing global temperature.

Currently, the solar activity is at a low.

 So, where are we?

The El Nino is a natural phenomenon, that raises the global temperature, and it is usually followed by a La Nina that results in a lowering the global temperature.  We are experiencing a La Nina now.

Solar Cycle 25 in underway and it is forecast to be of low activity.  Time delays are often suggested for the impact of Solar Cycles activity.  This may be the case here and that the impact of Solar Cycle 24 is just now beginning to be felt.

Part two will look briefly at two other natural phenomena that many believe are important in effecting the global temperature.   They are the Atlantic Multidecadal Oscillation (AMO) and the Pacific Decadal Oscillation (PDO).

cbdakota

Computer Predicted Global Temperature Show Man-Made Global Warming To Be A Lie


Frankly, I don’t get it. The actual data is ignored by dedicated warmers.  In the period that the Intergovernmental Panel on Climate Change (IPCC) has been the warmer’s authority on all things related to climate science, the forecasted temperatures have greatly exceeded the actual recorded temperatures.  All one must do is look at the following chart:


The forecast temperatures, generated by a banks of computers, are well above the measured temperatures.  The satellite and balloon actual measurements confirm one onther, And the carbon dioxide (CO2) in the atmosphere is higher than the warmer computer operators expected so the gap between real and computer forecast temperatures should even be greater.  If this gap had only existed for just several years, one might say that we should wait a while because It might possibly start to get smaller. But that is not been the case. As the years go by it has grown larger.  The chart shows the satellite and balloon temperatures  as rising in this chart. That was caused by the El Nino. Those temperatures are now trending down.  Overall, the measured global temperature as shown is rising, but this is  due to natural forces with only a minimal amount due to CO2.     

Temperature is the driver for their forecasts of all the catastrophic thing they imagine will happen.   Melting glaciers, disappearance of the Arctic sea ice, sea level rise of many meters, droughts, floods, tornados, hurricanes, loss of species, massive migrations, diseases moving in a polar direction etc. are all a function of the very high projected global temperatures. 

They keep teasing you by telling you that there is “tipping point” that if reached will result in an uncontrollable ramp-up of temperature that will have catastrophic results.  Can we really believe this as their prediction batting average is not very good? 

I used to be a frequent contributor of “letters to the Editor”.  Most of my letters asked why the media continued to publish these outlandish forecasts that did not come true. That they should review the history of what they have published and that they would see the prediction’s failure rate was very high. Aren’t the media supposed to be skeptics?  Not necessarily about just global warming but everything?  They are not fulfilling their obligation to their subscribers.  And that is reflected, obviously, by the decline of subscribers and their withering loss of credibility which has them now rated near the bottom of the polled lists.

To summarize, if the actual temperature is not skyrocketing, the warmer catastrophes are not going to happen. All their bloviating is just that, blovating.  They must keep you worried so they can continue to get money from you and the government to keep them alive.


PS

Some of you may have noticed that my postings have almost been non-existent for many months.  I have had some health setbacks that have kept my posting near zero.  Trigeminal neuralgia is a nasty thing to have. I am on my second bout with it. About 14 years ago, I had my first encounter.  As Trigeminal sometimes does, it went into remission after about a year.  But now it is back. Medication allows me to have mostly pain free days. Having compared notes with my niece who has had Trigeminal longer than I have and much worse, we both find that moving your neck in the ways that one does when typing and reading, really aggravates this damned condition.  I think I am now in condition to continue my blogging- I hope.

cbdakota

July 2017 Gobal Average Temperature –UAH Satellite


The Global Average Temperature (GAT) anomaly rose 0.07°C  in July. The  GAT anomaly now stands at +0.28°C.

The table below shows that the Southern Hemisphere and the Tropics rose from their readings in June.   NOAA says:

“The most recent model forecasts indicate a high probability that the sea surface temperature in the Niño3.4 region will remain at least slightly above average through winter of 2017-18. “

The above is a model prediction, after all.    I note a slight  drop in the ENSO Meter so I suspect that the GAT will continue its downward trend, though maybe not as fast as I had anticipated

YEAR MO GLOBE NHEM. SHEM. TROPICS
2016 01 +0.55 +0.73 +0.38 +0.84
2016 02 +0.86 +1.19 +0.52 +0.99
2016 03 +0.76 +0.99 +0.54 +1.10
2016 04 +0.72 +0.86 +0.58 +0.93
2016 05 +0.53 +0.61 +0.45 +0.71
2016 06 +0.32 +0.47 +0.17 +0.38
2016 07 +0.37 +0.43 +0.30 +0.48
2016 08 +0.43 +0.53 +0.32 +0.50
2016 09 +0.45 +0.50 +0.39 +0.38
2016 10 +0.42 +0.42 +0.41 +0.46
2016 11 +0.46 +0.43 +0.49 +0.36
2016 12 +0.26 +0.26 +0.27 +0.23
2017 01 +0.33 +0.32 +0.33 +0.09
2017 02 +0.39 +0.58 +0.19 +0.07
2017 03 +0.23 +0.37 +0.09 +0.06
2017 04 +0.27 +0.29 +0.26 +0.22
2017 05 +0.44 +0.39 +0.49 +0.41
2017 06 +0.21 +0.32 +0.09 +0.39
2017 07 +0.28 +0.29 +0.27 +0.51

Chart and Tables are from Dr, Roy Spencer’s blog  which you can access by clicking here.

cbdakota

Global Temperature Update– June 2017


The UAH satellite global temperature measurement cooled off to an anomaly of +0.21C in the month of June.  The peak global temperature resulting from the El Nino, is now on its way to normal.  The May global temperature reversed the downward trend by increasing but this was more than offset by the 0.23 C drop in the month of June.  Many postings are arguing that the PAUSE has resumed.   I will leave that alone for several months before commenting.

This anomaly is the lowest since July 2015.

I believe we are in for some global cooling, but it may still be several years away.   I have mixed feelings  about this.  The world will become a harder place for many people if this results in reduced food crops and much higher costs for keeping warm.  Ask those people in Europe that can no longer afford the high cost electricity in the winter  that has resulted from imposing wind and solar energy on them. Cold weather is the real climate killer, not the fantasy of higher temperatures that the warmers spout.  But the good part would be  is it should put a stake in the heart of the catastrophic man-made global warming theory.


YEAR MO GLOBE NHEM. SHEM. TROPICS
2016 01 +0.55 +0.73 +0.38 +0.84
2016 02 +0.86 +1.19 +0.52 +0.99
2016 03 +0.76 +0.99 +0.54 +1.10
2016 04 +0.72 +0.86 +0.58 +0.93
2016 05 +0.53 +0.61 +0.45 +0.71
2016 06 +0.32 +0.47 +0.17 +0.38
2016 07 +0.37 +0.43 +0.30 +0.48
2016 08 +0.43 +0.53 +0.32 +0.50
2016 09 +0.45 +0.50 +0.39 +0.38
2016 10 +0.42 +0.42 +0.41 +0.46
2016 11 +0.46 +0.43 +0.49 +0.36
2016 12 +0.26 +0.26 +0.27 +0.23
2017 01 +0.33 +0.32 +0.33 +0.09
2017 02 +0.39 +0.58 +0.19 +0.07
2017 03 +0.23 +0.37 +0.09 +0.06
2017 04 +0.27 +0.29 +0.26 +0.22
2017 05 +0.44 +0.39 +0.49 +0.41
2017 06 +0.21 +0.32 +0.09 +0.39