When Solar Cycle 25 activity is view versus the forecasted path and comparison to that of SC 24’s actual path seems to provide somewhat different conclusions.
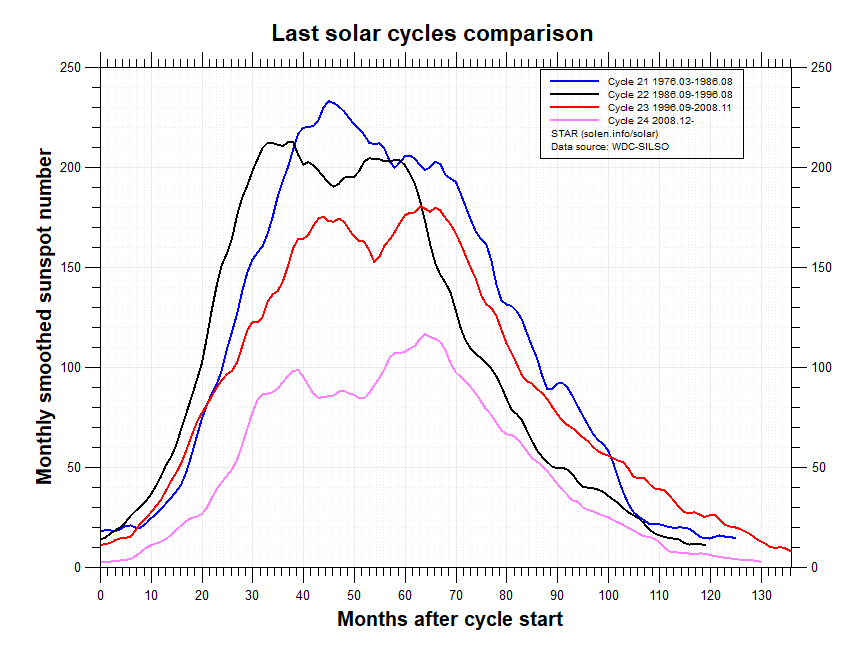
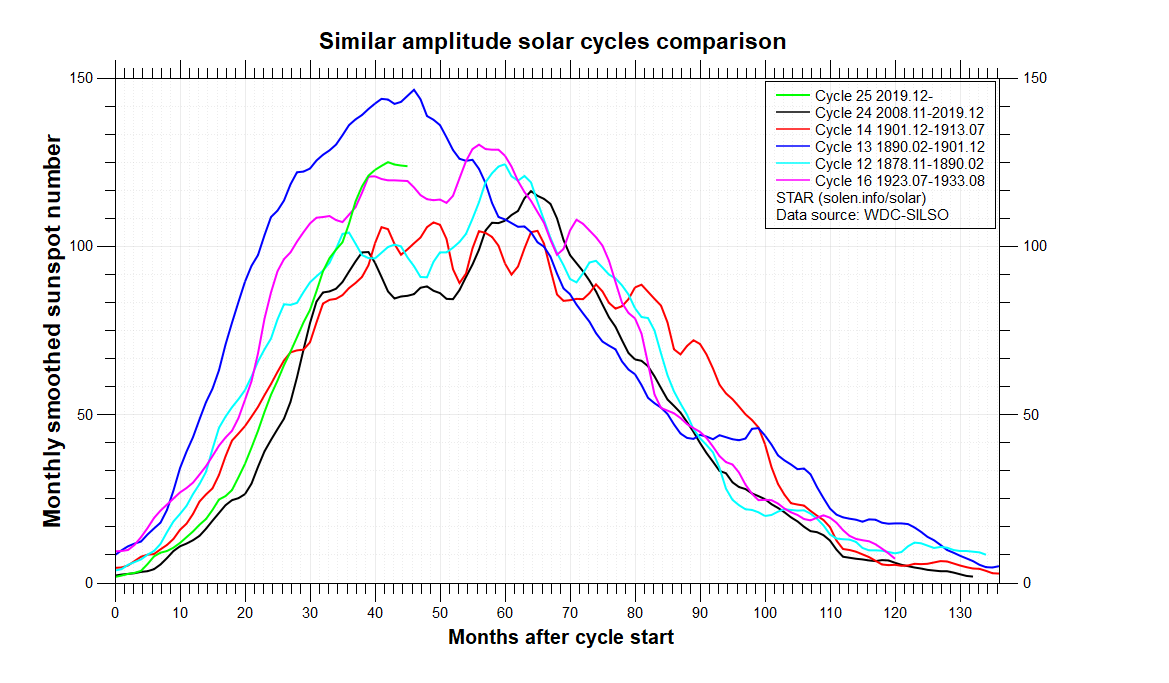
The comparison of SC 24 and SC 25 when viewed at the same amount of time after the cycles started make them look like they are on the same track. Look at about 30 to 31 months after cycle start, the green line (SC 25) and the brown line (SC24) essentially at the same place. Graph curtsey of Solen.com
NOAAs Spaceweather has this to say about SC25’s activity.
“ SUNSPOT COUNTS HIT A 9-YEAR HIGH: In a continued sign of strength for Solar Cycle 25, sunspot counts just hit a 9-year high. This plot from NOAA shows how the monthly sunspot number skyrocketed in January 2023.”
Spaceweather‘s take is versus the official forecast chart, so that doesn’t mean much at any point in time except for the end point. The first chart shows only the smoothed sunspot number.
The Spaceweather chart goes beyond the smoothed sunspot numbers with the December and January raw numbers going up rapidly. SC last roughly 11 years. On the Spaceweather chart, it shows SC 24 sunspots jumped in 2012 which is 11 years ago.
We will have to wait to see if the numbers in the coming months continue the upward trend.
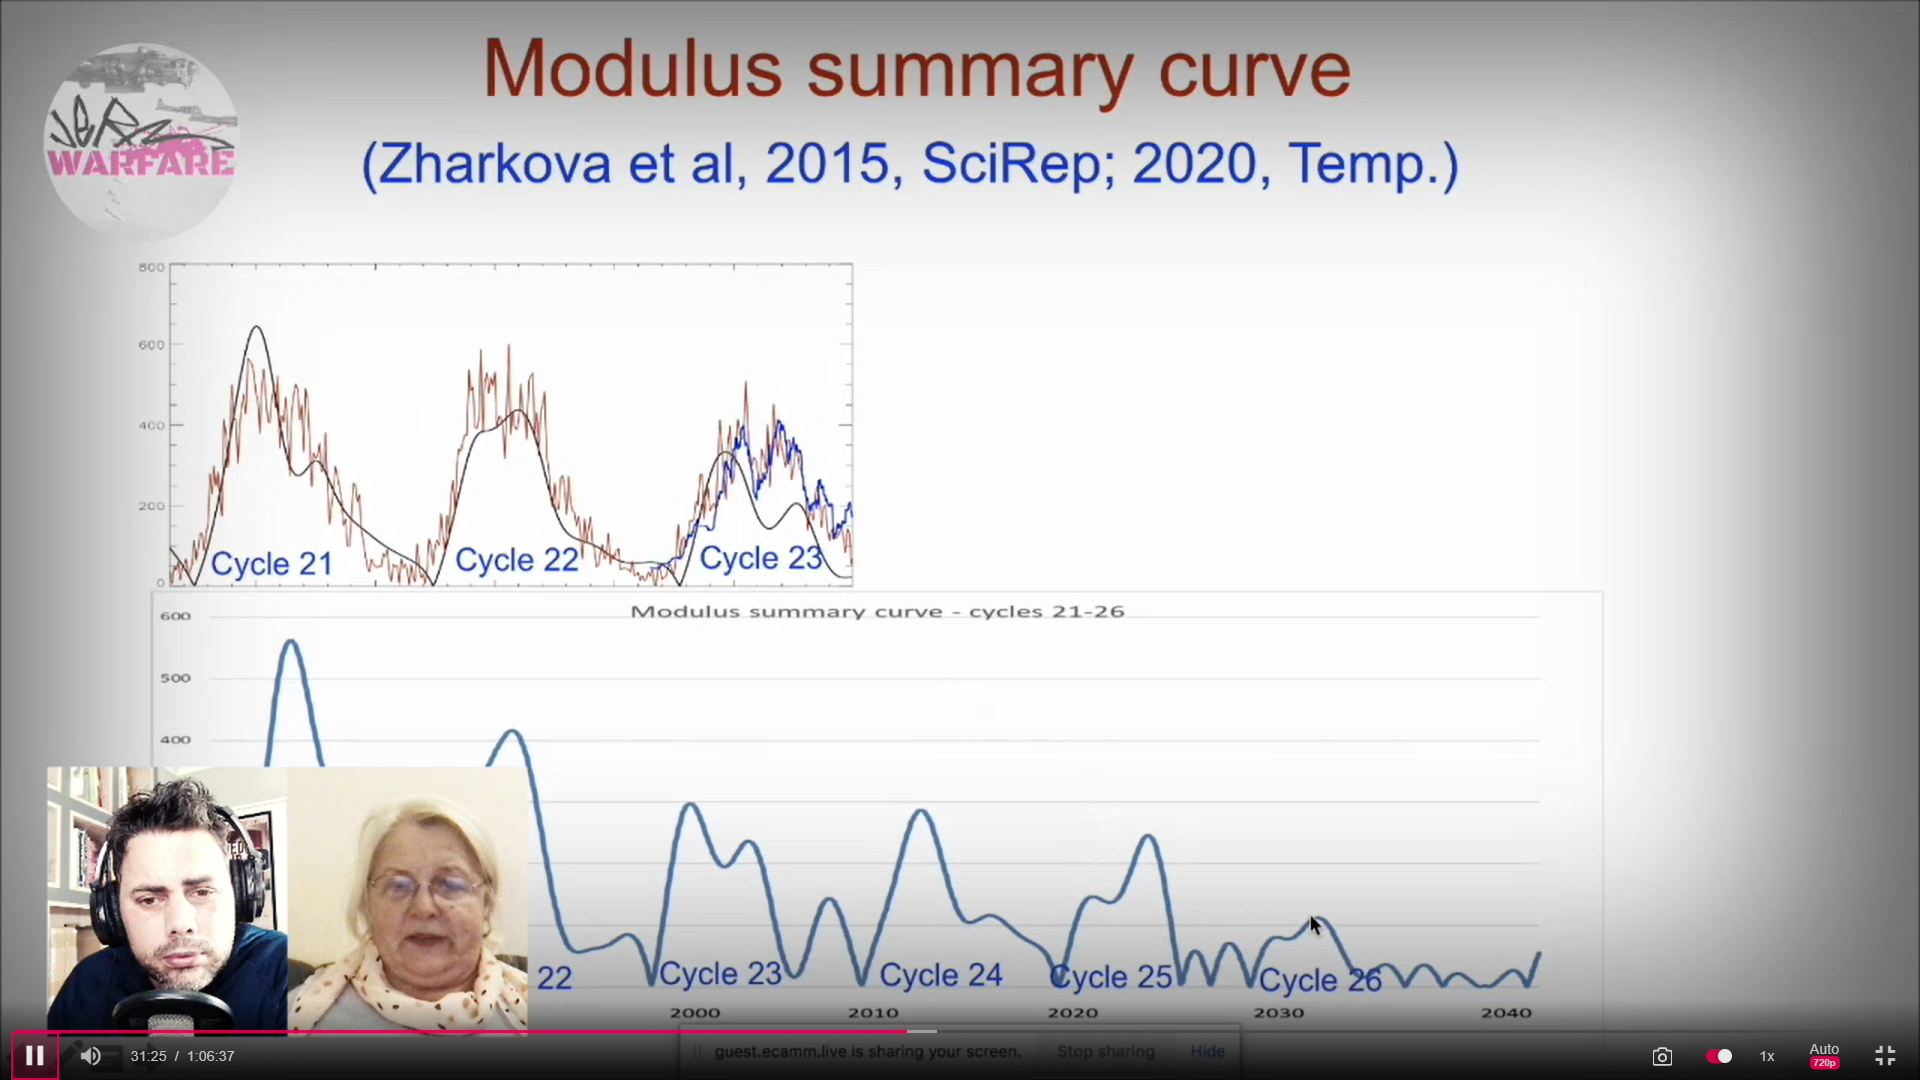
The chart above shows the forecast for Solar Cycles 25, 26 and beyond by Valentina Zharkova.Phd. She believes that she and her team have determined how to forecast solar cycle activity. Solar Cycle 25 is underway and she predicts it will be less active than Solar Cycle 24 and Solar Cycle 26 will be much less active.
Madame Zharkova is much bolder than many other experts with respect to when or if there will be a solar minimum. Before we discuss Madame Zharkova, let’s look into some of the issues that surround the question of an upcoming Solar Minimum.
** The video begins at (2 minutes and 14 seconds.)
To begin with, look at the December 2022 Global temperature. It dropped to an anomaly of 0.05C from November 2022’s 0.17C anomaly. This measurement continues the decline of global temperatures since the last El Nino where the anomaly peaked at about 0.4 C. (Red line)
This has resulted in a number of people saying we are on our way to another “little ice age”. Let’s look at several predictions of serious global cooling
ENSO is the system name acronym for and the Southern Oscillation. It a major factor affecting global temperature.
The El Nino (ocean warming) and the La Nina (ocean cooling) are considered natural phenomena, meaning that they are not man-made actions. A simplistic description of this phenomena is that over a period of time sun and or submerged volcanos, warm a body of western Pacific Ocean, lying along the equator and its temperature rises. This causes atmospheric changes and the hot water flows eastward to the coast of South America. This is called El Nino. After several years the conditions change and the body of water flows westward and cool, deep ocean water along South America coast rises This is the La Nina.. This ebb and flow has a major effect on global weather.
The above chart illustrates the Nino and Nina occurrences from 1990 to the present. Comparing the temperature chart and the Ninos charts show that when an El Nino occurs the global temperature rises. Conversely global temperature drops when a La Nina occurs. The charts seems to show that El Ninos are stronger that La Ninas. (It would be interesting if someone had measured the chart area for the two.)
Now eyeballing the charts, it looks like the strong El Ninos, a natural occurrence, are the major mover of the global temperatures.
Examining the global temperature chart, the period following the 1997 -1998 El Nino, stretching out to about 2015 shows that global temperature is flat, in other words, no significant change in global temperature was recorded. Something like 15/16 years. This happened even though atmospheric C02 was increasing. Does this relegate CO2 to be only a minor forcing? Does this indicate that the sun (or volcanos) are causing global temperatures to rise?
Viewing Solar Cycles.
Solar Cycle 24 was much less active than its predecessors. The new Cycle 25 activity is almost identical to Solar Cycle 24 as can be seen in the following chart
Cycle 25 at 30 months after cycle start is the green line and that is where Cycle 24, the black line, was at thirty months. The other Cycles, from other years, that had unusually low activity are shown on this chart. Cycle 24 the black line was less activity than the others.
For contrast, the following chart shows the “Modern Maximum”, group of Cycles, meaning very active. The chart is a little dated as the last rising blue line is Solar Cycle 24.
The solar cycles 24 and 25 are substantially less active than their predecessors. There is really no strong signal yet that the temperature is dropping due to low activity Solar Cycles. Perhaps there is a time delay built into the system.
Cloud Formation due to weak Solar Cycles
This allows us to examine three theories. First comes the Svensmark theory: From the posting “comes this description of the theory:
“In 1995, Henrik Svensmark discovered a startling connection between the cosmic ray flux from space and cloud cover. He found that when the sun is more active–more sunspots, a stronger magnetic field, larger auroras, stronger solar winds, etc.–fewer cosmic rays strike the earth and cloud cover is reduced, resulting in warmer temperatures.” When the sun is inactive, more of them penetrate the atmosphere. Upon reaching the lower atmosphere where more sulphur dioxide, water vapor, and ozone is present, the cosmic rays ionize the air, releasing electrons that aid in the formation of more CCN and form more dense clouds. This increase in low-cloud amount reflects more solar energy to space, cooling the planet.”
CERN set up chambers to test this theory. While there was some verification, they said that cosmic rays did form clouds, but the formation was much too small to have any effect. It appears that there are many that still think Svensmark is correct. We will have to wait to see future developments.
There are some new theories positing that Ultra Violet (UV) is a player.
First some UV information from Wiki: “The Sun emits ultraviolet radiation at all wavelengths, including the extreme ultraviolet where it crosses into X-rays at 10 nm. Sunlight in space at the top of Earth’s atmosphere is composed of about 50% infrared light, 40% visible light, and 10% ultraviolet light, for a total intensity of about 1400 W/m2 in vacuum.[22]
The atmosphere blocks about 77% of the Sun’s UV, when the Sun is highest in the sky (at zenith), with absorption increasing at shorter UV wavelengths. At ground level with the sun at zenith, sunlight is 44% visible light, 3% ultraviolet, and the remainder infrared.[23][24] Of the ultraviolet radiation that reaches the Earth’s surface, more than 95% is the longer wavelengths of UVA, with the small remainder UVB. Almost no UVC reaches the Earth’s surface.[25]
The shorter bands of UVC, as well as even more-energetic UV radiation produced by the Sun, are absorbed by oxygen and generate the ozone in the ozone layer when single oxygen atoms produced by UV photolysis of dioxygen react with more dioxygen. The ozone layer is especially important in blocking most UVB and the remaining part of UVC not already blocked by ordinary oxygen in air.”
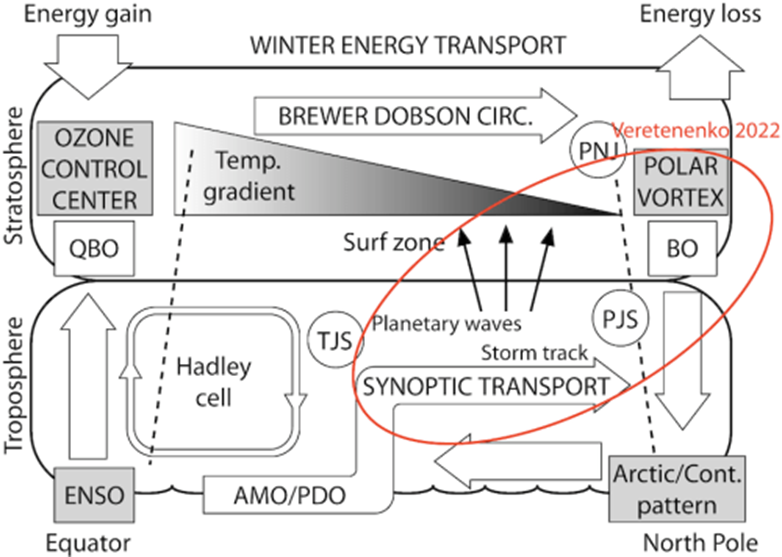
Here is one of the UV theories It is called the Winter GateKeeper Hypothesis. I would like to say that I know enough to describe this hypothesis, but I can not. Dr Judith Curry has posted it on her site, which I think is a favorable appraisal of this hypothesis. She has also noted another researcher which seems to have a favorable opinion. So I will give you a summary:
“The Winter Gatekeeper Hypothesis integrates different components of the transport system in the stratosphere, troposphere, and ocean. A schematic of the energy processes involved is presented in Fig. 8.1, with energy transport represented by white arrows. Solar modulation starting in the stratosphere affects all transport, and Vinós (2022) showed a solar effect on ENSO and the polar vortex. The mechanism by which solar activity modulates ENSO activity is still unknown, but this author proposes a solar modulation of the Brewer-Dobson tropical upwelling, known as the “tropical route” of the “top-down mechanism” (Maycock & Misios 2016; Vinós 2022).”
“Fig. 8.1. Northern Hemisphere winter meridional transport outline. The energy gain/loss ratio at the top of the atmosphere determines the maximal energy source in the tropical band and the maximal energy sink in the Arctic in winter. Incoming solar energy is distributed in the stratosphere and troposphere/surface where it is subjected to different transport modulations. Energy (white arrows) ascends from the surface to the stratosphere at the tropical pipe (left dashed line) and is transported towards the polar vortex (right dashed line) by the Brewer–Dobson circulation. Stratospheric transport is determined by UV heating at the tropical ozone layer, which establishes a temperature gradient affecting zonal wind strength through thermal wind balance, and by the quasi-biennial oscillation (QBO). This double control determines the behavior of planetary waves (black arrows) and determines if the polar vortex undergoes a biennial coupling with the QBO (BO). In the tropical ocean mixed-layer, ENSO is the main energy distribution modulator. While the Hadley cell participates in energy transport and responds to its intensity by expanding or contracting, most energy transport in the tropics is done by the ocean. Changes in transport intensity result in the main modes of variability, the AMO, and PDO. Outside the tropics, most of the energy is transferred to the troposphere, where synoptic transport by eddies along storm tracks is responsible for the bulk of the transport to high latitudes. The strength of the polar vortex determines the high latitudes winter climate regime. A weak vortex promotes a warm Arctic/ cold continents winter regime, where more energy enters the Arctic exchanged by cold air masses moving out. Jet streams (PJS, polar; TJS, tropical; PNJ, polar night) constitute the boundaries and limit transport. Red oval, the part of the Winter Gatekeeper Hypothesis studied in Veretenenko 2022. Figure from Vinós 2022”
Finally, a few notes about the Zharkova theory.
From the posting in Principia Scientific titled “The Woman Who Could Cancel Net Zero”comes another theory. The woman in this case is Professor Valentina Zharkova of the University of Northumbria. The professor’s fields are applied mathematics, plasma physics, pattern recognition, solar-terrestrial physics and solar activity. She forecasts that “in the next 30yrs, global warming problem will be last thing in our mind. Then the solar cycles return to being active.
With her team, she has studied the Sun’s many magnetic fields. She says that sunspots are not a strong enough signal to base any predictions on. So the team separated the magnetic fields in separate components with a principal component analysis using Eigen vectors and Eigen values. She used the output to create a method to predict solar cycle activity. She maintains that she demonstrated that the teams work can closely match the past solar cycles and they can use it to project the future solar cycle activity.
It would be enormous step in understanding the Sun if Dr Zharkova’s system proves out. It might well be a big hit on the man-made global warming theory, too.
The global temperature anomaly, as read by the UAH satellite system, dropped in January about 0.03 C to + 0.12C. This follows a drop of 0.25C to +0.15C in December of last year. Since the last El Nino, when the anomaly peaked out at +0.50C in February 2020, the anomaly has dropped by 0.38C.
. NOTE: We have changed the 30-year averaging period from which we compute anomalies to 1991-2020, from the old period 1981-2010. This change does not affect the temperature trends.
Dr Spencer’s note above, alerts the reader that the anomaly chart was change beginning in January 2021. I believe the scientific organization are all remaking their charts to comply with the new averaging period. I suspect that it is to make more room above the averaging period.
Why is the global temperature falling? Has something happened to the Green House gases? Let us take a quick tour of the natural forces and see what part they are playing.
El Nino-Southern Oscillation
Currently the La Nina is dominating the Tropical Pacific Ocean. NOAA published an advisory saying:
La Niña—the cool phase of the El Niño-Southern Oscillation climate pattern—was firmly in place across the tropical Pacific in December 2020. Forecasters estimate a 95% chance La Niña will last through Northern Hemisphere winter. La Niña can influence seasonal climate in the United States. Conditions so far have not looked especially La Niña-like, but winter is far from over.
El Nino -La Nina is a naturally occurring phenomena in that it has been observed much longer than the industrial era of fossil fuel C02 emissions.
Solar Cycle 25
Solar Cycle 25 has been underway since December 2019. The forecasts comparing SC 25 to SC24 were mostly that they would be comparable. Cycle 24 was the least active SC in 100 years.
The more active the sun is, the more solar wind and conversely a less active sun produces less solar wind. The Sun’s magnetic field carried by the solar wind regulates the number of cosmic rays that enter the atmosphere. The less active the sun, more cosmic rays enter the atmosphere. Thus, low activity should form more cloud cover, thus increasing the albedo. A briefing on how this works is briefly described by a posting on GWPF titled “Force Majeure, The Sun’s role in climate control”, written by Henrik Svensmark:
“The fundamental idea is that cosmic ray ionisation in the atmosphere is important for the formation and growth of small aerosols into CCN, which are necessary for the formation of cloud droplets and thereby clouds. Changing the number density of CCN changes the cloud microphysics, which in turn changes both the radiative properties and the lifetime of clouds.” (CNC is an acronym for Cloud Condensation Nuclei)
This would reduce the amount of solar radiation that reaches the Earth’s surface, thus reducing global temperature.
Currently, the solar activity is at a low.
So, where are we?
The El Nino is a natural phenomenon, that raises the global temperature, and it is usually followed by a La Nina that results in a lowering the global temperature. We are experiencing a La Nina now.
Solar Cycle 25 in underway and it is forecast to be of low activity. Time delays are often suggested for the impact of Solar Cycles activity. This may be the case here and that the impact of Solar Cycle 24 is just now beginning to be felt.
Part two will look briefly at two other natural phenomena that many believe are important in effecting the global temperature. They are the Atlantic Multidecadal Oscillation (AMO) and the Pacific Decadal Oscillation (PDO).
The Global Warming Policy Forum on 15 May 2020 posted “The Sun Has Entered “Very Deep” Solar Minimum”/authored by David Whitehouse. It provided a list of predictions of SC 25’s maximum sunspots. I have rearranged the chart to show the predictions that suggest it will be less active than SC 24, those that expect SC24 and SC25 to be nearly identical and those that predict it will more active.
As a benchmark, SC 24 sunspots at maximum were 116.4
I have been wondering if the very quiet Solar Cycle (SC)24 would result in a slowing down of the rise of global temperatures. And that it might even halt the rise or perhaps even result in a downward trend. Certainly, the prognostications by many of my compadres, the skeptics, have been for that to happen. I look at my go-to anomaly temperature chart, the satellite measuring system know as UAH, (University of Alabama at Huntsville) and I see that the temperature continues to rise. The Watts Up With That site’s ENSO meter (below) had not gone into the la nina area, but in fact, seems to be indicating more el nino. However, for several months, now,
And the UAH temperature anomaly has taken a significant two month drop.
Dr Spencer’s site posted “UAH Global Temperature Update for April 2020:+0.38 deg. C. Spencer says:
“In April, 2020, the Northern Hemisphere experienced its 2nd largest 2-month drop in temperature in the 497-month satellite record.”
The UAH temperature anomaly is shown below.
One can see the last two El Ninos on this chart. The El Nino that peaked in 2010 followed by a La Nina brought the anomaly down to the zero line. Then the temperature anomaly began to rise and peaked out during the 2016 -2017 El Nino. But after a drop, it turned into a rather depressing climb.
More on Solar Cycle 24. It began in December 2008. It has been the least active SC for over 100 years. The SCs activity beginning with SC17 through SC 23 is unprecedented and this period is often called the “Modern Maximum”.
Sunspots are considered a proxy for solar activity. The more sunspots the more activity. Sunspots were first recorded by Galiello in 1610. Formal recording of sunspots began about 1750. The naming of SCs began from that time. SC nominally are 11 years long.
So, does mean that low solar activity may not have a significant, if any effect on global temperature. But maybe there is a time delay. I guess we will have to wait and see.
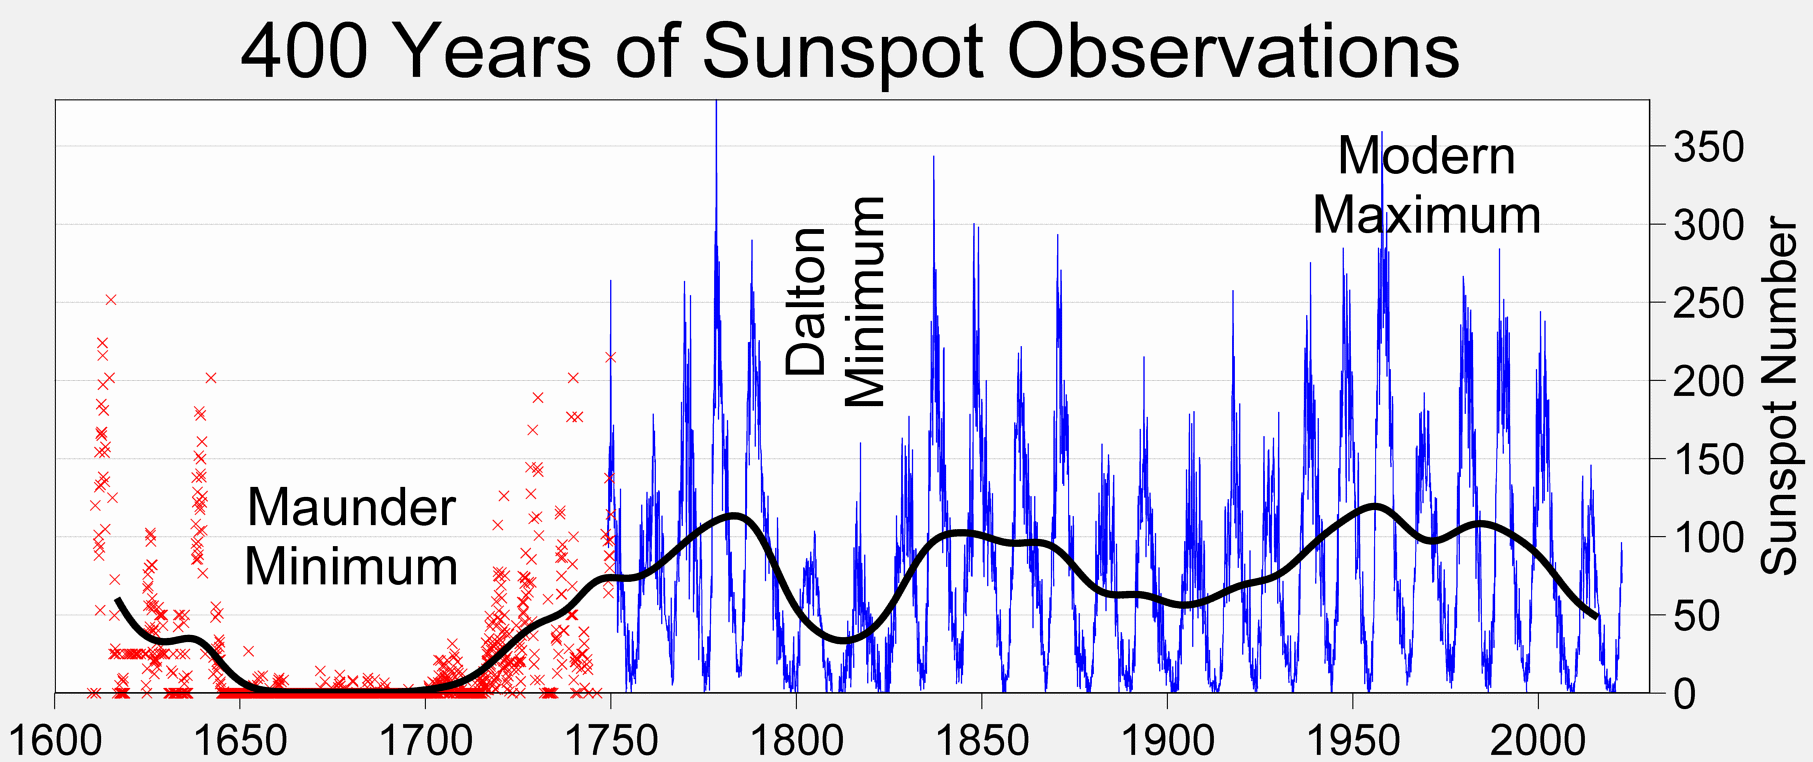
When you look at the following chart, there is one very notable dip in the number of sunspots attributed to SC5 and 6 beginning about about 1800. The temperatures recorded during this time dropped significantly. For example the Thames River is said to have frozen over in the winter during that period. This period is known as the Maunder Minimum. Chart is courtesy of Solan In fo
SC 21, 22, 23 and 24 are plotted on the following chart. Comparing SCs 21, 22, 23 to SC 24 makes evident the low activity of SC24. The Chart is courtesy of Solan Info.
Because SC 24 is reasonably a match to SC5 and 6, one can see why many of our scientists considered history would repeat itself by experiencing low global temperature
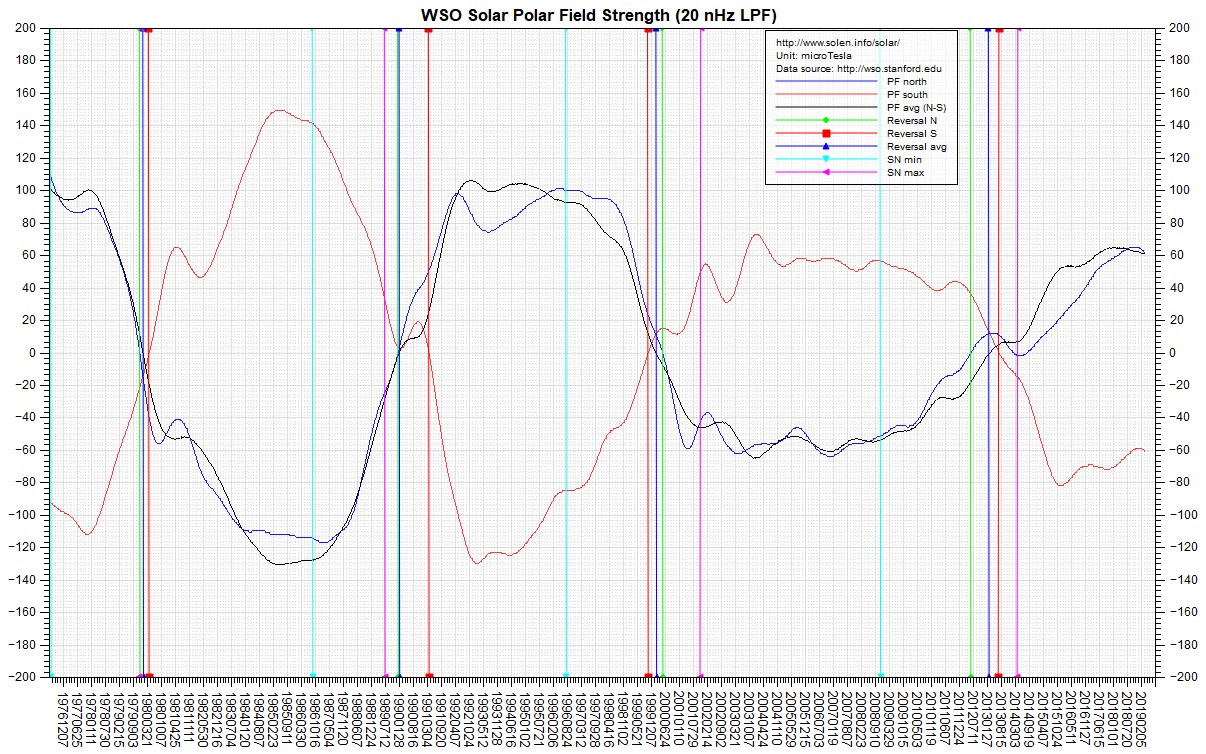
Prior to the advent of SC 24, there were many predictions of its level of activity. Most of the predictions were for a replicate of SC 23. Leif Svalgaard’s predicted a major change in its level of activity. He was predicting about half as active as were most of the predictors and we know now that he was right. Svalgaard’s method used the Solar Polar Field Strength to make the prediction.
I know many of you know all about the solar polar fields, but for those that do not, let me review what the following chart tells us.
The X axis is time beginning on 7 Dec 1976. It extends out to 2 Feb 2019 showing part or all of SCs 21,22,23 and 24. Solar Cycle 24 began January 2008 and is forecast to end late 2019 or early 2020. SC 24 was at maximum activity during April 2014 with a smoothed sunspot number of 111.. The maximum typically occurs when the South magnetic field and the North magnetic field reverse positions. In the chart above, the red (South) moving line crosses the zero Field strength line noted on the Y axis going south and the north (Blue) moving line crosses zero going north. These fields continue toward the poles where they begin producing sunspots in the high Sun latitudes. The fields begin to move toward the zero line and the new SC 25 will begin.
To make the prediction one has to use the black line, the north field strength minus the south field strength, to make the prediction. The time to make the prediction is when the black line is the furthest from the Y axis zero line. This occurred in the spring of 2004 so they predicted SC24 to be small. If you look at the black line, say in January 2018 it is about the same distance from the zero line so the gurus are saying SC25will be about the same size as SC24.
If Leif Svalgaard reads this, he would probably say I have oversimplified the procedure and do not have it exactly right. So be it.
The National Weather Service posted the following “Solar experts predict the Sun’s activity in Solar Cycle 25 to be below average, similar to Solar Cycle 24”
April 5, 2019 – Scientists charged with predicting the Sun’s activity for the next 11-year solar cycle say that it’s likely to be weak, much like the current one. The current solar cycle, Cycle 24, is declining and predicted to reach solar minimum – the period when the Sun is least active – late in 2019 or 2020.
Solar Cycle 25 Prediction Panel experts said Solar Cycle 25 may have a slow start, but is anticipated to peak with solar maximum occurring between 2023 and 2026, and a sunspot range of 95 to 130. This is well below the average number of sunspots, which typically ranges from 140 to 220 sunspots per solar cycle. The panel has high confidence that the coming cycle should break the trend of weakening solar activity seen over the past four cycles.
“We expect Solar Cycle 25 will be very similar to Cycle 24: another fairly weak cycle, preceded by a long, deep minimum,” said panel co-chair Lisa Upton, Ph.D., solar physicist with Space Systems Research Corp. “The expectation that Cycle 25 will be comparable in size to Cycle 24 means that the steady decline in solar cycle amplitude, seen from cycles 21-24, has come to an end and that there is no indication that we are currently approaching a Maunder-type minimum in solar activity.”
This is the Experts’ chart below and it shows the 24 SCs with the maximum sunspots ( see Y axis) and the time it occurred.. Also, the Experts have plotted SC25 on the chart::
The Experts are also predicting SC26 when they say “The expectation that SC 25 will be comparable in size to SC 24 means that the steady decline in solar cycle amplitude, seen from cycles 21-24, has come to an end and that there is no indication that we are currently approaching a Maunder-type minimum in solar activity.”
Sometime ago, every month I blogged a brief report on the activity of the Sun. I have the urge to do that again, so here goes.
Solar Cycle (SC) 24 has just about run its course. It is forecast to give over to SC 25 in late 2019/early 2020 and when it does, that’s call the 24SC minimum.
Sunspots are a proxy for Solar activity. The chart below shows the average number of sunspots in each month. The blue dashed line is a 13-month averaged sunspot count. It is the official sunspot number. (The formula for the count is shown at the end of this posting.) The official number of sunspots peaked in April of 2014 thus the solar maximum happened then.
The chart below illustrates how recent SCs compare to SC 24:
All three of the preceding SCs were much more active than SC24.
As side note, the SCs on average last for 11 years, or saying another way, 132 months. At one time, it was believed that if the SC was over before 11 years it was generally an active SC. More than 11 years, less active.
The chart below shows the 24 SCs and the chart makers attempt at a SC25. The X axis is in years from 1749 to an estimated 2040. The Y axis is sunspots
One can see that SCs 23, 22, 21, 19, and 18 represent a very active sun. The maker of the chart calls this the “modern warm period”. Looking back the chart maker has noted the time of the “Dalton Minimum” and the “little ice age”. These periods of low solar activity coincide with the periods of low global temperatures. Perhaps you can see why many scientists are forecasting that global temperatures will soon be dropping. Also one can speculate that the global warming we have experienced may be a product of the past 60 years of a very active sun. Ok, now one more reading of the chart might suggest that we are due for a period of low solar activity thus a drop in global temperatures. The chart maker’s projection of SC 25 to be lowest in recorded history is very likely to be wrong. However the batting average of the predictors of future SCs is not too stellar so who knows.
Throughout the recent past, claims were made that the global temperature was going to drop because SC 24 was relatively inactive. I do not think that the temperature did drop. I believe I read one article where the claim was that SC 24 was the reason that the increased CO2 in the atmosphere did not raise the temperature as much as it should have. I don’t believe that one.
Was SC 24 definitely an uniquely quiet SC? I think so.
The sunspot activity of the cycles in comparison. The numbers in the diagram are obtained by summing the monthly differences between the observed SSN and the mean (blue in Fig.1) up to the current cycle month 125. ( I am not sure whom to attribute this chart but I got it from Prof. Fritz Vahrenholt and Frank Bosse who write the diekaltesonne blog.)
This shows that at just about 10-1/2 years, SC 24 has had 4464 fewer sunspots than the average SC. It also shows that SCs 5 and 6, had the fewest sunspot and those two SC are coincident with the Dalton Minimum. SC 12, 13, 14, 15, and 16 were way low on sunspots and they coincided with the little ice age.
It is clear that the sun was much less active as demonstrated by the sunspot record. I expected a clear sign by the end of its cycle, which we have not yet seen, of a cooling global temperature trend. Some think we have that, but I do not see what I expected from the UAH satellite global temperature readings. The temperature has declined since the last El Nino but it has not been lowered to the temperature before that El Nino.
Next a look at Solar Cycle 25.
Cbdakota
Sunspot Counting–Woolf Number
The smoothed count is a 13-month averaged sunspot count using this Belgium’s formula: Rs= (0.5 Rm-6 + Rm-5 + Rm-4 + Rm-3 + Rm-2 + Rm-1 + Rm + Rm+1 + Rm+2 + Rm+3 + Rm+4 + Rm+5 + 0.5 Rm+6 ) / 12 Rs = smoothed monthly sunspot count Rm = One month’s actual sunspot count The “-6” through “+6” appended to each Rm is the number of months before or after the month whose smoothed count is being calculated. The beginning and ending months in the formula are only given half the value of the others.*
Solar Cycle 24 still has some surprises. Both the NOAA Sunspot count and F10.7 solar flux spiked. The right hand side of the chart below, from Solen shows the Sunspot count to have peaked at about 120 and the F10.7 solar flux above 130. Sunspot count and Solar Flux usually act in unison. Dr Svalgaard says that F10,7 is a more reliable indicator of solar activity than Sunspots
Last major update issued on September 6, 2017 at 05:00 UT. Update posted at 13:50 UT
The generally accepted way to portray Sunspots is using a smoothed count from Sunspot Index and Long-term Solar Observations (SILSO). SILSO data is provided by the Royal Observatory of Belgium, in Brussels. That number is charted below as Ri smoothed. ” Smoothed” is the process of averaging the daily numbers over some period of time. Silso number uses a formula* (see below) that incorporates some 13 months of monthly data.
In the chart below, Ri is the total monthly Sunspots that were occasioned by the solar polar fields, north (Rnorth ) and south (Rsouth).
Spikes in activity are not uncommon as can be seen in the above chart which chronicles Solar Cycle 24 from its beginning to the current time. I am still surprised at this late date.
cbdakota
*The Silso formula:
The smoothed count is a 13-month averaged sunspot count using this Belgium’s formula:
Rs= (0.5 Rm-6 + Rm-5 + Rm-4 + Rm-3 + Rm-2 + Rm-1 + Rm + Rm+1 + Rm+2 + Rm+3 + Rm+4 + Rm+5 + 0.5 Rm+6 ) / 12
Rs = smoothed monthly sunspot count
Rm = One month’s actual sunspot count
The “-6” through “+6” appended to each Rm is the number of months before or after the month whose smoothed count is being calculated. The beginning and ending months in the formula are only given half the value of the others.*
Solar Cycle 24 is on its way to a “minimum” . That Minimum will probably be in late 2019 or early 2020. The video illustrates several issues that are newsworthy.
Global Temperature measurements made by satellites are often consider the “gold standard”. Two organizations make and report their interpretation of these measurements. The UAH and RSS organizations have typically reported very nearly the same temperatures but separation of the values occurred with RSS now giving higher readings. A major part of the separation is based how to correct for the drag that these satellites encounter as the circle above the Earth.
And a small point. When the narrator says that Cycle 24 Sunspots were “relatively high” he is comparing the Sunspot level now. However, it might cause some people to think that he means as opposed to other Solar Cycles–which by and large is not true.
Solar Cycle 24 continues to become less active. The June 2017 International Sunspot 30 day average number was 19.4. The maximum for Solar Cycle 24 occurred April 2014 at 116.4. The following chart illustrates how the solar cycle activity has dropped off. Solar Cycle 21 was larger than 22 which was larger than 23 which was larger than the current Solar Cycle 24.


 Spikes in activity are not uncommon as can be seen in the above chart which chronicles Solar Cycle 24 from its beginning to the current time. I am still surprised at this late date.
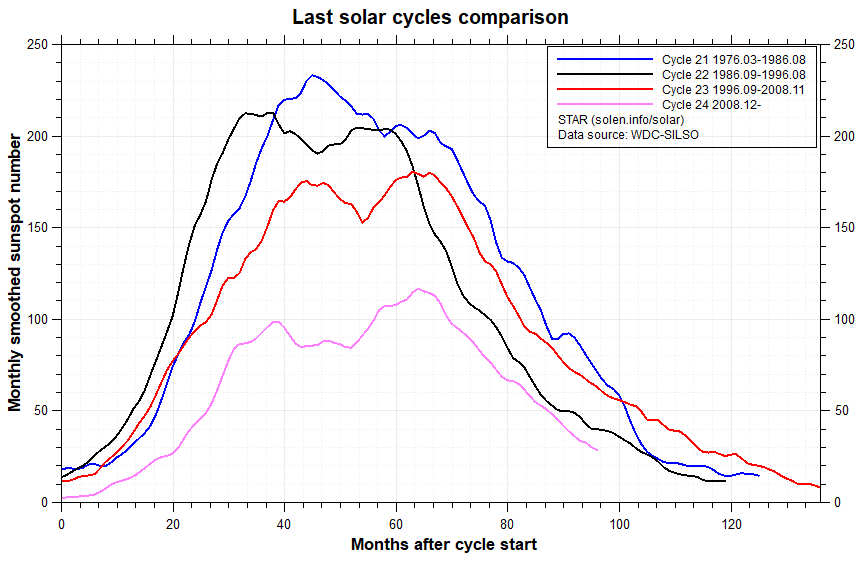
