
When Solar Cycle 25 activity is view versus the forecasted path and comparison to that of SC 24’s actual path seems to provide somewhat different conclusions.
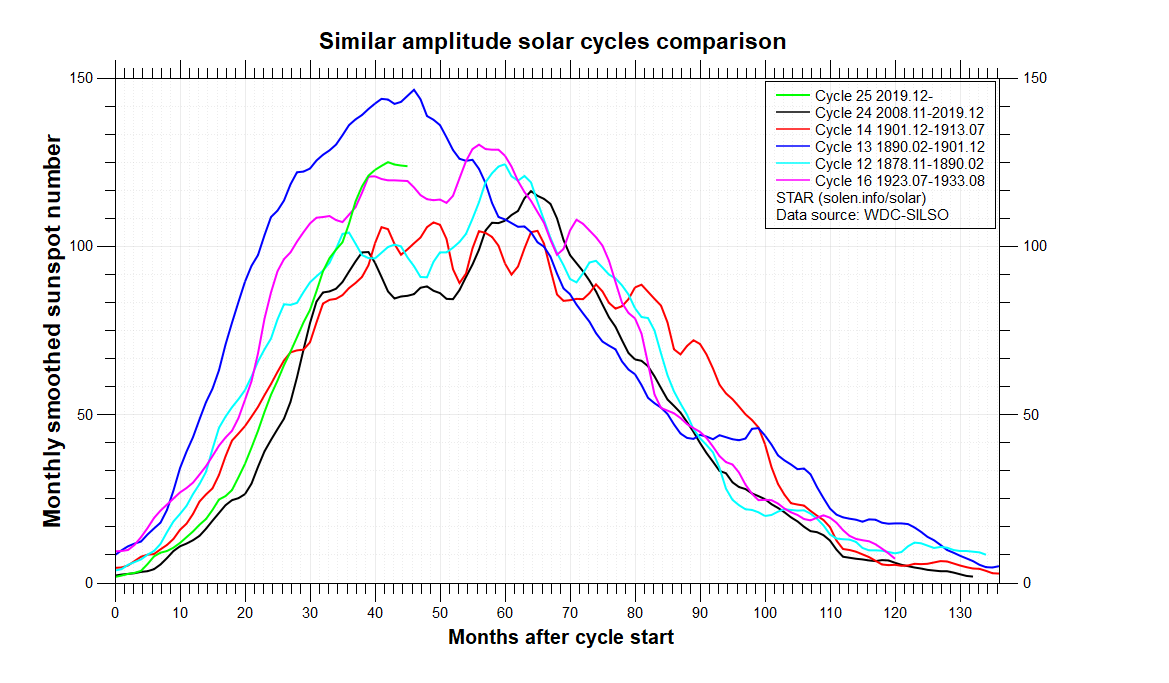
The comparison of SC 24 and SC 25 when viewed at the same amount of time after the cycles started make them look like they are on the same track. Look at about 30 to 31 months after cycle start, the green line (SC 25) and the brown line (SC24) essentially at the same place. Graph curtsey of Solen.com

NOAAs Spaceweather has this to say about SC25’s activity.
“ SUNSPOT COUNTS HIT A 9-YEAR HIGH: In a continued sign of strength for Solar Cycle 25, sunspot counts just hit a 9-year high. This plot from NOAA shows how the monthly sunspot number skyrocketed in January 2023.”

Spaceweather‘s take is versus the official forecast chart, so that doesn’t mean much at any point in time except for the end point. The first chart shows only the smoothed sunspot number.
The Spaceweather chart goes beyond the smoothed sunspot numbers with the December and January raw numbers going up rapidly. SC last roughly 11 years. On the Spaceweather chart, it shows SC 24 sunspots jumped in 2012 which is 11 years ago.
We will have to wait to see if the numbers in the coming months continue the upward trend.
cbdakota
