This view looks north on Plumas Street, just north of Bridge Street in the heart of the Yuba City, California business district. The massive Northern California flood of 1955 remains the deadliest to hit the Yuba City and Marysville region. 38 were killed, 280 homes were destroyed and over 1500 were damaged. The Shanghai Bend on the west levee of the Feather River, about one mile south of Yuba City was breached around midnight on Christmas Eve, and a wall of water cascaded into Sutter County, which forced thousands of residence to evacuate their homes. Photo courtesy of the U.S. Air Force, 136th Engineer Aviation Brigade from Beale Air Force Base. Photo taken December 25, 1955.
Courtesy photo U.S. Force 136th Engineer Aviation Brigade
The American Thinker site posted a blog “Too Wet? Too Dry? It’s All Climate Change”. The author Brian Joondeph debunks the catastrophic global warming. He begins with:
“Climate change, as defined by the United Nations: “Refers to long-term shifts in temperatures and weather patterns. These shifts may be natural, such as through variations in the solar cycle.” That’s actually a good definition.”
“But not willing to leave well enough alone, the UN goes further, spoiling a simple and straightforward definition with: “But since the 1800s, human activities have been the main driver of climate change, primarily due to burning fossil fuels like coal, oil and gas.”
“It is amazing that before humans burned fossil fuels two centuries ago, it was only natural cycles that changed the climate, not backyard barbecues, gas stoves, and SUVs. Yet the UN does not explain how previous ice ages developed due to global cooling, followed by melting of mile-thick ice over the upper Midwest due to global warming, multiple times over the Earth’s history, long before there was any significant human activity.”
“Climate change” was first mentioned in 1975, but this was a time when climate scientists could not decide if temperatures were rising or falling, attributing sinister causes rather than natural and cyclic warming and cooling trends which have long preceded humans and their activities”.
“Since then, climate change has engulfed more than temperature, adding weather events such as hurricanes, tornadoes, blizzards, droughts, and flooding. It seems that any deviation from a sunny day with temperatures in the mid ’70s with a light breeze is evidence of climate change and Republicans scheming to destroy the planet”
“The New York Times, in 2014, ran an opinion piece titled, “The end of snow?” predicting the demise of winter sports and the Winter Olympics due to global warming. Eight years later in 2022, the New York Times told us, “How climate change can supercharge snowstorms.”. Or also in 2022 how, “The deadly freeze that swept the United States was extraordinary, but while scientists know that global warming can intensify extreme weather, the effects on winter storm are tricky to untangle.”
“Tricky indeed. Climate change causes both not enough and too much snow. How does that work? But it’s not only snow but water, both not enough and too much, all due to omnipotent climate change.”
From there he examines the droughts in California. He cites the California Department of Water Resources relating the droughts are frequent. They also say floods are frequent too.
“Again, floods are normal and expected. They are nothing new. Here are photos of floods going back 150 years. “
The November global temperature as reported by the University of Alabama Huntsville (UAH) ***came in at an anomaly of +0.17C. The black dot on the chart is shown to be + 0.17C above the arbitrary fixed line. Recent monthly global temperature readings were
July +0.36 ; Aug. +0.28; Sept. +0.24 ; Oct. +0.32 ;
The measurements are the up and down lines, and the fixed line nominally has half of the temperature measurements above and half below the line. The two peaks, about 2017 and 2020 are the effect of El Ninos, naturally occurring phenomena. Not man-made.
Temperature has been declining since those two El Ninos. The opposite effect is a La Nina that usually occurs following an El Nino. Currently the global weather is experiencing a La Nina. La NInas typically result in drought conditions in the southwestern part of the US, for example.
Chart is courtesy of Dr. Roy Spencer.
While the chart is up there, following the very large El Nino that occurred in 1998/1999, the average temperature from then until about 2014/2015, did not rise. This 15/16-year period experienced continual rising of CO2 in the atmosphere. So, you can draw several conclusions as to why did it not rise? One is that there are natural forcing agents that were cooling the atmosphere. Two, is that maybe CO2 is not really what is theorized to be.
Detailed look at regions like North America, Southern Hemisphere, the Arctic, etc.by clicking here DrRoySpencer.PhD
***There are a number of organizations that chart global temperature. The best source is the UAH satellite data. It is the first that used satellites when it began in 1978/1979 and has continued to date. The satellite system measures the ocean temperature as well as the ground temperature. Others source temperature data from stations located around the globe. But these stations are concentrated in places that are inhabited and for the rest of the globe, they make estimations.
Confirming the accuracy of the UAH temperature measurements is that they match closely to the primarily land-based radiosonde (weather balloons) temperature measurements. The real temperature of the globe is contested. But the change in temperature from month to month is generally agreed to. You may have wondered why the Alarmist always speak about an anomaly increase in temperature of 1.5C., and not a specific temperature.
The following is a guest posting by Richard Cronin. He provides a well-documented discussion of how Tidal Pumping drives weather and Climate.
By Richard Cronin
There is no “climate crisis”. The internal heat of the Earth delivered to the ocean floor is grossly misunderstood.
An entirely unappreciated energy input onto the surface of our planet is Tidal Pumping. Not pumping water. Shifting our tectonic plates due to the Earth’s gyrations (Precession, Obliquity, Perihelion, and Orbital Eccentricity) in addition to our varying distance from the planetary gravity fields everywhere from the Sun out to Jupiter.
Milankovitch cycles have nothing to do with solar radiation. They have everything to do with tidal pumping. This information has been coming forward over the last decade by geologists, geophysicists, and astrophysicists. Unfortunately, these disciplines have been overlooked in the discussion about climate.
Tidal pumping by the Sun, Precession of the Equinoxes, Obliquity, Perihelion, Orbital Eccentricity, as well as planetary alignments (particularly Sun, Venus, & Jupiter) move Earth’s tectonic plates. Therefore, all of Earth’s internal heat is delivered to the surface, notably into the waters at the two (2) terminal points of the Pacific’s Ring of Fire. The seismic heat injection is Enormous. Per NASA, this energy input is approx. 99.5 % of all solar radiation but the flawed paradigm is that the internal heat of the Earth is dissipated in Mantle Convection. Mantle Convection and Subduction do not exist.
Per NASA’s very calculations: “The interior of the earth contributes more than 99.5 percent of the total heating of the surface compared with the sun!
This answer, of course is quite wrong because it assumes that 100% of the internal energy is radiated to the surface. In fact, the internal heat source drives powerful convective currents in the mantle so that nearly all of this thermal energy is lost.”
The energy statement is true, but the dissipation of the internal heat into Mantle Convection is wrong. There is no Mantle Convection. The internal heat is delivered to the surface, specifically the ocean floor of our planet and greatly exceeds any causation from minuscule trace gases in our atmosphere.
At the Winter Solstice, the incrementally closer distance between the Sun and Southern Hemisphere induces greater plate movement across the Southern Hemisphere and greater seismicity in the Peru-Chile Trench to drive the El Niño. Alternately, these tidal stresses can find relief and induce greater seismicity in the Tonga-Kermadec Trenches to drive the La Niña. Elevated surface water temperatures near Papua-New Guinea are due to a heat plume emitted from the Tonga Trench, but the heating of these surface waters is also affected by the multi-plate, seismically active regions to the east of Papua-New Guinea, including the New Hebrides and New Britain Trenches. Ergo, sea surface temperatures are highest in these regions east of Papua New Guinea.
Current sea surface temperatures showing cooler waters in the central Pacific and elevated temperatures east of Papua New Guinea. Entirely typical of a strong La Niña:
In “Plate Climatology”, James Edward Kamis describes a single “Source Point” for the La Niña and El Niño as centered on the multi-plate, seismically active regions to the east of Papua-New Guinea. It seems doubtful to me that this region could drive the El Niño off the coast of Peru. I hold that the ENSO is a binodal condition, at either end of the Ring of Fire.
Via bathyscaphic ocean floor mapping, Hillier and Watt (2007) provided an estimate of 1.0 to 3.5 million oceanic seamounts which by definition are formed by submarine volcanoes. This estimate excludes estimates above latitudes 60 degrees North and South. See “Global distribution of seamounts from ship-track bathymetry data” in references.
The Dust Bowl years of the 1930s were caused by a strong, sustained La Niña. Drought across the plains states in summer months , punctuated by springtime flooding conditions further north.
The La Niña brings flooding monsoons across Bangladesh, while the Northern Hemisphere suffers extreme drought in the summer months. Extreme low water conditions across rivers of America’s interior as well as Europe. Yet earlier this spring the Yellowstone River flooded over its banks.
The geochemical reactions throughout the Upper and Lower Mantle are all exothermic (give off heat). Activation Energy is supplied by planetary Decompression. Fischer-Tropsch and Sabatier reactions produce methane and petroleum in unimaginable quantities. (See link). Most is diffused from the ocean floor. Land-based sources are minuscule.
Hydrothermal vents and plain old ocean floor seepage is immeasurable and these acidic discharges react with alkaline ocean waters to release the Heat of Neutralization and the Heat of Dilution.
We have been under pronounced La Niña conditions since autumn of 2020. Last year we went thru the alphabet in hurricane names. Entirely typical of La Niña.
An estimated 50 million tons of water vapor spewed from the Tonga Trench volcano on Jan. 15, 2022. This largest submarine volcano ever observed will produce a warm, wet planet for years. A Richter 7.3 submarine earthquake struck off Tonga on Nov. 11, 2022.
Areas of drought are also caused by an increase in katabatic winds. Moisture condenses on the southern face of the Himalayas, producing monsoons and floods across northern India and Bangladesh. Dry, hot winds flowing down from the Himalayas cause continuous dry conditions for Central Asia.
Significant tidal pumping stresses coincided with the Precession of the planet on Dec. 21, 2021 to tear open the Tonga Trench. Another stress-inducing event is the Perhelion, the closest approach between Earth and Sun, associated with the Earth’s elliptical orbit. The Perihelion occurs two (2) weeks after the Solstices. On April 30, 2022, there was a planetary alignment of Venus-Earth-Mars-Jupiter. On Sept. 26, Jupiter made its closest approach to Earth in 59 years. Tremendous tidal pumping stresses. Tremendous seismic energy release. Totally ignored.
References listed by date. Most of this information was issued in the last half decade. Copy and paste the titles into any web browser.
“Institute for Celestial Geodynamics” ( D. Zbikowski, et al )
“Continental Drift Theory – Unresolved Issues “
“Plate Climatology” by James Edward Kamis. Book published 2019.
“Topological inconsistency of continental drift on the present-sized Earth”
R Meservey. Science. 1969.
“Problem of Convection in the Earth’s Mantle”
E. N. Lyustikh, published in Geophysical Research Letters: 01 January 1969
“Pump-like Tidal Driving of Tectonic Plates – Plates 1” George W. Moore, AAPG Bulletin, GeoScience World, June 1, 1975
“The earth tides”
Judah Levine, December 1982 (NIST)
“Earth tides and the degassing of the Earth”
Khitarov, N. I. ; Voitov, G. I. , March 1982 (NIST)
“Global distribution of seamounts from ship-track bathymetry data”
J.K. Hillier, A.B. Watts, Geophysical Research Letters, July, 2007
—> By definition seamounts are formed by volcanic activity. Hillier and Watt estimate 1 to 3.5 million seamounts and this excludes allowance for regions higher than Latitude 60 degrees. Conservatively, active submarine volcanoes are in the tens of thousands.
“Can Earth’s rotation and tidal despinning drive plate tectonics?”
F. Riguzzi, et al, 2009
“Researchers discover new force driving Earth’s tectonic plates”
Cande & Stegman, Univ. of S. California, July 7, 2011
“On Ohmic heating in the Earth’s core II: Poloidal magnetic fields obeying Taylor’s constraint”. Jackson, Livermore & Ierley, Aug., 2011
“Earth Expansion Evidence: a Challenge for Geology, Geophysics and Astronomy”
G. Scalera, S. Cwojdzinski, National Institute of Geophysics & Vulcanology (Italy), 4-Oct-2011
“Spin-driven tidal pumping: Tidally driven changes in planetary spin coupled with secular interactions between planets.” R. Greenburg et al, Feb. 2013
“Tidal strain and tidal stress in the Earth’s interior” W. Kia, et al, Chinese Journal of Geophysics, November, 2013
“Tidal Stresses – How Gravity Heats Things Up”, Tim James, Dec. 2, 2013 ( author of ‘Astronomical: From Quarks to Quasars, the Science of Space at its Strangest’)
“Secular Increase in the Earth’s LOD (Length of Day) Strongly Implies that the Earth Might Be Expanding Radially on a Global Scale” G.G. Nyambuya ,
4-March-2014
“Asian monsoons in a late Eocene greenhouse world”
A. Licht, G. Dupont-Nivet, et al, Nature, 4-August 2014
—> “But monsoons are still poorly understood, and today’s climate models disagree about how increased carbon dioxide (CO2) in the atmosphere will alter them.”
—> “Asian monsoon began ….. recently several independent teams to around 40 million years ago.” (same duration as Central Asian drought)
“Jupiter’s effect on Earth’s climate”
O. G. Sorokhtin, et al Nov., 2014
“Stanford geologists refute coal development theory” Boyce, Nelson at Stanford 2-Feb. 2016
—> Coal, oil, and gas are NOT produced from squished trees. Fischer-Tropsch (F/T) and Sabatier reactions produce oil and gas on all planets. The only true “fossil fuel” is lignite (brown coal, soft coal, thermal coal) derived from peat bogs of the Tertiary Period. It has only 25 to 35% Carbon value.
—> Heavy crudes, petroleum tars, sub-bituminous coal, bituminous coal vent off volatiles to yield Anthracite (black coal, hard coal) which is 95% Carbon. These carbonaceous fuels all derive from F/T and Sabatier reactions.
“One Paradox of Plate Tectonics”
Laszlo Attila Horvath, July-2016
“Resilience of the Asian atmospheric circulation shown by Paleocene dust provenance”
A. Light, G. DuPont-Nivet et al
Nature Communications 4-August-2016
—> “Our results show that dust sources and near-surface atmospheric circulation have changed little since at least 42 Myr.” (same duration as India-Bangladesh monsoons)
—> “Neither Tibetan uplift nor the decrease in atmospheric carbon dioxide concentration since the Eocene seem to have changed the atmospheric pattern in central Asia,” Licht said. “Wind patterns are influenced by CHANGES IN THE EARTH’S ORBIT over tens or hundreds of thousands of years, but over millions of years these wind patterns are very resilient.”
“Pervasive upper mantle melting beneath the western US”
S. Hier-Majumber, B. Tauzin, et al Earth and Planetary Science Letters. April-2017
—> Just above Transition Region there are Carbonate melts, source of CO and CO2 by acidic attack from sulfur compounds (SO2, etc) produced in the Lower Mantle. CO and CO2 are reagents for Fischer-Tropsch and Sabatier reactions to produce methane and water. Just in the Western U.S. ALONE, centered on Yellowstone, this carbonate melt zone measures approx. 1.8 million sq. km with a thickness ranging from 25 to 70 km. Decomposing just 1 % of this Yellowstone carbonate layer would be equivalent to burning 2.3 trillion barrels of oil.
“The Very Deep Origin of the World’s Biggest Diamonds”
Gemological Institute of America, Winter 2017
—> “Culligan-like diamonds contain …. iron-rich metallic inclusions surrounded by a fluid jacket composed of methane and hydrogen.” This is a Fischer-Tropsch reaction. Iron is the catalyst.
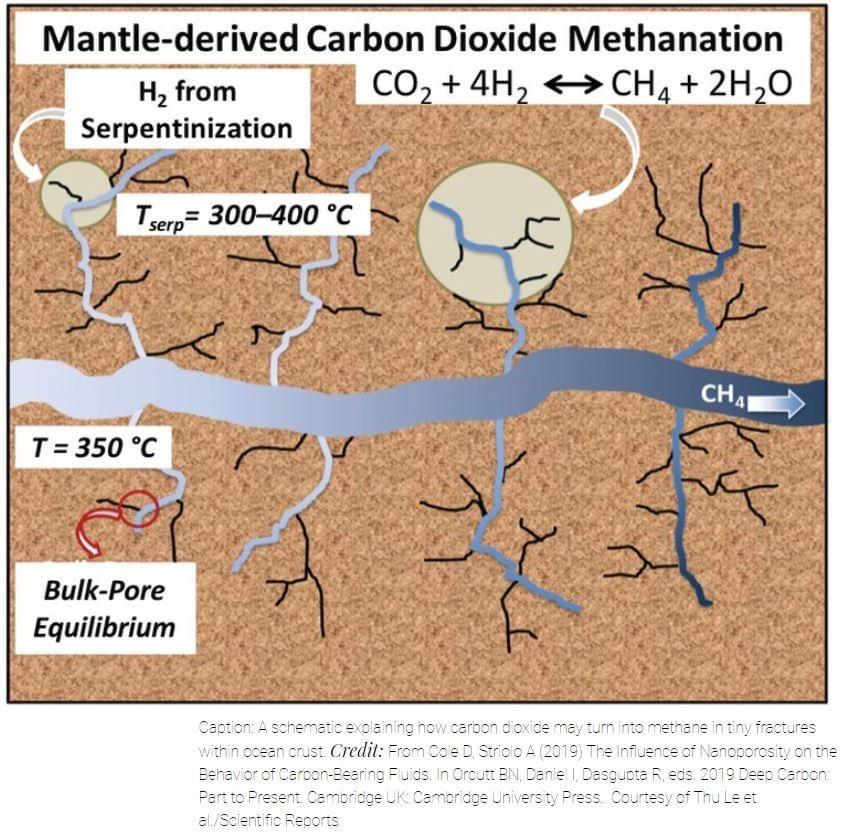
—> Fischer-Tropsch reactions proceed as follows: CO + 3H2, under Reducing Conditions (O2 deficient) and in the presence of an Iron or Cobalt catalyst and starting at 350C, yields methane and water. Further dwell time in a geological “trap” will produce petroleum — in unimaginable quantities. Sabatier reactions perform in much the same way with with CO2 instead of CO catalysts of Vanadium and Silica. CO2 methanation.
“Spectral, spatial-statistical, and graphical evidence that gravitational interaction with the Moon assists in driving Earth’s tectonic plates Part 1”D.Zbikowski, Institute for Celestial Geodynamics, January 2018
“A global forecast for great earthquakes and large volcanic eruptions in the next decade” D. Zbikowski, Institute for Celestial Geodynamics, Sept. 2018
—> “Movement of Earth’s rotational axis with respect to the globe generates motion of the north and south rotational poles upon the surface. Motion of the north rotational pole with respect to the net surface consists of roughly circular wobbles with a quasi-annual period. The wobbles of polar motion are formed primarily from two components-the free Chandler wobble (433 days) and the forced annual wobble (seasonal, 365 days).”
“Empirical evidence for stability of the 405 kiloyear Jupiter-Venus eccentricity cycle over hundred of millions of years.
D.V. Kent, P.E. Olsen, C. Rasmussen, et al, Rutgers University , May 7, 2018
—> “Every 405,000 years, gravitational tugs from Jupiter and Venus slightly elongate Earth’s orbit, an amazingly consistent pattern that has influenced our planet’s climate for at least 215 million years and allows scientists to more precisely date geological events like the spread of dinosaurs, according to a Rutgers-led study.”
“The Ability of Significant Tidal Stress to Initiate Plate Tectonics” by Zanazzi & Triaud, Jan. 2019
“Seismic monitoring reveals tidal stresses in the Earth’s crust”, C. Sens-Schönfelder, et al, Physics World, 15-April-2019
“The phenomenon of subduction is incompatible with Earth’s surface geometry and geomorphology” Lazlo Attila Horvath, July 2019
“Milankovitch (Orbital) Cycles and Their Role in Earth’s Climate”
Alan Buis, NASA Jet Propulsion Laboratory, February 27, 2020
“Tidal modulation of plate motions”
D. Zaccagnino, C. Doglioni, Earth-Science Reviews, June 2020
—> “While mantle convection is fundamental ingredient of geodynamics the driving mechanism of plate tectonics remains elusive. ….. GPS measurements are now accurate enough that, on long baselines, both secular plate motions and periodic tidal displacements are visible.”
—> “Tidal oscillations also correlate with the seismic release.”
“Solar system planetary alignment triggers tides and earthquakes”
S. Awadh, 2021
“Beyond Plate Tectonics”by James Maxlow. Book published 1-Dec.-2021
“Links of planetary energetics to moon size, orbit, and planet spin: A new mechanism for plate tectonics”
A. Hofmeister, Univ. of Washington (St. Louis), January 2022
—> “Tug of sun, moon could be driving plate motions on ‘imbalanced’ Earth”
“The hot zones of global Mw ≥ 5 earthquakes and their decadal migration during 1989–2019”
Jin Chen & Hong Tang, Journal of Geosciences, March 2022
“Precession helped drive glacial cycles in the Pleistocene.”
S. Barker, A. Starr, Geophysical Research Letters. 26-May-2022
GLOBAL-SCALE TIDAL FORCING AND PLATE TECTONICS HAVE BOTH SHAPED THE TECTONIC EVOLUTION OF EUROPA. C. E. Detelich, et al, 53rd Lunar and Planetary Science Conference (2022)
Rebloging a survey of public opinion regarding climate change commissioned by the Global Warming Policy Forum.
GWPF Survey: Perceptions of climate impacts at odds with scientific data
A new Savanta ComRes poll commissioned by the Global Warming Policy Forum (GWPF) has revealed low levels of public awareness of key trends relating to climate change and international development.
The survey of British adults suggests that the public perceive the impacts of climate change to be more negative than the academic research would suggest. However, there is also a significant minority of the public who say they are ‘not very’ or ‘not at all’ concerned by climate change.
In total, 28% of respondents said they were ‘very concerned’ about climate change, 42% said ‘fairly concerned’, 18% were ‘not very concerned’ and 6.4% described themselves as ‘not at all concerned’.
To see the entire posting click on the following link:
The previous posting shows that the warmer’s forecast “average global temperature” is way off from the actual measurements. These alarmists use that erroneous forecast as the basis for their pronouncement of future global catastrophes that will come about if we don’t join their quest to remove CO2 emissions and switch to renewable energy.
The alarmist’s forecasts of catastrophes get maximum coverage in the media. It is obvious that the media never checks to see if the previous forecast have proven correct. And the following will demonstrate that the media never ever question an alarmist prediction and never ever goes back to check out the previous predictions.
There all kinds of alarmist’s forecasts, some of which I covered in an earlier posting titled” CAGW PREDICTIONS—ZOMBIE AND OTHER”. Almost all of them are embarrassingly wrong. I encourage you to click on the link and have some good laughs.
The awful forecasts that follow are from scientists, science organizations and many from the Intergovernmental Panel on Climate Change (IPCC)— a UN organization. This assembly of failure was posted by Javier on The Blog WattsUpWithThat with an intro by Andy May. Andy takes a little liberty with Javier’s posting by adding on a section that highlights obvious predictions that the alarmists should have made.
An outline of the failed predictions are as follows:
·Warming rate predictions
·Temperature predictions
·Winter predictions
·Snow predictions
·Precipitation predictions
·Extreme weather predictions
·Wildfire predictions
·Rotation of the Earth predictions
·Arctic sea predictions
·Polar bear predictions
·Glacier predictions
·Sea level predictions
·Sinking nation predictions
·Climate refugee predictions
·Climate change predictions
–and Andy May’s failure to predict list—
·Greener planet
·Increase in forest biomass
·Carbon sinks increase
·Slowdown in warming
All the above list can be read by clicking on the WattsUpWithThat posting
°If cbdakota were appointed the EPA Administrator, he might begin his work issuing this statement:
I thank President Trump for my nomination and the vote approving the nomination.
Our mission will be that the EPA continues to protect the environment and at the same time does not stifle our Nation’s productivity.
Our initial review of the EPA has found some activities, regulations and guidance documents that need to be critically assessed, cancelled or expanded. The following are several of the items that illustrate the issues we uncovered and our plan to deal with these issues:
Endangerment Finding:
The Endangerment Finding (EF) needs to be re-evaluated, revised and updated using current science. The EF is largely based upon the IPCC pre-2007 climate science, making it more than 10 years old. Furthermore, the projections of temperature, sea level and other variables do not match the actual measured temperature and sea level data. These EF projections greatly overstate the size of the changes thus putting into question the amount of endangerment.
Genetically modified crops (GMC also known as GMO) are plants that have their DNA modified by the addition of other sourced DNA. This is done to impart additional characteristics to the plant so as to reduce their vulnurability to attacks by certain viruses, insects, and molds, for example. This ability has made GMCs in demand world-wide .
Between 1996 and 2015, the total surface area of land cultivated with GM crops increased by a factor of 100, from 17,000 km2 (4.2 million acres) to 1,797,000 km2 (444 million acres).[2] 10% of the world’s arable land was planted with GM crops in 2010.[3] In the US, by 2014, 94% of the planted area of soybeans, 96% of cotton and 93% of corn were genetically modified varieties.[4] Use of GM crops expanded rapidly in developing countries, with about 18 million farmers growing 54% of worldwide GM crops by 2013.[1] A 2014 meta-analysis concluded that GM technology adoption had reduced chemical pesticide use by 37%, increased crop yields by 22%, and increased farmer profits by 68%.[5] This reduction in pesticide use has been ecologically beneficial, but benefits may be reduced by overuse.[6] Yield gains and pesticide reductions are larger for insect-resistant crops than for herbicide-tolerant crops. Yield and profit gains are higher in developing countries than in developed countries
SAFE FOR PEOPLE
Is the use of GMCs safe? From Wikipedias we learn that:
There is a scientific consensus[7][8][9][10] that currently available food derived from GM crops poses no greater risk to human health than conventional food,[11][12][13][14][15] but that each GM food needs to be tested on a case-by-case basis before introduction.
DEVELOPMENT HISTORY
Lets go back for some history related to hybrid crops. Past, modifications to crops:
Warmers are eager to see global warming in any weather event that seems to have a negative effect. We all have seen their contradictory claims that global warming causes dangerous warming, and dangerous cold, and dangerous floods and dangerous droughts, etc. .
Another one of their variable weather happenings that was declared proof of dangerous global warming has come unglued. A Breitbart Posing “Great Lakes Go From ‘Climate Change-Induced’ Low Water Levels To Record Highs In Three Years” illustrates this point:
Between 2010 and 2013, residents of the states surrounding the Great Lakes were told that climate change was permanently altering their environment and the record low water levels being recorded in the lakes may be the new normal. But now, only three years later, news reports are worried about beach erosion because the lakes have rebounded to record high levels of water. “implications for the environment and the economy.”
This week, throughout the Chicago media landscape, as well as in reports in Michigan and Wisconsin, stories about a loss of swimming areas on public beaches are filling airwaves and newspaper pages. Residents and city officials are warning citizens that water levels in Lake Michigan and the other lakes are so high that the shallow swimming areas have been reduced as the water rises. Reports are also express worry over beach erosion and fears that the rising water is a danger to other infrastructure like roads.
In Chicago, for instance, notes that water levels have risen a whopping four feet since 2013 and the new water is “swallowing up beaches.”
The Chicago Tribune reports that the northern suburb of Evanston is losing beachfront property. “All our beaches are shrinking,” Evanston parks director Lawrence Hemingway said. For its part, Chicago’s Fox affiliate worries that the city’s lakeshore bike path is being destroyed by the higher water levels. The Detroit Free Press also noted that the high water is erasing beaches and the water is at highs not seen since the 1990s.
These report are starkly different than those from the 2011 to 2013 timeframe. Then the news reports were warning that the:
“lakes were irreversibly shrinking and that climate change was desolating both commerce and the environment“.
In 2013, for instance, Chicago’s Public Television WTTW bemoaned a “dramatic” change in the climate that was warming the lakes, lowering waterlevels, and threatening to destroy commerce and the environment.
The local PBS story also went national as the PBS Newshour ran stories on the environmental disaster the lakes were experiencing. In 2012 National Geographic sonorously warned that the “climate-related trend” was on the verge of laying waste to the region. Crain’s Detroit was also writing in 2013 that communities living on the edges of the region’s monumental bodies of water were going to have to “adapt” to the new normal of climate change.
Naturally, far left sources were absolutely sure that global warming was drying up the lakes. In 2013 far left website Think Progress worried its readers with claims that climate change was “damaging” the lakes and would present. The Natural Resource Defense Council even contemplated lawsuits to prevent cities on the lakes from tapping into them as a source of water.
Still, it is amazing to see the difference in coverage. Today, with water levels hitting record highs, news reporters and city officials worry over their loss of beachfront property and not a word is mentioned of climate change. Yet only three years ago the same officials and news reporters were sure that climate change was here to stay and we’d better get used to the shrunken Great Lakes.
What a difference a few years makes.
I will bet that in a year or two, all the stories about low water levels being a definite indicator of catastrophic global warming will be forgotten and the narrative will be that the rising waters are a definite indicator of catastrophic global warming.
Currently the weather is being strongly affected by an El Nino. El Nino is but one part of a weather/climate system known as the El Nino Southern Oscillation (ENSO). There are three phases of ENSO — El Nino, La Nina and neutral. ENSO is important because of its ability to change the global atmospheric circulation, which in turn, influences temperature and precipitation across the globe. The global atmospheric circulation is called the Walker Cycle and we will look at that in the next posting.
Many of you already are fully informed about the ENSO but my guess is that some of you are not. I thought it might be helpful to provide some background information. (1)
First of all, we are talking about the Pacific Ocean. The Pacific Ocean from South America to the Maritime Continent(2), a distance of about 10k miles along the equator. Usually the trade winds blow along the equator toward the west. This moves the hot surface water to the Western Pacific. The sea surface is about ½ meter higher in Indonesian than it is in Ecuador. Usually, sea-surface temperatures off South America’s west coast range from the 60°s to 70°s F, while they exceed 80°F in the “warm pool.” This description is essentially that of the neutral phase.
On occasions the easterly winds weaken and the hot water begins to flow eastward toward South America. This is the beginning of an El Nino. It typically starts in the May-June timeframe as the water flows eastward. It reaches it peak strength about December. January through March/April typically are the months that the El Nino begins to lose it strength. Some El Ninos maintain strength longer such as the 1998/1999 El Nino, which is considered one of the strongest ever.
James Delingpole is a Brit that writes for Brietbart.com. He has a sharp mind that he uses to take the obvious and throw it back at the pretenders often with good humor. Somewhat like Mark Steyn. They are a formidable pair and I am glad they are on our side.
The Delingpole posting that I want to discuss was written before the COP21 Paris meeting of the massive group of hanger-ons that go to these conferences on stopping global warming. But, the points he makes in this posting “Twelve Reasons Why The Paris Climate Talks Are A Total Waste” are essentially timeless within the current discussion of the catastrophic man-made global warming theory.
I may summarize the discussion in some of the twelve reasons. So I do recommend that you link to his original posting to read the reasons in their entirety. Don’t ignore the links that are included in this listing.
So, of all the children round the world currently being taught in schools about the perils of man-made global warming, not a single one has lived through a period in which the planet was actually warming