Category Archives: Global Temperatures

February 2013 Global Temperature Update


The global atmospheric temperature anomaly dropped by about 0.33° C to  +.18 degrees above from 30-year (1981-2010) average.

atmospherictempfeb2013UAH_LT_1979_thru_Feb_2013_v5.5

Dr Spencer also reports that the sea surface temperature anomaly for February was
-0.01 º C, relative to the 2003-2006 average.
 seasurfacetempfeb2013RSS_mwSST_2002_thru_Feb_2013
Additional discussion of these anomaly temperature charts can be access by clicking here.
cbdakota

Is Carbon Your Enemy?


I am on a Pointman kick right now, but I can assure you that keeping up with what Pointman has to say is worth your time and his posting ”Sleeping with the Enemy”  is both informative and funny.  He notes that environmentalist believe “carbon” is their enemy even though they really have little understanding who or what that enemy really is.  Pointman gets things going by saying this:
“So, let’s put that other hat on and learn about their elemental enemy. The thing is, I’ve found the alarmists actually don’t do science but like all good scenario explorations, we’ll lose that little detail as part of simplifying the exercise. Let’s get down and boogie up real close to her sexy satanic majesty, Ms. Kickass Carbon. She has a certain ballsy attitude I kinda like.”
By the way, he pays tribute to the Aussies in his audience by naming one of the elements “Vegemitium”.
 Read this enjoyable posting by clicking here.
cbdakota

Environmental Journalism Going Extinct?


Pointman’s March 8, 2013 posting is titled “A Species Facing Extinction”.  In the posting  Pointman concludes the public is growing tired of one scare after another by the alarmist’s.  This is coupled with the economic problems the world is having. The public has to cope with new taxes and the threat of making the price of energy skyrocket. They have had enough.  Pointman says that this is evident in that major media players understand that this is one crisis that is not selling papers or TV space that it once was.  The New York Times has closed its environmental desk. The Washington Post is reassigning environmental reporters to other work. We are aware that the profit motive is draining away as people begin to look to more rational presentations of the news in other arenas.

Solar Cycle 24 Activity Compared To Previous Solar Cycles


Solar Cycle 24 activity dropped off in February.  Charts for sunspots and F10.7 cm radio flux follow:
sunspotmarch13

Collapsing Consensus–Next Targets Are The Professional Societies


In my previous posting I wondered when the “consensus” scientists would begin to openly call into question the theory that CO2 is the primary forcing agent driving global warming. The longer the “pause” in global warming continues, (the IPCC head, Dr. Pachuri said the pause is now at 17 years), the harder it must be to steadfastly hold to the CO2 theory. Skeptics largely agree that CO2 is a forcing agent but have maintained that natural forces were probably the dominate force. In my opinion, the Sun is most likely the major forcing agent even though the exact mechanism has yet to be proven.

Continue reading

Where Are The “Consensus” Scientists Hiding?


Dr Rajendra Pachauri admits that there has been no global warming for 17 years.  Dr Pachauri is, if you don’t know, the leader of the Intergovernmental Panel on Climate Change (IPCC), a branch of the UN.  The IPCC has issued reports on climate change which conclude—- burning of fossil fuels releases CO2 causing a “dramatic” increase in global temperatures.  The IPCC documents have had widespread influence. For example, the US EPA successfully used these reports as the technical justification to declare CO2 a hazardous pollutant that needed to be regulated. The IPCC’s belief is that natural forces are inconsequential.
For the last 17 years, CO2 emissions resulting from fossil fuel burning have increased.  The measurement of atmospheric CO2 has climbed steadily over these 17 years and yet the global temperature has not risen.  Proving that the natural forces indeed are consequential.

Dr Evans: “Climate Change in 12 Minutes-The Skeptic’s Case”


Dr David Evans has made a youtube video titled “Climate Change in 12 Minutes-The Skeptic’s Case”.  The focus of this video is the “positive feedback” claimed by the greens which they claim amplifies the effect of CO2.   This positive feedback is used in all the green’s computer models.  These computer outputs are incompatible with the actual data. Air and ocean temperatures as well has the tropical hotspots do not agree with computer output. In fact, a negative feedback appears to exist that reduces, rather than amplify, the effect of CO2.
See Evan’s video by clicking here.
cbdakota

Extreme Weather A Non-Starter When Facts Are Examined


If you are alarmed by the forecasts of dreadful things that are going to happen because of global warming, there is good news. The good news is that since the beginning of the alarmist’s 25+ year campaign to frighten you, nearly all their forecasts have failed to come true. The media would do their readers and themselves a real service if they actually reviewed and published the global warming alarmist’s forecasts versus actual outcomes for temperature, hurricanes, sea level, etc..  But they don’t, so you get a new batch of dire forecasts from the same people who have yet to demonstrate they can make a forecast that ultimately matches reality.

Greenland’s Icesheet Melts In 12,000 Years


The lead from a posting by Chris Mooney is “Humans Have Already Set in Motion 69 Feet of Sea Level Rise”.  See Mother Jones, 30 January 2013.  Mooney uses information provided by Ohio State University glaciologist Jason Box that claims that Greenland’s glaciers are melting at an alarming rate. The chart from that posting is shown below: (click on charts to improve clarity)
 greenland-glaciers
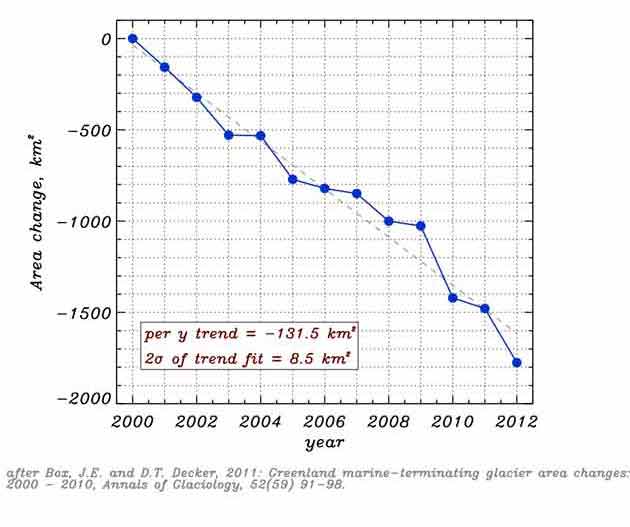
Chart from Mother Jones
You can read the figures telling that during the period 2000 through 2012 the rate of melt was 131.5 km²/year. Box says this is due to the increase of both CO2 and CH4 accumulation in the atmosphere.  Looking at the slope of the chart, one’s initial reaction is WOW, this must be serious.
However, Willis Eschenbach responses to the Mooney posting with “Chris Mooney’s Chartsmanship in the Service of Alarmism” on the WUWT website.  Eschenbach first determines the amount of Greenland ice:
“As usual, there are various estimates. The Physics Hypertextbook is great for this kind of thing because it gives a variety of estimates from various authors. They range from a low end of 1.7 million square kilometres to a high of 2.2 million square km. I’ll take an average of 1.9 million square km.”  
Then Eschenbach says:
“By the year 2100, if it continues losing ice at the rate Jason Box claims above, -131.5 km2 per year, the total ice area of Greenland will have gone from 1.90 million square km all the way down to … well, to two decimals of accuracy, by the year 2100 the ice will be down to 1.90 million square kilometres …”  
He adds that:
Assuming all that were true, at the current rate of -131.5 km2 of ice loss per year, Greenland will be ice-free fairly soon, in only … well … 1,900,000 km2 ice area / 131.5 km2 per year annual loss ≈ 14,500 years from now … “  
Eschenbach’s chart, below, shows how that would look on a real chart that is not trying give people the wrong impression:
effect-of-massive-ice-loss-on-greenland1
Chart from WUWT
I looked at it from a slightly different direction using the figures from Wikipedia.  Wiki says that the total volume of ice on Greenland is 683,751 miles³. Further they say that the melt rate in 2006 was 57  miles³/year and that the improved and reprocessed data between 2003 and 2008 was about 47  miles³/year.   Using the 57  miles³/year to be conservative would result in an ice free Greenland in 683,751 ÷ 57 = 11,996 years. Not the same as Eschenbach’s number but of no practical difference.  Do I think I know when Greenland’s ice sheet will melt if ever?  No, but neither do the “experts” that try to fool you into believing it will be in the near future.
Wiki also adds that if all of the Greenland ice were to melt it would raise the sea level 23.6 feet.   The 69 feet of Mooney’s posting requires both the Antarctic and Greenland ice sheets to completely melt.
So what do we make of this? If Mooney went so far as to calculate the amount of sea level rise due to total melting of the Antarctic he must have realized how long this would take at the current melt rates.  As an alarmist, he probably wants you to believe that the melt rate will escalate exponentially but I would guess he doesn’t have data to support that. So it is just more alarmist stuff that we have become (unfortunately) used to seeing.
I reviewed the Mother Jones article. I also looked at the comments.  At one point, a commenter reports Eschenbach’s posting.  Then the comments turned to bashing Eschenbach,  one calling him garbage.  Not once did anyone offer to refute Eschenbach numbers.  Eschenbach’s may not have a conferred degree in science or engineering but his mental abilities are noteworthy.  If you were going to the moon, and had only the choices of Eschenbach, or those leading alarmist lights Al Gore and/or Bill McKibben to do the math that would chart your way,  who would you pick?
cbdakota

Upward Spike In Global Temperature In January


The UAH satellite temperature readings for January show a lower tropospheric temperature anomoly of +0/51C.   This  is a large increase.  Dr Spencer, co-manager of the  system,  says he has double checked the results and finds them to be real, as opposed to a measurement error.  He suggest that the reason for such a large spike may be due to “ a temporary increase in convective heat transfer from the ocean to the atmosphere.” The UAH chart is shown below:

UAH_LT_1979_thru_Jan_2013_v5.5

cbdakota