
Solar Cycle 24 activity dropped off in February. Charts for sunspots and F10.7 cm radio flux follow:

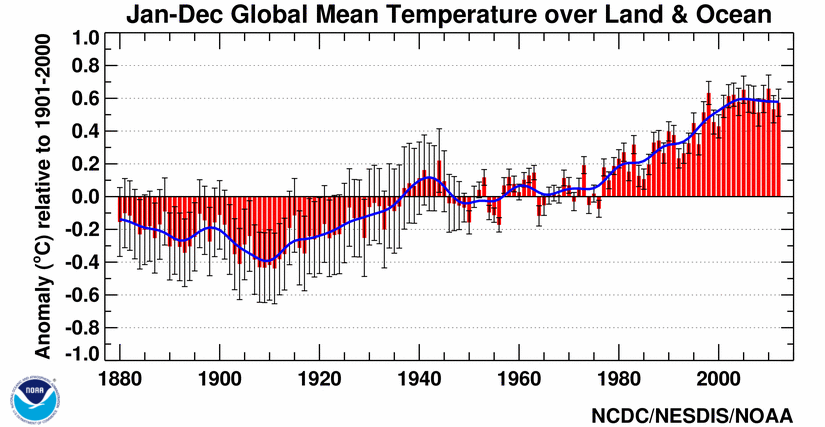
What is all this leading to? Colder, hotter, who knows? Does a less active Sun portend a cooling globe? In the past, when Solar Cycles were less active as indicated by very few Sunspots , the global temperature dropped.

The Maunder and Dalton Minimums were periods of cool global temperatures and these coincided with periods of low Sunspot counts. In recent times when global temperatures have been rising, that rise coincided with very active Solar Cycles as indicated by high Sunspot counts. Solar Cycle 23 is the last one shown in the above chart.
Examining the recent Solar Cycles (21, 22 and 23) it is clear that Solar Cycle 24 is significantly less active.


Recent Solar Cycles that more closely approximate the current Solar Cycle 24 are Cycle 10 (began 12/1885–ended 3/1867), Cycle 12 (began 12/1878–ended 3/1890), Cycle 13 (began 3/1890–ended 2/1902), Cycle 14 (began 2/1902–ended 8/1913), and Cycle 16 (began 8/1923–ended 9/1933). Probably Cycle 14 is most nearly the same as Cycle 24 to date. Check the dates of these low activity Solar Cycles and you will see a pretty good match with lower global temperatures.
Contrast the dates of since 4/1954 when Solar Cycle 19 began. Cycle 19 ended on 10/1964. Cycle 20 (began 10/64–ended 6/1976), Cycle 21 (began 6/1976–ended 9/1986), Cycle 22 (began 9/1986–ended 6/1996), and Cycle 23 (began 5/1996–ended 12/2008).
Another measure for use in comparison is the Maximum Smoothed Sunspot Number for Cycles of interest:
Cycle 10: 97, Cycle 12: 75, Cycle 13: 88, Cycle 14: 64, Cycle 16: 78, Cycle 19: 201, Cycle 20: 110, Cycle 21: 165, Cycle 22: 159, Cycle 23: 121. . If you look at the first chart in this posting you can see that the Monthly Smoothed Sunspot Number (the blue line) for Cycle 24 is about 65, so far. Using the Sunspot number as an indication of solar activity indicates that the recent Cycles are very much more active and they coincide with an apparent rise in global temperature
Nothing is exact when matching proxies with temperature, but the many years of Sunspot measurements seems unmatched by any other measurement.
cbdakota

Pingback: Solar Cycle 24 Update-June 2013 | Climate Change Sanity