
If you are alarmed by the forecasts of dreadful things that are going to happen because of global warming, there is good news. The good news is that since the beginning of the alarmist’s 25+ year campaign to frighten you, nearly all their forecasts have failed to come true. The media would do their readers and themselves a real service if they actually reviewed and published the global warming alarmist’s forecasts versus actual outcomes for temperature, hurricanes, sea level, etc.. But they don’t, so you get a new batch of dire forecasts from the same people who have yet to demonstrate they can make a forecast that ultimately matches reality.
Despite the alarmist’s forecast to the contrary, global temperature has not increased in the last 16 years. Furthermore they are aware the globe is not warming, so they have switched their focus to a new theory of weather extremes caused by global warming. Warming is not happening but warming is causing weather extremes?
The difference between skeptics and warmers is that skeptics believe in actual data, while warmers believe in computer forecasts and ignore or say that the data must be wrong if it doesn’t agree with computer output.
Below I have lifted an entire posting by C3 titled “Extreme Violent Storms On Decline in U.S.-Rapid CO2 Growth Has Minimal Climate Impact”.
Anti-science, partisan scientists have done severe damage to the reputations and public trust of most major American science institutions and universities – an example of progressive Democrat scientists pushing an anti-science agenda is the claim that atmospheric CO2 growth would cause accelerated, dangerous global temperature warming, extreme climate change and violent storm disasters…it hasn’t happened
U.S. scientists have never been so consistently wrong, while so vehemently denying they have been wrong, despite all the objective empirical evidence that clearly shows they have been wrong – partisanship science run amok.
Case in point: climate scientists’ claims that higher CO2 levels cause accelerated warming and dangerous climate change, resulting in more severe and frequent weather disasters, per their C-AGW hypothesis.

• ….this chart is a plot of U.S. monthly temperatures since 1895 and global atmospheric CO2 levels. As the chart depicts, CO2 levels have had spectacular growth but U.S. temperatures exhibit no trait of the long predicted rapid acceleration (note the rather stable red curve representing the 5-year moving average).
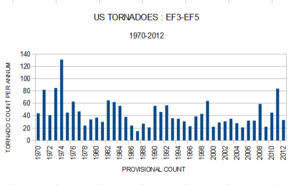
• …this chart shows the the number of extreme violent tornadoes on the decline since the 1970’s, contrary to “consensus” science forecasts.

•… This graph plots the ‘power dissipation’ of hurricanes that made landfall on U.S. coasts, which has also declined over the last few years, revealing no trend up/down since 1900. Note the reduction of this metric for 2012, which government scientists have stated to be the warmest year ever for the U.S.
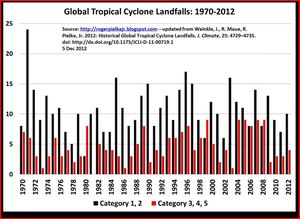
• Finally, the lack of a robust CO2 impact on global weather events is depicted in this chart. Clearly, there has been no increase in the frequency of global cyclones. (And, global temperatures have also done squat versus the anti-science claims of partisan Democrat scientists.)
Conclusions: Climate science has become clown-science due to the politicization by left-wing ideologues. Atmospheric CO2 levels are not a primary driver of global warming, nor climate change/violent storms. Btw, that’s not to say that CO2 has zero influence.
You might want to go to the C3 site as I have been unsuccessful in making the charts more legible
cbdakota

The confusion over CC is that the problem is due to a net reduction in the number of African Easterly Waves (AEWs) that act as parasols once their cloud layer is pullled westward over the Equitorial Atlantic. Less cloud mean an additional 5kwh/m2/day is absorbed by the sea surface. Scrutiny of this subject area is very much verboten since it provides an accurate and unconfortable explination for CC. The maturation of these AEWs is much dependent upon rainfall on the Ethopian Plateau, which is inturn dependent upon air pressure in NE Africa. This latter point has been, in the historical context, altered by the man made efforts to control the Nile flood, particularly since 1964, though the effects of this Ethopian rainfall variability can be scrolled back to 1902 with the opening of the Original Nile dam at Aswan (to semi control the annual Nile Flood). Like it or not, this is what is happening.