Category Archives: Storms/hurricanes

A Complete List Of Things Caused By Global Warming


Many religions have a devil that is the source of all evil. The Church of Catastrophic Global Warming (CCGW) has devils and they are the human race with the exception of Al Gore, and his fellow travelers, of course. And those global-warming-vector-172887devils wield a terrible power—global warming which is the cause of all things evil. For example, President Obama (1) (2), the previously named Al Gore (3), Prince Charles (4), Bernie Sanders (5) and others have told us that, directly or indirectly, global warming is causing the terrorism and unrest in the world. And that it will get worse. Unless, and for sure, the enlightened are allowed to lead us away from our wicked path.

Fortunately, our President struck a powerful blow to the terrorist in Paris by the mere fact that a COP 21 meeting was convened. And that meeting is said to be the last chance to prevent the terrorist from taking over.

Continue reading

COP21: Dreams From My (Father?) Climate Computer Models


Data dominates the skeptic’s view of the state of the globe’s temperature and where that temperature may be heading. The climate computer models dominate the warmers view. Temperature is at the heart of the global warming issue in that just about every other indicator is a function of the temperature. For example, sea level change is the product of melting ice at the South Pole and Greenland along with the lesser masses of ice in the high elevations of the mountain ranges. Rainfall, and its shadow drought are said to be forced by changes in the temperature. Higher ocean temperatures, we are assured, breed the hurricanes and typhoons. So this posting will focus on global temperatures.

First it would be well to try to understand the past. Ice core analyses from the Antarctica were used to reconstruct global temperatures for the last 420,000 years. Figure 2 below, from climate4you.com illustrates the temperature for that period of time:

VostokTemp0-420000 BP-2

Fig.2. Reconstructed global temperature over the past 420,000 years based on the Vostok ice core from the Antarctica (Petit et al. 2001). The record spans over four glacial periods and five interglacials, including the present. The horizontal line indicates the modern temperature.

From climate4you.com comes the following discussion: “The present interglacial period (the Holocene) is seen to the right (red square). The preceding four interglacials are seen at about 125,000, 280,000, 325,000 and 415,000 years before now, with the longer glacial periods in between. All four previous interglacials are seen to be warmer (1-3°C) than the present. The typical length of a glacial period is about 100,000 years, while an interglacial period typical lasts for about 10-15,000 years. The present interglacial period has now lasted about 11,600 years.

Continue reading

Social Cost Of Carbon–The Administration’s New Way To Justify Regulations


The Obama administration has instituted new criteria for supporting their climate change regulations. It is called the Social Cost of Carbon (SCC).   The eventual cost of an increase in atmospheric CO2 is calculated for each regulation. corncropUnknownThe calculation is based upon their model’s forecasts of temperature, sea level, storms, droughts, etc. All the bad things they believe will happen if the rise of atmospheric CO2 is not stopped. You can be certain that each regulation could prevent millions, perhaps billions, of dollars damage according to their SCC calculation.

The SCC calculations use several discount rates that most rational economist would say were not germane. SSC presumes that the next generations will not have more knowledge and money to adapt to what ever actually happens. For example at the turn of the last century, do you think the forecasters would have come up with airplanes, nuclear energy, penicillin, satellites, for several example of things that have made enormous changes? And the many people that would be lifted out of poverty and provided a much-improved life?

Continue reading

What US Counties Are Frequently Hit By Hurricanes? See Charts To Find Out.


It is fitting that this posting, as well as the two preceding, be about US hurricanes as this is the time for them to get generated off the coast of Africa and begin their journey to the US. The following charts show the US shore line, by county, along the Gulf of Mexico and the Atlantic Ocean and how many hurricanes have made landfall in those counties for the period of 1900 to 2010.

Beginning with chart 1 along the Gulf Coast:

huricanestrikes1fb68b187-c115-40e2-a295-3ac3bce920f7The  scale on the right shows the range of strikes from 0 to 26+.

Chart 2 along the  Eastern Gulf coast around to the Southern Atlantic Coast

f5cc3e02-39c4-45ce-b7f9-f8ef9d9d7f34

Chart 3 goes the South East Atlantic coast.

1b0aeafc-8124-4415-9d1f-0b90b15aaf21

Chart 4 shows Mid-Atlantic coast

9b4ac7f4-980f-46f6-9ad0-275d741ffd68

Chart 5 shows the Northeast coast

f645eafe-258d-48e0-9f4d-96d7bfd60732

The charts are all courtesy of Weather.com

Some thoughts.  Perhaps  you could play the odds and say I can build along this coast line because hurricanes seldom strike here. One of my friends grew up on the Rhode Island/Connecticut border (see chart 5) and he tells of the massive hurricane that struck there in 1938.  Chart 5 counties do not get pummeled like the Gulf coast, Florida on the Atlantic and the Gulf sides, and the northeastern part of North Carolina Chart 3).  Anyway, I would not bet the farm based upon these charts.

When you are in the possible path of a hurricane,  things can get pretty uncomfortable.  No need tell you-all that, that live in counties frequently threatened. My first one was in Beaumont Tx.  At the last moment it veered west toward the Winnie-Anahuac area and did not make to much of an impact on the Neches River area.  In 2005 I worked with my son rehabbing his Tampa house that he wanted to sell.  A hurricane was on its way and the exact landfall point was still being guessed at.  I was told by the natives that Tampa almost never got hit by hurricanes.  That hurricane was category 3 “Wilma”.  Fortunately Wilma made land fall south of Tampa and none of the rehabbing work was ruined.

Lets hope that no big one come in this year.

cbdakota

No Category 3 Hurricanes Making US Landfall In Nearly 10 Years.


If by October 24 this year no category 3 or higher hurricane has made landfall in the USA, it will be ten years since the last major hurricane did so. Major hurricanes are those designated category 3 or higher.

Hurricane Wilma was the last major hurricane (category three) to make landfall in the United States on October 24, 2005. Wilma, carried winds of 120MPH, when it came ashore in the southwestern coast of Florida. Katrina, also a category 3 hurricane, preceded Wilma having come ashore in the Gulf Coast on August 29, 2005.

The US uses the Saffir-Simpson hurricane intensity scale to rate the potential damage/danger that the storm brings.

Cate Damage Windspeed, MPH Windspeed, M/S
1 Minimal 74-95 33-42
2 Moderate 96-110 43-49
3 Extensive 111-129 50-58
4 Extreme 130-156 59-69
5 Cata’rophic Greater than 156 Greater than 69

If conditions are just right, tropical storms like Sandy that came ashore in sandy-pier-rollerc_2384216kAtlantic City on October 29, 2005 can cause enormous damage. Sandy dropped over 11 inches of rain on Atlantic City.  Associated storm surges played havoc along the coastline and into the New York Harbor area where water flooded sections of New York City.   Some storms like Sandy, said to have caused damage estimated to be more than $36 billion, sometimes fight above their weight class.   This usually occurs where there are much building and settlement along the coast.

“Man-made global warming” is forecast to make hurricanes become more frequent and more dangerous.   Although it appears that the correlation between man-made global warming and hurricanes is some what tenuous, that has not stopped those who choose “alarm” over science to shout how bad it is and how bad it will be.

And now for some forecasts by the alarmists from a posting on Fabius Maximus.com. :   “Since Katrina, climate activists have beat a steady drumbeat warning of doom.

See ten even more outlandish predictions from the big 3 networks.

Some thoughts. Hurricanes seem to have a cycle of sorts, as shown in my previous posting. So, category 3 hurricanes may make a comeback at any time. But if increased global temperature is the reason for more hurricanes, perhaps the current pause and the lack of a lot of hurricanes or any major hurricanes prove the global temperatures have not been rising. One has to wonder if the real Man– made global temperature rise is the result of the manipulation of the raw temperature readings. Or at least a lot of it.

cbdakota


Hurricanes Typically Peak in Early September, But At The Moment, There Are No Active Hurricanes.


“As we reach the historical peak of the Atlantic hurricane season, there are no active hurricanes in the Atlantic or the Pacific basins. If fact, Wednesday afternoon marked the first time that we had no active hurricanes in the Atlantic or the Pacific since Aug. 26, according to Phil Klotzbach of Colorado State University and blogger for wunderground.com.“  The preceding quote is from a Weather.com posting on 10 September titled “There Are No Active Hurricanes in Atlantic or Pacific as Peak of the Season Arrives

The posting says that normally by this time, we would have had 3 hurricanes but so far we have had but one—Hurricane Danny that existed from 20-22 August.   The postings adds:” When looking at long-term averages of hurricanes and tropical storms in the Atlantic Basin, there is a broad maximum from late August through September. However, within this broader period is a peak that typically occurs around Sept. 10 or 11, depending on what data is used for the calculation.

The following chart illustrates the peak hurricane season.

peaks-by-typehuricame

Continue reading

Flashback To ABC 2009 Special On Climate Change–See Their 2015 Predictions.


gwpredictions_cartoonThanks to the Daily Caller we can enter into the minds of the radical warmers and their surrogates, the national media. The Daily Caller posted “Flashback: ABC News Envisioned Apocalyptic 2015 Triggered By Climate Change”. Using the “best” minds on the planet to graphically display the terror that climate change will cause, ABC ran a special in 2009 called “Earth 2100 “. The special follows a baby girl born in 2009 through her life span with stops along the way to describe how the planet was suffering through the effects of climate change.   The first stop was 2015. You may wonder how you are missing all of these tragic happenings that the warmer scientist say would happen in 2015. But it is more likely that being a rational human, you will realize, once again, how far from the truth the great prognosticators are. These people have not changed since 2009. They just keep restarting their “end of the earth” smoke and mirrors” narratives, ignoring the need to apologize for how bad their last prediction was.

The Daily Caller quotes from the special:

“ABC News correspondent Bob Woodruff says the show “puts participants in the future and asks them to report back about what it is like to live in this future world. The first stop is the year 2015.”  A Harvard University professor says, “We’re going to see more floods, more droughts, more wildfires.”  Other voices can be heard saying that “Flames cover hundreds of square mile” and “We expect more intense hurricanes.” Another voice says, “Well, how warm is it going to get? How much will sea level rise? We don’t know really know where the end is.”


Continue reading

Green’s Say That Computer Projections Are Just Basic Physics- Ok, But They Only Use A Very Small Portion Of The Physics


Basic physics?   Far from it. The greens are trying to sell this. A recent posting on this site has a video in which Carol Andress of the  Environmental Defense Fund uses this line in a debate with Marc Morano.   Ms Andress seems particularly ill informed so she had to resort to this line of “Just Basic Physics”.

Doug Hoffman on his blog site, The Resilient Earth, had this so say about Basic Physics:”

It should come as no surprise that General Circulation Models (GCM), the basis for more comprehensive computer climate models, are based on differential equations, as are weather forecasting models and hurricane path prediction models. As we all know, weather forecasts are not very accurate, only giving a general idea of conditions a few days out, and hurricane models generally cannot predict the point of landfall until just before a storm comes ashore. But GCMs are different from weather programs even though they use some of the same equations. That is a refrain often repeated by supercilious climate modelers. It is true that climate models also include extra factors like sea ice models and “parametrization” for things like clouds. Unfortunately for them their models are not immune to the laws of computation that make their short term cousins grow more and more inaccurate over time.”

Continue reading

Texas Flooding and CO2 Emissions.


James Spann is an AMS certified meteorologist and Host of WeatherBrains.     His views on the connection between man-made global warming and the severe
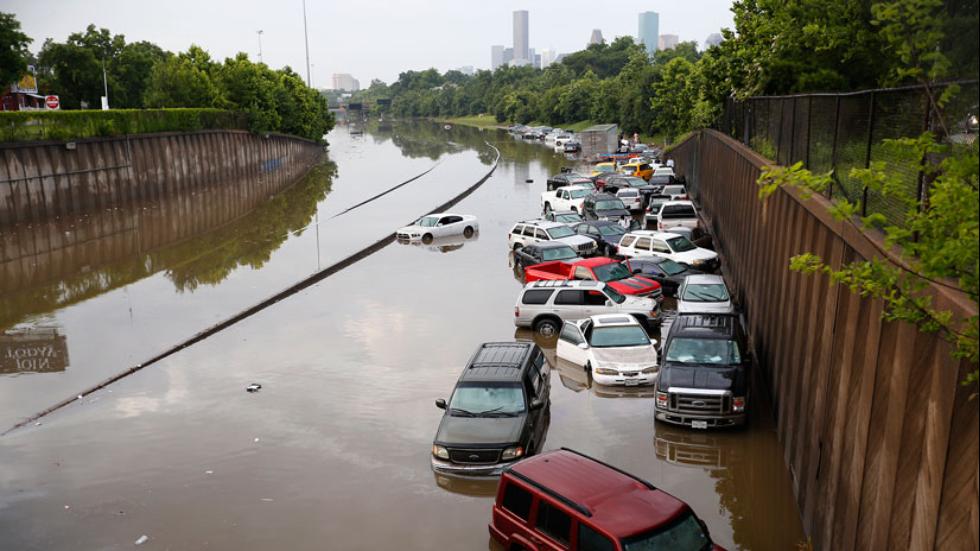
Houston Post Photo

Houston Post Photo

flooding that parts of Texas have recently experienced were posted in a Medium Corporation blog, titled “The Age Of Disinformation”.  I have selected several things he has to say :

“No doubt national news media outlets are out of control when it comes to weather coverage, and their idiotic claims find their way to us on a daily basis. The Houston flooding is a great example. We are being told this is “unprecedented”… Houston is “under water”… and it is due to manmade global warming.

Yes, the flooding in Houston yesterday was severe, and a serious threat to life and property. A genuine weather disaster that has brought on suffering.

But, no, this was not “unprecedented”. Flooding from Tropical Storm Allison in 2001 was more widespread, and flood waters were deeper.”

“Flood events in 2009, 2006, 1998, 1994, 1989, 1983, and 1979 brought higher water levels to most of Houston, and there were many very serious flood events before the 1970s.”

The National Oceanic and Atmospheric Administration (NOAA) reports that the Texas record 24-hour rainfall occurred July25 and 26, 1976 in Alvin, Texas. The rainfall amount was 42inches.

I experienced a serious flood event in the 1970s in Beaumont, Texas. One day heavy rain began to fall in North East Texas, supercharging the Neches River. By the time the rain arrived in South East Texas, where Beaumont is sited, the Neches River was running over its banks. Adding to that, Beaumont got roughly 10 inches of rain in a 24-hour period . When the rain stopped, sightseers in canoes were paddling down the street in front of my house.

One more lifting from Mr. Spann’s posting:

“Back to my point… many professional meteorologists feel like we are fighting a losing battle when it comes to national media and social media hype and disinformation. They will be sure to let you know that weather events they are reporting on are “unprecedented”, there are “millions and millions in the path”, it is caused by a “monster storm”, and “the worst is yet to come” since these events are becoming more “frequent”.

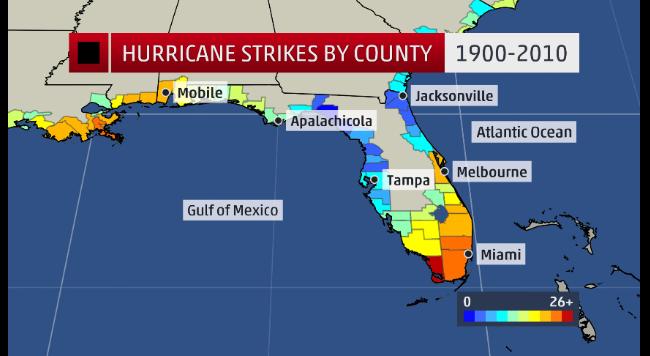
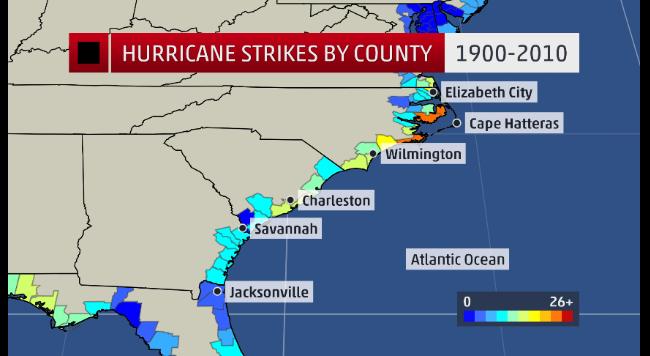
You will never hear about the low tornado count in recent years, the lack of major hurricane landfalls on U.S. coasts over the past 10 years, or the low number of wildfires this year. It doesn’t fit their story. But, never let facts get in the way of a good story…. there will ALWAYS be a heat wave, flood, wildfire, tornado, tyhpoon, cold wave, and snow storm somewhere. And, trust me, they will find them, and it will probably lead their newscasts. But, users beware…”

cbdakota


Skeptic Reference Sources—1350+ Peer-Reviewed Papers


This is the second posting of skeptic reference sources. This time it is “1350+ Peer- Reviewed Papers Supporting Skeptic Arguments Against ACC/AGW Alarmism”.   The papers have been sorted by categories to Cooling_is_the_New_Warmingmake the desired documents easily located. It is interesting that PopularTechnology.net supplied “Rebuttals to Criticisms” in the beginning. These are also a leg-up for you in discussions with warmers.

Click here to enter the PopularTechnology.net website.

cbdakota