Category Archives: Interglacial periods

Biden Wants to Pay Climate Reparations. I Hope His Handlers Say He Really Did Not Mean It.


From Politico’s bog: “New U.S. message on climate change: Make China pay.”  Is our President out of his mind— wait, wait, I guess that is already answered.  He says the US will pay reparations if China does.  

First of all, why would he think the US taxpayer should pay reparations. Why not ask the underdeveloped nations to pay reparations for our medical discoveries, our thousands of inventions that have made their life easier, our pitching in to save starving people that routinely occur in Africa, etc.

Moreover, reparations are hard to get right. China and India, combined, are emitting more CO2 than the rest of the world. Every nation in the world has been using some level of fossil fuel. Would we get to reduce our reparations payments for that?

Secondly, China will not do reparations. And thank God for that because if they did, Biden then would have us hoisted by his own petard.

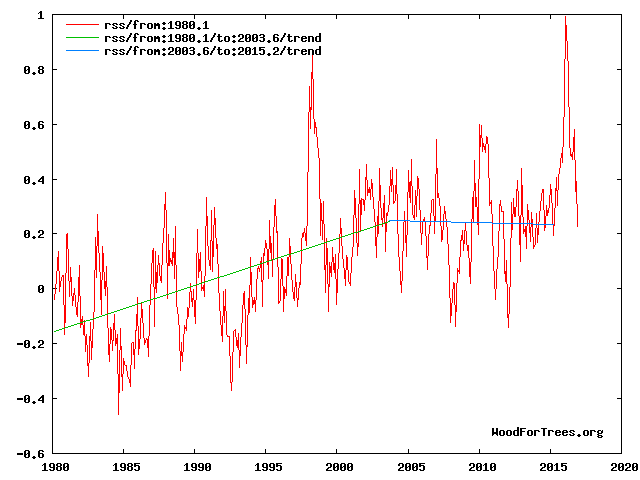
And the third reason is that there is no crisis.  It is an invention by the alarmists and the Great Reset group. Is the world warming?  Yes, because the UAH satellite global temperature measurements tell me that.  

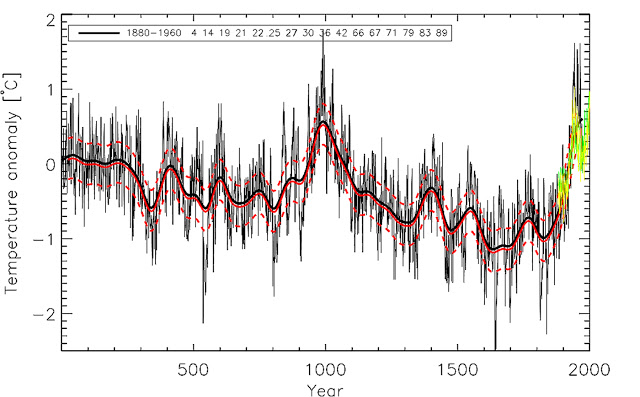
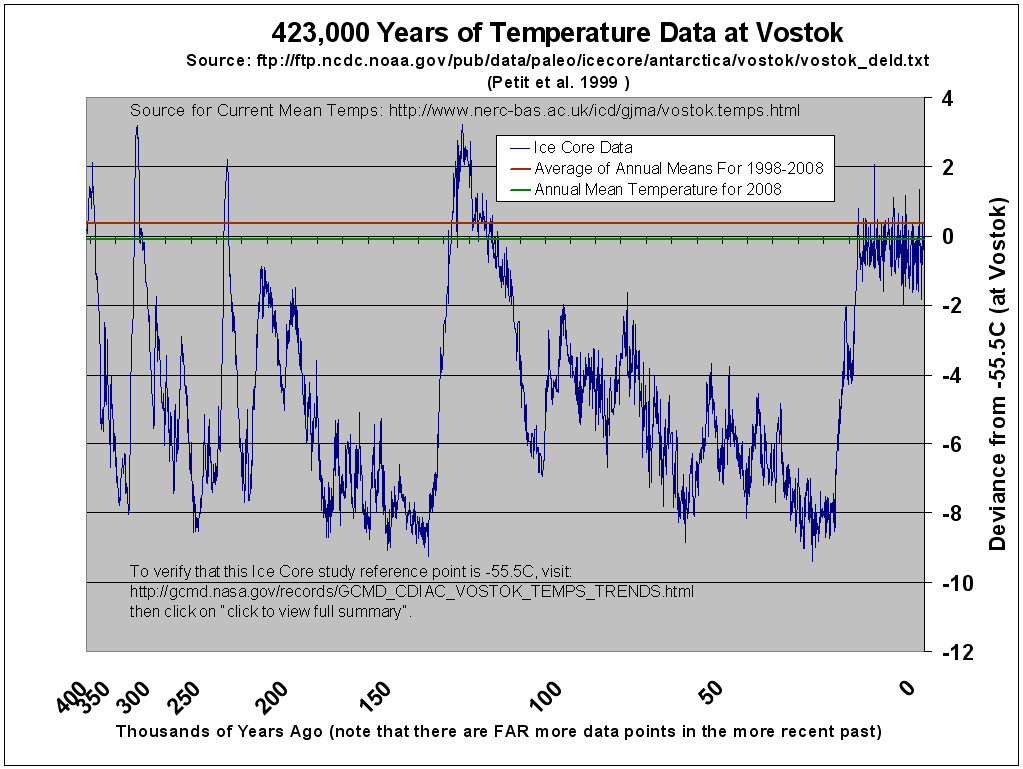
For at least the last million years, the globe cycles, roughly, every 100,000 years between cold and warm. Does that without any SUVs on the road, by the way.

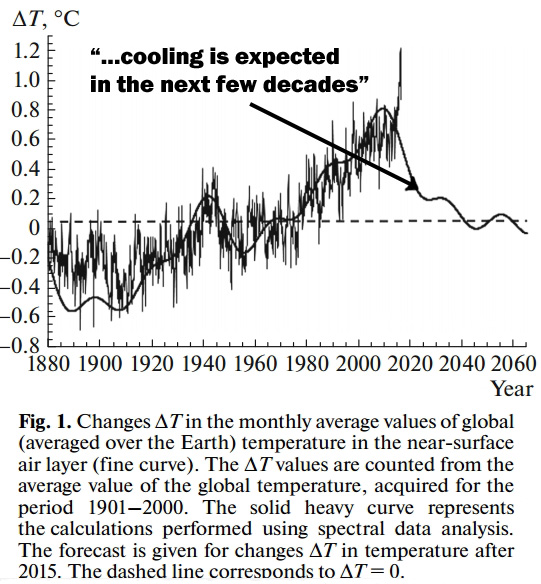
But I do not believe the alarmist’s computer forecasts of future temperatures. Those forecasts have always exceeded the actual global temperatures. The alarmists recognize this. That is why they changed the narrative from “global warming” to “climate change”. But still, they use those faulty forecasts.

And how do they know that we are really, really going to be sorry if, since the year 1890 until now the global temperature will have increased more than 1.5C. Their ability to make accurate predictions has been non-existent. Why should we believe this one? 

So, the answer is too back off global catastrophe predictions and focus on doing adaptation when and if necessary.  In the meantime, the Earth will continue to green because of the CO2 in the atmosphere.

cbdakota

SUN CAUSES GLOBAL WARMING, NOT CO2


I usually summarize topics gleaned from postings. But this one is written with a lot of interconnections from one of his 29 bullet points to another bullet point that segmenting it dilutes his reasoning.  The source of this information  is a posting, 11 March 2020,  by Dr. Roger Higgs on the Electroverse web site.

29 BULLET POINTS PROVING THE SUN CAUSES GLOBAL WARMING, NOT CO2: BY A GEOLOGIST, FOR A CHANGE (DR ROGER HIGGS)

MARCH 11, 2020

Dr Roger Higgs, Geoclastica Ltd, Technical Note 2019-11, 6th April 2019, amended 7th March 2020 on ResearchGate (LINK HERE).

We urgently need to expose the ‘CO2 = pollutant’ fallacy being forced upon your children, grandchildren, nephews and nieces by schools, universities, governments and mainstream media worldwide, and to denounce it in scrupulously truthful terms easily understood by the public, including those youngsters themselves.

Here are the 29 bullet points proving CO2’s innocence:

1) The IPCC (United Nations Intergovernmental Panel on Climate Change) has no geologists among the hundreds of authors of its last major report (2013-14) and at most 1 geologist in the next report (due 2022; see my Technical Note 2019-10). Thus IPCC focuses on only the last 150 years (since thermometer records began, ~1850), yet Earth is 30 million (sic) times older, 4.5 billion years! Geologists know that Earth has warmed and cooled throughout this time. Climate change is perfectly normal.

2) The IPCC’s very existence relies on public belief in man-made- or ‘anthropogenic’ global warming (AGW) by carbon dioxide (CO2) emission. IPCC authors, mostly government and university researchers, are biased by strong vested interests in AGW (publications; continuance of salaries; research grants). Similarly, universities have sacrificed their impartiality by hosting institutes mandated to confirm and act on AGW, e.g. Grantham Institute (Imperial College), Tyndall Centre.

3) The claimed ‘97% consensus among scientists’ that AGW exists is a deception. It refers in fact to polls of recent publications by ‘climate scientists’, i.e. atmospheric scientists, lacking deep-time perspective (Bullet 1), whose numbers opportunistically exploded in the post-1990 AGW boom, creating a strong incentive for bias (Bullet 2).

4) No educated person ‘denies’ global warming: it has been measured (Bullet 11). ‘Global-warming denier’ and ‘Climate-change skeptic’ are deceitful terms for man-made-global-warming doubters and deniers (most of the world’s scientists?).

5) CO2 is a ‘greenhouse gas’. But, as CO2 rises, its theoretical heat-trapping ability sharply declines, already 67% ‘used up’ at 100 parts per million (ppm) CO2, 84% at 300 ppm (NB 275 ppm when industrial CO2 output began; Bullet 8), 87% at 400 ppm (today 415 ppm) and >99% at 1000 ppm. Moreover, Climate Sensitivity (CS), the warming due to doubling CO2, is guesswork. IPCC ‘estimates’ CS from climate models (circular reasoning) as probably between 1.5 and 4.5 (300% contrast!), but models are defective (Bullet 6). In reality CS might be very near zero, perhaps explaining why up to 7,000 ppm in Phanerozoic time (Bullet 7) did not cause ‘runaway’ warming.

6) Climate models (by climate scientists; Bullet 3) are so full of assumptions as to be useless or highly misleading, e.g. forecast 1995-2015 warming turned out to be 2 to 3 times too high. Bullet 19 gives another drastic failure. Even Wiki (2019) admits: “Each model simulation has a different guess at processes that scientist don’t understand sufficiently well”. Models dismiss the sun’s fluctuations and omit the multi-decade delay between these and resulting warming or cooling. This time-lag, due to ocean thermal inertia (mixing-time), is grossly underestimated by IPCC (Bullets 21, 22).

Continue reading

$535 Trillion To Remove CO2 From The Atmosphere


James Hansen, et al have issued a study titled “Young people’s burden: requirement of negative CO2 emissions.  The authors say that unless CO2 reduction begins right away and aggressively the next generation and the one after that will have to spend a $535 trillion to make Earth habitable.  This $535 trillion is not the $trillions that the warmers want to spend to bring CO2 emissions to a net zero by 2050 or 2100 (depending on which warmer group is talking).  The $535 trillion is for removing atmospheric CO2.

The Hansen et al study says the global temperature will melt glaciers and consequently sea level will rise 6 to 9 meters (approximately 20 to 30 feet). Using models, the study determined a temperature rise due to a rise in atmospheric CO2 and then determined that the glaciers will melt which is the big threat. The authors conclude that the current interglacial period would match the Eemian interglacial period which occurred about 125,000 years ago.   That period is believed to have experienced a 6 to 9-meter sea level rise.  The chart below, from Wikipedia shows the current interglacial period, the Holocene and the Eemian and other interglacial periods. Note that the scale is more or less logarithmic and not linear.

A tangential observation—this chart shows that the Globe’s temperature has been much hotter than at present. Also, the Pleistocene running from about 1 million years ago to about 20 thousand years ago shows glacial and interglacial periods.  The peak temperatures are the time of the interglacial and the rest are the times when some part of Earth was covered by advancing glaciers.  Were there SUVs and fossil fuel powered plants putting out CO2 that caused the glaciers to melt?

Continue reading

A Forecast Of Global Cooing For The Remainder Of The Century


Dr. Norman Page believes that natural cycles of 60 and 1,000 years are the principle drivers of Global climate.  He has recently published a study relating his beliefs.  From that study  “The coming cooling: usefully accurate forecasting for policy makers” I will begin with one of his charts:

Here Dr. Page compares forecasts by the IPCC, another forecaster S. Akasofu and his own.  The IPCC  forecast which you have probably seen many time predicts a global temperature rise of 4C by 2100.  Akasofu is much below the IPCC forecast at about 1C by 2100.  Page’s forecast is for a reduction in global temperature by the year 2100.

Dr Page’s Abstract to this paper lays out the big picture:

“ABSTRACT

This paper argues that the methods used by the establishment climate science community are not fit for purpose and that a new forecasting paradigm should be adopted. Earth’s climate is the result of resonances and beats between various quasi-cyclic processes of varying wavelengths. It is not possible to forecast the future unless we have a good understanding of where the earth is in time in relation to the current phases of those different interacting natural quasi periodicities. Evidence is presented specifying the timing and amplitude of the natural 60+/- year and, more importantly, 1,000 year periodicities (observed emergent behaviors) that are so obvious in the temperature record. Data related to the solar climate driver is discussed and the solar cycle 22 low in the neutron count (high solar activity) in 1991 is identified as a solar activity millennial peak and  correlated with the millennial peak -inversion point – in the RSS temperature trend in about 2004. The cyclic trends are projected forward and predict a probable general temperature decline in the coming decades and centuries. Estimates of the timing and amplitude of the coming cooling are made. If the real climate outcomes follow a trend which approaches the near term forecasts of this working hypothesis, the divergence between the IPCC forecasts and those projected by this paper will be so large by 2021 as to make the current, supposedly actionable, level of confidence in the IPCC forecasts untenable.”

The four basic trends in play here according to Page:

“To summarize, the forecasts which follow rely on four basic working hypotheses. First, the solar millennial activity cycle peaked in 1991+/- as seen in Fig 10 in the Oulu neutron count. Second, the corresponding millennial temperature cycle peaked in the RSS data at about 2004-Fig. 4.Third, the 60 year temperature cycle peaked at about the same time and fourth, Ockham’s razor would suggest that the simplest working hypothesis currently available, based on the weight of all the data, is that the trends from the 990 Millennial peak to the 2004 Millennial cycle peak seen in Figs 3 and 4 will, in general, repeat from 2004 to 3004.”

Those charts are as follows:

Figure 10 has had some enhancements so I am showing you that chart.  Note how the cosmic ray theory/clouds cooling are illustrated.


Fig 4. RSS trends showing the millennial cycle temperature peak at about 2003.6 (14)

Figure 4 illustrates the working hypothesis that for this RSS time series the peak of the Millennial cycle, a very important “golden spike”, can be designated at 2003.6.


Fig.3 Reconstruction of the extra-tropical NH mean temperature Christiansen and Ljungqvist 2012. (9) (The red line is the 50 year moving average.)

Good view of the 1000 year cycle that Page refers to.

Dr. Page also predicts the next Little Ice Age  will likely occur about 2640+/-

Page’s  study is about 15 pages long but is definitely  worth your time to read it.

cbdakota

Russian Scientists Suggest Global Temperatures Will Drop


There are two recent papers indicating that global cooling will begin soon.    Both studies believe that more cosmic rays in the Earth’s atmosphere will be responsible for reduced global temperatures. The cosmic rays produce lower level clouds which reduce temperatures by reflecting incoming solar radiation back into space.


“Cosmic Rays, Solar Activity, and Changes in the Earth’ Climate is by a group of Russian scientists led by Y.I. Stozhkov.  The Paper considers Milankovich theory on global temperatures but dismiss it for this study saying that “…… (Milankovitch) changes happen on a long -term scales and are unlikely to be related to the contemporary process of global warming.”  The three orbital factors in this theory are:

  • the Earth’s orbital eccentricity which changes or 100,000 to 400,000 years
  • the tilt angle of the Earth’s rotational axis which has about a 41,000-year cycle
  • the precession angle changes with periods of 19,000 to 26,000 years

They considered solar luminosity but feel that the changes in total solar irradiation (TSI) are too small to alter average global temperature by no more than 0.05C.

The study also looked at the cosmic  rays.  The team compiled  monthly Δ T* data for the period from 1880 to early 2016.  Using that data, they made a spectral analysis for the same period.  The result is shown on the chart below:     (*Δ T often called the “temperature anomaly”.)

The team looked at cosmic rays versus Δ T and found a relationship.  Cloud formation is a function of cosmic ray presence in the Earth’s atmosphere. That is illustrated from the team’s chart shown below:

The team interestingly does not attribute cosmic ray intensity in the Earth’s atmosphere to solar activity.  The study reports:

“Another influence on the Earth’s climate is solar activity; the main period of its variations is ≅11 years. Despite numerous attempts to find a connection between different solar activity indices and temporal variations in delta T values, no such link has been firmly established.”

Their contribution is —-an increase in cosmic rays in the Earth’s atmosphere will lower global temperature. Thus, leaving the reason the cosmic rays increase or decrease as an unknown. Their Figure 1 seems to suggest they see a drop in global temperature beginning soon and lasting until at least 2060.


The second study will be posted next.

cbdakota

NorthWest Passage Still Not Open–Someone Call Al Gore And Tell Him


Russian ice breakers escorted cargo ships from Archangel to Pervek on an Arctic Ocean trip beginning on 14 December 2016 and arriving on 7 January 2017.  It was thought that the temperature and the condition of the ice were such that they could make the return trip.  But they did not get far before they were stopped by very thick ice.  They had aerial surveys made of the of the route back to Archangel and concluded that it would not be passable for the cargo ships.  The map of the area of the Arctic Ocean were the ship traveled is shown below:

arctic-icebreakersMap courtesy of The Siberian Times. 

From The Siberian Times comes this quote:

But now a spokesman for Rosmorport has announced the icebreakers will delay a return until probably May or early June. ‘The vessels will remain for the winter because of the very heavy severe ice conditions,’ he said.

All the vessel got out of the ice, and three of them – Captain Dranitsyn and the two cargo ships – returned to Pevek. The Admiral Makarov moved further east to continue working for Rosmorport in clearing sea routes.

Officials said the icebreakers could have gone further through the ice but there was ‘a very high risk of significant damage’ to the supply ships, and it was decided to postpone the return to Archangelsk.”

 I guess the North-West Passage is still not open for business.  Hard to believe because that famous guru, Al Gore said the Arctic Ocean would be ice free by 2010.  And isn’t he the winner of the Nobel Peace Prize for such prized predictions as that one.

As an aside, I often forget how small the distance between Russia and the United States (State of Alaska) is.  During the last glacial era, that point is said to be the “land bridge” that began the population of North America.

cbdakota

Denying The Climate Catastrophe:4A Actual Temperature Data (Warren Meyers Essay)


I am rebloging Warren Meyers essay that says we should deny the climate catastrophe that the warmers predict.  This is a long chapter showing what the actual global temperature data really is.  There has been a lot of adjusting the data on the part of the warmers who, with the exception of the UAH satellite data, control the system.  This is the 4th chapter of his essay.   He titles this one as 4A and has a 4B which reviews the troubles with the surface temperature record.  He says the reader can skip 4B, so I may give just a reference to those who want read it can do so.

cbdakota


In our last chapter, we ended a discussion on theoretical future warming rates by saying that no amount of computer modelling was going to help us choose between various temperature sensitivities and thus warming rates.  Only observational data was going to help us determine how the Earth actually responds to increasing CO2 in the atmosphere.  So in this chapter we turn to the next part of our framework, which is our observations of Earth’s temperatures, which is among the data we might use to support or falsify the theory of catastrophic man-made global warming.

Continue reading

Ice Cores and Global Climate Part 3–CO2 Follows Temperature


The previous posting showed that the temperatures in the past have exceeded the current temperature rise giving lie to the assertion that the year 2015 was the hottest year ever.

A cursory examination indicates that the warmers do not dispute the temperature records derived from the ice cores. But looking at the relationship of carbon dioxide (CO2) and temperature rise and fall as indicated by the ice core record, some warmers do not agree with the idea that CO2 follows temperature rise and fall rather than leads. First a look at graphical representations of the ice core data:

vostokwithco26a010536b58035970c0120a62f922e970c

To understand this chart, remember, time flow to the right from the past to the present. When examining the blue, temperature, and the red, CO2, the line to the right is later. For example, look at the blue and the red line beginning about 140,000 years ago. The red line is very close to the blue line but it is to the right of the blue line meaning that it is lagging the rise in temperature shown by the blue line.  The difference is more apparent if you click on the chart to enlarge it.   Note that the thickness of a line on this chart may be the equivalent of 1,000years. The creators of this chart meant to show the CO2 lagging the temperature because that is what their data told them.

Continue reading

Ice Cores and Global Climate Part 2. Are Current Temperatures Highest Ever?


As discussed in the previous posting, examination of ice cores can provide high quality data about the Earth’s climate from thousands of years in the past.    Antarctica’s ice cores cannot be surpassed for the longest age records. Let us look once again at the Vostok ice core drilling. (Click on all the charts to enlarge.)

Vostok-400Kd

This illustration reverses the direction of time flow from that of the previous posting’s chart. It does expand the data from about 120,000 years ago to the present.

The chart blue line is the ice core temperature data referenced to the global temperature. The flat red line is the average of global annual temperature means for the period 1998 to 2008. This provides a reference with which to compare the past temperatures. And lastly, the green is the annual mean temperature for 2008.   Several things are obvious. First, recent temperatures are not as warm as previous temperatures at their peak. Second, the globe began to exit the last glacial period about 15,000 years ago, and the temperature increased fairly rapidly (of course rapidly on this chart may be several thousand of years). It is not possible to attribute this rise nor really any other rise shown on this chart to something that man has done.   The current period has been relatively stable.

Continue reading

Ice Cores And What They Tell Us About Global Climate


Ice cores provide information about the climate in the past and this allows us to compare it with the current climate to determine how it stacks up. While some of the readers may know a lot about ice cores, this posting provides general knowledge for those of you that are not so familiar with ice cores. The next posting will discuss the results of the information gather at two sites in the Antarctic.

The Vostok location, one of many places where ice cores are drilled, is part of the Antarctic ice cap. At this location the snow falls each year and the temperature doesn’t rise above freezing. In fact this location is called the coldest place on Earth.

This is how the ice sheets are formed. The surface layer of snow contains gaps between the snowflakes containing air. As subsequent season’s experience snow falls, the older snow begins to compress. The compression forms a grainy material (firn) said to resemble the texture of granulated sugar. As the snow above continues to accumulate, the firn eventually densifies and closes off the pores and the air is firmly trapped. The ice sheet now has inclusions which can be analyzed. When the ice is cored out of this ice sheet, large amounts of information can be obtained for analysis. Wiki has this to say about the ice core samples:

“Ice cores contain an abundance of information about climate. Inclusions in the snow of each year remain in the ice, such as wind-blown dust, ash, pollen, bubbles of atmospheric gas and radioactive substances. The variety of climatic proxies is greater than in any other natural recorder of climate, such as tree rings or sediment layers. These include (proxies for) temperature, ocean volume, precipitation, chemistry and gas composition of the lower atmosphere, volcanic eruptions, solar variability, sea-surface productivity, desert extent and forest fires.

Continue reading