
Ice cores provide information about the climate in the past and this allows us to compare it with the current climate to determine how it stacks up. While some of the readers may know a lot about ice cores, this posting provides general knowledge for those of you that are not so familiar with ice cores. The next posting will discuss the results of the information gather at two sites in the Antarctic.
The Vostok location, one of many places where ice cores are drilled, is part of the Antarctic ice cap. At this location the snow falls each year and the temperature doesn’t rise above freezing. In fact this location is called the coldest place on Earth.
This is how the ice sheets are formed. The surface layer of snow contains gaps between the snowflakes containing air. As subsequent season’s experience snow falls, the older snow begins to compress. The compression forms a grainy material (firn) said to resemble the texture of granulated sugar. As the snow above continues to accumulate, the firn eventually densifies and closes off the pores and the air is firmly trapped. The ice sheet now has inclusions which can be analyzed. When the ice is cored out of this ice sheet, large amounts of information can be obtained for analysis. Wiki has this to say about the ice core samples:
“Ice cores contain an abundance of information about climate. Inclusions in the snow of each year remain in the ice, such as wind-blown dust, ash, pollen, bubbles of atmospheric gas and radioactive substances. The variety of climatic proxies is greater than in any other natural recorder of climate, such as tree rings or sediment layers. These include (proxies for) temperature, ocean volume, precipitation, chemistry and gas composition of the lower atmosphere, volcanic eruptions, solar variability, sea-surface productivity, desert extent and forest fires.
This photo of the ice shows typical inclusions. (A polarized light source behind an ice core sample was used for illumination.)

This is a photo of annual layers in an ice core:

“19 cm long section of GISP 2 ice core from 1855 m showing annual layer structure illuminated from below by a fiber optic source. Section contains 11 annual layers with summer layers (arrowed) sandwiched between darker winter layers.”
The Vostok team photo showing some of them holding ice cores:
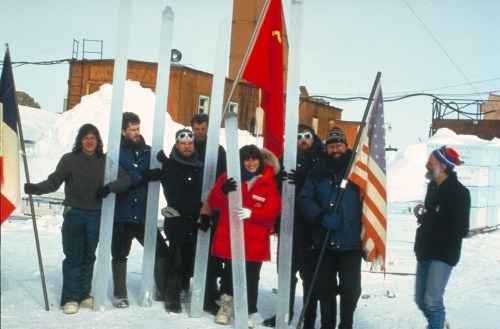
Science demands cooperation. By working together, these French, Russian, and American scientists were able to accomplish their goal: the long segments of ice they so proudly hold symbolize this sense of cooperation. Just as researching the Earth’s climatic history requires collaboration between different individuals and different nations, preparing scientific, political, and social solutions for Earth’s climatic future demands a level of cooperation far beyond that currently existing. While different nations and different peoples draw lines of separation and division on the globe, we all must realize that we share one, single planet, and that its destiny, good or bad, is the destiny of us all.
Presumably these are not the official cores because the cores used for analysis are handled with utmost care to prevent contamination.
And the cores are stored in a way they are preserved in refrigerated warehouses such as this one:
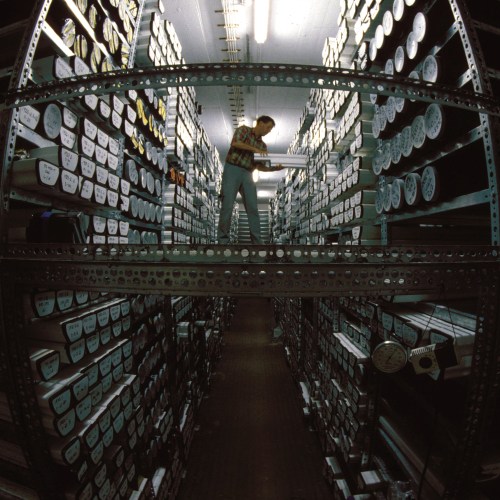
de: POLARSTERN Kernarchiv des AWI mit Kurator Dr. Hannes Grobe
The ice at the Vostok site is ancient. The depth drilled at Vostok is about 3400 meters (about 2.1 miles) and the years before the present time is about 400,000 years. Another important drilling site is the EPICA Dome C where the drilling records about 800,000 years before the present time.
The following graphs show the age span of the ice core drilling and the depth of drilling at Vostok and Dome C: (Click on Charts to enlarge.)
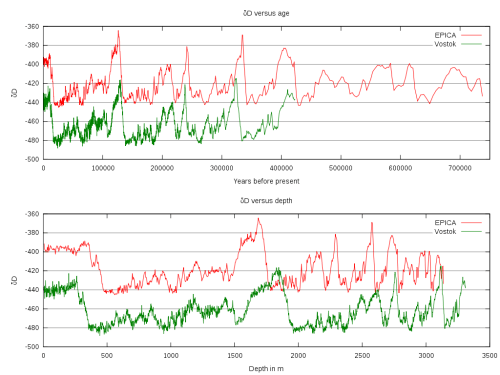
“Plots of delta-deuterium against age and depth (from EPICA and Vostok). Note that the Vostok core is deeper, but does not extend as far back in time. Note also that the y-axis offset between the EPICA and Vostok cores in delta-deuterium is real: Vostok is a colder site, hence has more negative delta. Differences in the apparent age of events are likely to be inaccuracies in converting ice depth to age.”
When viewing the top chart –AGE- the present time is at the left. As you proceed to the right, you are looking back into time, hundreds of thousands of years ago.
A note about the delta-deuterium (-δD) shown on the vertical (y) axis is about the ratio of heavy hydrogen to normal hydrogen in the water (melted ice core) sample. It is proxy for temperature.**
Wiki says this about the importance of ice cores:
“An ice core from the right site can be used to reconstruct an uninterrupted and detailed climate record extending over hundreds of thousands of years, providing information on a wide variety of aspects of climate at each point in time. It is the simultaneity of these properties recorded in the ice that makes ice cores such a powerful tool in paleoclimate research.”
The next posting will discuss the climate implications that can be drawn for the Vostok and Dome C ice cores
cbdakota
ALL PICTURES AND GRAPHS ARE COURTSEY OF WIKIPEDIA.
**The nucleus of deuterium contains one proton and one neutron, while the common hydrogen isotope has no neutron in the nucleus. As humid air cools, the water vapor begins to condense and the water molecule made with heavy hydrogen precipitates first. The more the atmosphere continues to cool, the more the heavy hydrogen is depleted. When analyzing the ice core, the ratio of heavy to normal hydrogen (-δD) in the water is a temperature proxy. As the “-δD” number goes more negative, it represents temperature when the snow fell was getting colder. By the way, it is believed that all the deuterium in the universe was formed at the time of the Big Bang.
This is a simplistic explanation and it’s the best I can do in this space.

Pingback: Trump Ignores Gore And DiCaprio Advice | Climate Change Sanity
Pingback: Will The Global Temperature Begin To Cool Down In The Near Future? | Climate Change Sanity