Category Archives: Global Temperatures

President Trump Dumps Alarmist Panel-Draining The Swamp Continues


The climate alarmists tell the public that the sea level is going rise 7 to 15 feet by the end of this century.  The crops are going to fail.  There will be mass extinctions.  The extent of the horrors awaiting us in the future are almost unlimited.  The basis for all these catastrophes is the predicted rise in temperature based upon the computer models they have programed. For example, the sea level rise is predicated on a rise of temperature in the range of 4 to 7° C  or greater by the year 2100.  Without the big rise in global temperature, all these supposed disasters will not come to pass.

These computers have been forecasting temperature for many years.  How are they doing?  If a company had their operations run by these computers, they would be out of business by now.  Look at some of the recent revelations. The New American posted “Top Climate Alarmist: Computer Models Wrong, Skeptics Right on “Pause”.  From that posting we get this:

“Count on the Fake News media to ignore a huge admission by a Climategate scientist that there has been no measurable global warming over the past 20 years — something he has previously vociferously denied. The admission by Dr. Benjamin Santer, a top global-warming alarmist, should have made headlines — but, of course it didn’t.

Continue reading

Why Are We Told The Globe Is Heating Up If The US Is Not?


Joe D’Aleo posted, on his website Ice Cap, “Heat has been declining for decades despite government reports”.   D’Aleo uses temperature data collected in the USA from 1895 to 2017 to show that the US has cooled. Yes, the data is just for the US and not the globe.  But the US has no rival for the most measuring stations, and quality of the raw data and except for the UK, the longest record.  One has to wonder why the rest of the globe would be warming if the US is not.

From D’Aleo’s posting:

“The trend towards heat in the real world is clearly DOWN not up. The number of state all time record highs peaked in the 1930s (23 states), 38 occurred before 1960. The number of days exceeding 100, 95 and 90 degrees in 1200 US stations have declined since the 1930s”

“The headlines from the mainstream media and Soros funded alarmist science organizations want you to believe heat is increasing and has become or will soon become deadly”.

“I asked Tony Heller to plot the number of 90, 95 and 100F days for the nation’s USHCN stations year to date. He did it for January through July.”

Tony Heller provided three charts for D’Aleo, all labeled

January-July Percent of Days Above (90; 95; 100F) VS year 1895 -2017 At All US Historical Climatology Monitoring Station

The chart below is for days ABOVE 90°F


Continue reading

The Ocean’s CO2 Sink Enlarges And Plankton Breaks CO2 Down And Adds Oxygen To The Atmosphere


It is amazing how some of the smallest things on Earth are very important.   Phytoplankton capture CO2 in the ocean and use the carbon to produce mass and release the oxygen.  Wikipedia says between 50% to 80 % of our atmospheric oxygen is produced by the phytoplankton. Other reference use about 50%.  Phytoplankton have chlorophyll to capture sunlight, and they use photosynthesis to turn it into chemical energy.  Really no difference from that of terrestrial plants.

EarthobservatoryNASA, gov describes phytoplankton as follows:

Derived from the Greek words phyto (plant) and plankton (made to wander or drift), phytoplankton are microscopic organisms that live in watery environments, both salty and fresh.

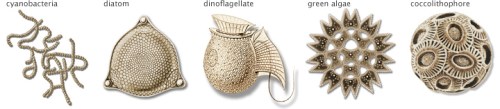
Some phytoplankton are bacteria, some are protists*, and most are single-celled plants. Among the common kinds are cyanobacteria, silica-encased diatoms, dinoflagellates, green algae, and chalk-coated coccolithophores.


*Protists are not animal, nor plant nor fungus.  An Amoeba is classified as a protist, for example.

Equally as important to the replenishing of the oxygen is the following:

“Phytoplankton are the foundation of the aquatic food web, the primary producers, feeding everything from microscopic, animal-like zooplankton to multi-ton whales. Small fish and invertebrates also graze on the plant-like organisms, and then those smaller animals are eaten by bigger ones.”

Phytoplankton can also be the harbingers of death or disease. Certain species of phytoplankton produce powerful biotoxins, making them responsible for so-called “red tides,” or harmful algal blooms.

All this brings me to the latest Global CO2 Budget graphic  shown below:

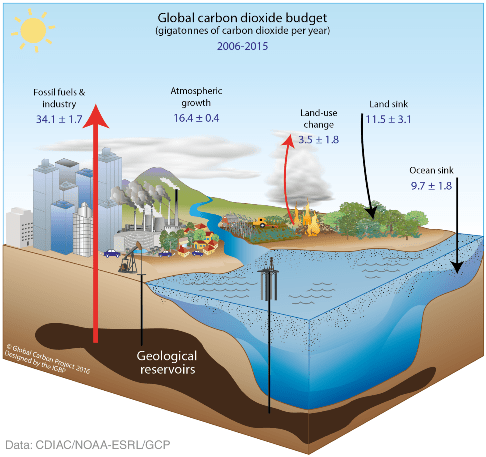
This graphic does not look like the one you have probably examined before. Those graphics were normally global CARBON budget.  This one is global CARBON DIOXIDE budget. CO2 weight ratio to C is 44 to 12.   To convert, multiply the C number by 3.67 to convert to CO2.

This chart would suggest that most of the O2 comes from the “land sink” rather than from the “ocean sink”.  Error bars on the land sink are big. No big deal, as I suppose most of this is supposition anyway.

The followingxxxxxchart is interesting:

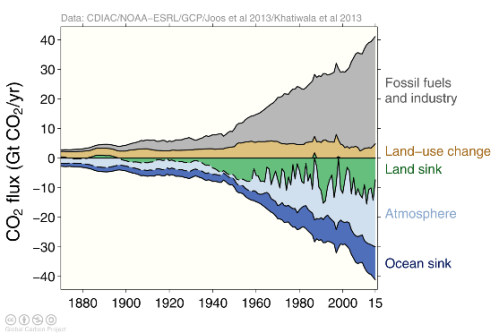
The chart balances emissions—fossil fuels and industry plus land use changes against sinks –land sink, ocean sink and the atmosphere.  The ocean is absorbing more CO2.  The land sink, since about 1950, has really increased, reflecting the “greening of the planet”.

cbdakota


  1. It is said that the plankton to krill to Blue whale is about as close a food chain connection as one can find. The Krill eat phytoplankton and the Blue whales eat krill. The blue whale can eat as many as 40 million krill per day or around 8,000 lbs. daily in order to power its massive body.
  2. “Plankton” is Sponge Bob SquarePants’ big enemy. Just another form of harmful species.


REBLOG: 4,300 Days Since Last U.S. Major Hurricane Strike–By Dr. Spencer.


Rebloging Dr. Roy Spencer’s posting which can be reached by clicking here.

The season is starting slowly; however,  it may surprise us.   I was in Tampa, Florida on 24 October 2005.  For a day or so, it looked like Tampa might be the landfall.  In the end,  it made landfall south of Tampa, fortunately for my son whose house we were fixing up to sell.

cbdakota

July 31st, 2017 by Roy W. Spencer, Ph. D.

Wednesday of this week will mark 4,300 days since the last major hurricane (Category 3 or stronger, 111-129 mph maximum sustained winds) made landfall in the U.S.

That’s almost 12 years.

The last major hurricane to make landfall in the U.S. was Wilma striking Florida on October 24, 2005, one of several strong hurricanes to hit the U.S. that year. The unusual hurricane activity in 2005 was a central focus of Al Gore’s 2006 movie, An Inconvenient Truth, in which Mr. Gore suggested 2005 was going to be the new normal. As you might recall, Gore went on to receive a Nobel Peace Prize for helping to raise awareness of the severe weather dangers from global warming.

Instead, the bottom dropped out of Atlantic hurricane activity after 2005. The “drought” of landfalling U.S. major hurricanes continues, and as seen in this graphic from WeatherStreet.com, no hurricanes have yet formed anywhere in the Atlantic basin in 2017, despite the forecast for an above-normal hurricane season:

July 2017 Gobal Average Temperature –UAH Satellite


The Global Average Temperature (GAT) anomaly rose 0.07°C  in July. The  GAT anomaly now stands at +0.28°C.

The table below shows that the Southern Hemisphere and the Tropics rose from their readings in June.   NOAA says:

“The most recent model forecasts indicate a high probability that the sea surface temperature in the Niño3.4 region will remain at least slightly above average through winter of 2017-18. “

The above is a model prediction, after all.    I note a slight  drop in the ENSO Meter so I suspect that the GAT will continue its downward trend, though maybe not as fast as I had anticipated

YEAR MO GLOBE NHEM. SHEM. TROPICS
2016 01 +0.55 +0.73 +0.38 +0.84
2016 02 +0.86 +1.19 +0.52 +0.99
2016 03 +0.76 +0.99 +0.54 +1.10
2016 04 +0.72 +0.86 +0.58 +0.93
2016 05 +0.53 +0.61 +0.45 +0.71
2016 06 +0.32 +0.47 +0.17 +0.38
2016 07 +0.37 +0.43 +0.30 +0.48
2016 08 +0.43 +0.53 +0.32 +0.50
2016 09 +0.45 +0.50 +0.39 +0.38
2016 10 +0.42 +0.42 +0.41 +0.46
2016 11 +0.46 +0.43 +0.49 +0.36
2016 12 +0.26 +0.26 +0.27 +0.23
2017 01 +0.33 +0.32 +0.33 +0.09
2017 02 +0.39 +0.58 +0.19 +0.07
2017 03 +0.23 +0.37 +0.09 +0.06
2017 04 +0.27 +0.29 +0.26 +0.22
2017 05 +0.44 +0.39 +0.49 +0.41
2017 06 +0.21 +0.32 +0.09 +0.39
2017 07 +0.28 +0.29 +0.27 +0.51

Chart and Tables are from Dr, Roy Spencer’s blog  which you can access by clicking here.

cbdakota

If you are trying to decide if you should go to Al Gore’s new documentary,  read this first.


Al Gore’s new documentary titled “An Inconvenient Sequel: Truth to Power” opened on July 28 with a limited engagement. Beginning in August, the documentary will be opening in many theaters.  I don’t know how many, as it has not been getting great reviews, but it will be in many more than the initial 4 theaters.

The critics being mostly being quite liberal tend to give this kind of movie a big “thumbs up”. Science has little to do with their ratings of a movie like this, because they are sure if Al Gore produced it, it must all be true. However, the liberal website, VOX said, “Even An Inconvenient Sequel seems a little light on facts at times.” Many of the movie reviewers said it was, in effect, boring.  Maybe that was reflected in the boxofficemojo data published on Sunday, 30 July.  That they said ticket sales for the first day were $61,000, the second day were $43,000 and today (the third day) were $26,000 might reflect the boring viewpoint. 

But Gore did receive the Nobel Peace Prize in 2007 for his first film, didn’t he?  Yes, he did. However, it was the same Nobel Peace Prize Committee that presented the award to the newly elected Barrack Obama before he got into office. They awarded the Peace Prize to Yasser Arafat of the PLO, too.  That Committee has a very transparent political agenda. It has very little to do with peace.

But never fear gentle reader, Al Gore will not let you down.

Bjorn Lomborg’s comments on just a few of Al Gore’s many prediction misses in his posting “Al Gore’s Climate Sequel Misses A Few Inconvenient Facts”:

Continue reading

$535 Trillion To Remove CO2 From The Atmosphere


James Hansen, et al have issued a study titled “Young people’s burden: requirement of negative CO2 emissions.  The authors say that unless CO2 reduction begins right away and aggressively the next generation and the one after that will have to spend a $535 trillion to make Earth habitable.  This $535 trillion is not the $trillions that the warmers want to spend to bring CO2 emissions to a net zero by 2050 or 2100 (depending on which warmer group is talking).  The $535 trillion is for removing atmospheric CO2.

The Hansen et al study says the global temperature will melt glaciers and consequently sea level will rise 6 to 9 meters (approximately 20 to 30 feet). Using models, the study determined a temperature rise due to a rise in atmospheric CO2 and then determined that the glaciers will melt which is the big threat. The authors conclude that the current interglacial period would match the Eemian interglacial period which occurred about 125,000 years ago.   That period is believed to have experienced a 6 to 9-meter sea level rise.  The chart below, from Wikipedia shows the current interglacial period, the Holocene and the Eemian and other interglacial periods. Note that the scale is more or less logarithmic and not linear.

A tangential observation—this chart shows that the Globe’s temperature has been much hotter than at present. Also, the Pleistocene running from about 1 million years ago to about 20 thousand years ago shows glacial and interglacial periods.  The peak temperatures are the time of the interglacial and the rest are the times when some part of Earth was covered by advancing glaciers.  Were there SUVs and fossil fuel powered plants putting out CO2 that caused the glaciers to melt?

Continue reading

The Ice Age’s combined horrors – intense cold, permanent drought and CO2 starvation


The New York Magazine posted, “The Uninhabitable Earth” by David Wallace-Wells. Some observers think that this posting is so bizarre that it must be a parody; meant to be something like a posting on the ONION. 

I have been planning to discuss some information about CO2.  When I read Part V of Mr. Wallace-Wells essay subtitled “Unbreathable Air”, I had to make it part of the discussion to illustrate why some consider the New York Magazine’s posting is  a parody.  Wallace-Wells notes:

“Our lungs need oxygen, but that is only a fraction of what we breathe. The fraction of carbon dioxide is growing: It just crossed 400 parts per million, and high-end estimates extrapolating from current trends suggest it will hit 1,000 ppm by 2100. At that concentration, compared to the air we breathe now, human cognitive ability declines by 21 percent.

Where is he getting his information?  Let’s look at what experts have to say about CO2 .

CO2 is an asphyxiant gas and not classified as toxic or harmful.  The American Conference of Governmental Industrial Hygienist say that the TLV is 5,000 ppm.  The Threshold Limit Value (TLV) is the level which a worker can be exposed to day after day for a lifetime without adverse effects. Concentrations up to 1% (10,000 ppm), will make some people feel drowsy according to some sources.  Levels of 70,000 to 100,000 may cause suffocation.    So, Wallace-Wells’ value of 1000ppm is truly a laughable statement.  Perhaps anyone who reads the         “Uninhabitable Earth”  will experience a cognitive decline of 21%.

Continue reading

Global Temperature Update– June 2017


The UAH satellite global temperature measurement cooled off to an anomaly of +0.21C in the month of June.  The peak global temperature resulting from the El Nino, is now on its way to normal.  The May global temperature reversed the downward trend by increasing but this was more than offset by the 0.23 C drop in the month of June.  Many postings are arguing that the PAUSE has resumed.   I will leave that alone for several months before commenting.

This anomaly is the lowest since July 2015.

I believe we are in for some global cooling, but it may still be several years away.   I have mixed feelings  about this.  The world will become a harder place for many people if this results in reduced food crops and much higher costs for keeping warm.  Ask those people in Europe that can no longer afford the high cost electricity in the winter  that has resulted from imposing wind and solar energy on them. Cold weather is the real climate killer, not the fantasy of higher temperatures that the warmers spout.  But the good part would be  is it should put a stake in the heart of the catastrophic man-made global warming theory.


YEAR MO GLOBE NHEM. SHEM. TROPICS
2016 01 +0.55 +0.73 +0.38 +0.84
2016 02 +0.86 +1.19 +0.52 +0.99
2016 03 +0.76 +0.99 +0.54 +1.10
2016 04 +0.72 +0.86 +0.58 +0.93
2016 05 +0.53 +0.61 +0.45 +0.71
2016 06 +0.32 +0.47 +0.17 +0.38
2016 07 +0.37 +0.43 +0.30 +0.48
2016 08 +0.43 +0.53 +0.32 +0.50
2016 09 +0.45 +0.50 +0.39 +0.38
2016 10 +0.42 +0.42 +0.41 +0.46
2016 11 +0.46 +0.43 +0.49 +0.36
2016 12 +0.26 +0.26 +0.27 +0.23
2017 01 +0.33 +0.32 +0.33 +0.09
2017 02 +0.39 +0.58 +0.19 +0.07
2017 03 +0.23 +0.37 +0.09 +0.06
2017 04 +0.27 +0.29 +0.26 +0.22
2017 05 +0.44 +0.39 +0.49 +0.41
2017 06 +0.21 +0.32 +0.09 +0.39

NOAA’s Stated “Highest” Temperature Years May Not Be Valid


A posting in the WSJ titled “Change Would Be Healthy at U.S. Climate Agencies, such as mentioning margin of error!” illustrates the way that the EPA and NOAA along with the compliant media have been misleading the public about global temperatures. Holman Jenkins, a member of the WSJ editorial board wrote:

The year 2016 was the warmest ever recorded—so claimed two U.S. agencies, NASA’s Goddard Institute for Space Studies and the Commerce Department’s National Oceanic and Atmospheric Administration. Except it wasn’t, according to the agencies’ own measures of statistical uncertainty.
Such fudge is of fairly recent vintage. Leaving any discussion of the uncertainty interval out of press releases only became the norm in the second year of the Obama administration.

Statisticians wouldn’t go through the trouble of assigning an uncertainty value unless it meant something. Two measurements separated by less than the margin of error are the same. And yet NASA’s Goddard Institute, now under Mr. Hansen’s successor Gavin Schmidt, put out a release eclaring 2014 the “warmest year in the modern record” when it was statistically indistinguishable from 2005 and 2010.

Continue reading