The November global temperature as reported by the University of Alabama Huntsville (UAH) ***came in at an anomaly of +0.17C. The black dot on the chart is shown to be + 0.17C above the arbitrary fixed line. Recent monthly global temperature readings were
July +0.36 ; Aug. +0.28; Sept. +0.24 ; Oct. +0.32 ;
The measurements are the up and down lines, and the fixed line nominally has half of the temperature measurements above and half below the line. The two peaks, about 2017 and 2020 are the effect of El Ninos, naturally occurring phenomena. Not man-made.
Temperature has been declining since those two El Ninos. The opposite effect is a La Nina that usually occurs following an El Nino. Currently the global weather is experiencing a La Nina. La NInas typically result in drought conditions in the southwestern part of the US, for example.
Chart is courtesy of Dr. Roy Spencer.
While the chart is up there, following the very large El Nino that occurred in 1998/1999, the average temperature from then until about 2014/2015, did not rise. This 15/16-year period experienced continual rising of CO2 in the atmosphere. So, you can draw several conclusions as to why did it not rise? One is that there are natural forcing agents that were cooling the atmosphere. Two, is that maybe CO2 is not really what is theorized to be.
Detailed look at regions like North America, Southern Hemisphere, the Arctic, etc.by clicking here DrRoySpencer.PhD
***There are a number of organizations that chart global temperature. The best source is the UAH satellite data. It is the first that used satellites when it began in 1978/1979 and has continued to date. The satellite system measures the ocean temperature as well as the ground temperature. Others source temperature data from stations located around the globe. But these stations are concentrated in places that are inhabited and for the rest of the globe, they make estimations.
Confirming the accuracy of the UAH temperature measurements is that they match closely to the primarily land-based radiosonde (weather balloons) temperature measurements. The real temperature of the globe is contested. But the change in temperature from month to month is generally agreed to. You may have wondered why the Alarmist always speak about an anomaly increase in temperature of 1.5C., and not a specific temperature.
I know that my recent blogs have been centered around Europe’s predicament because of their dependence on wind and solar renewable energy. The blogs may have become boring, but when evidence shows clearly how misguided the Europeans are about renewable energy I just have to pour it on. The UK newspaper the Guardian, is an unending source of Alarmist propaganda. Interestingly they just headlined the sky-high price of a Megawatt-hour of electricity. Here is what the Guardian is reporting:
“UK power prices have hit record levels as an icy cold snap and a fall in supplies of electricity generated by wind power have combined to push up wholesale costs.
The day-ahead price for power for delivery on Monday reached a record £675 a megawatt-hour on the Epex Spot SE exchange. The price for power at 5-6pm, typically around the time of peak power demand each day, passed an all-time high of £2,586 a megawatt-hour.“
The grid that supplies my power here in the USA, uses mostly fossil fuels and nuclear power sources for our electricity. I just looked at the price from the Electricity Map app and it is $50 a megawatt-hour.
The cold snap, which is expected to last for at least a week, comes as wind speeds reduced sharply, hitting power suppliers.
Live data from the National Grid’s Electricity System Operator showed that wind power was providing just 3% of Great Britain’s electricity generation on Sunday. Gas-fired power stations provided 59%, while nuclear power and electricity imports both accounted for about 15%.“
Now comes the Guardian’s cavate it must use when it seems to post data that contradicts the Alarmist’s narrative.
“There can be no more hiding, and no more denying. Global heating is supercharging extreme weather at an astonishing speed. Guardian analysis recently revealed how human-caused climate breakdown is accelerating the toll of extreme weather across the planet. People across the world are losing their lives and livelihoods due to more deadly and more frequent heatwaves, floods, wildfires and droughts triggered by the climate crisis.“
So how can one discuss these issues with Alarmists when global warming causes everything. Cold and Hot, drought and rain, snow and no snow, etc.
What they have done is to demonize frequent weather patterns by telling us that it has never been like this before. And of course, they know exactly what the perfect climate is.
The severe weather forecast Europe says we are likely to have a cold early winter. The blog authored by Renato R Colucci, makes these forecasts: (click to enlarge charts)
0
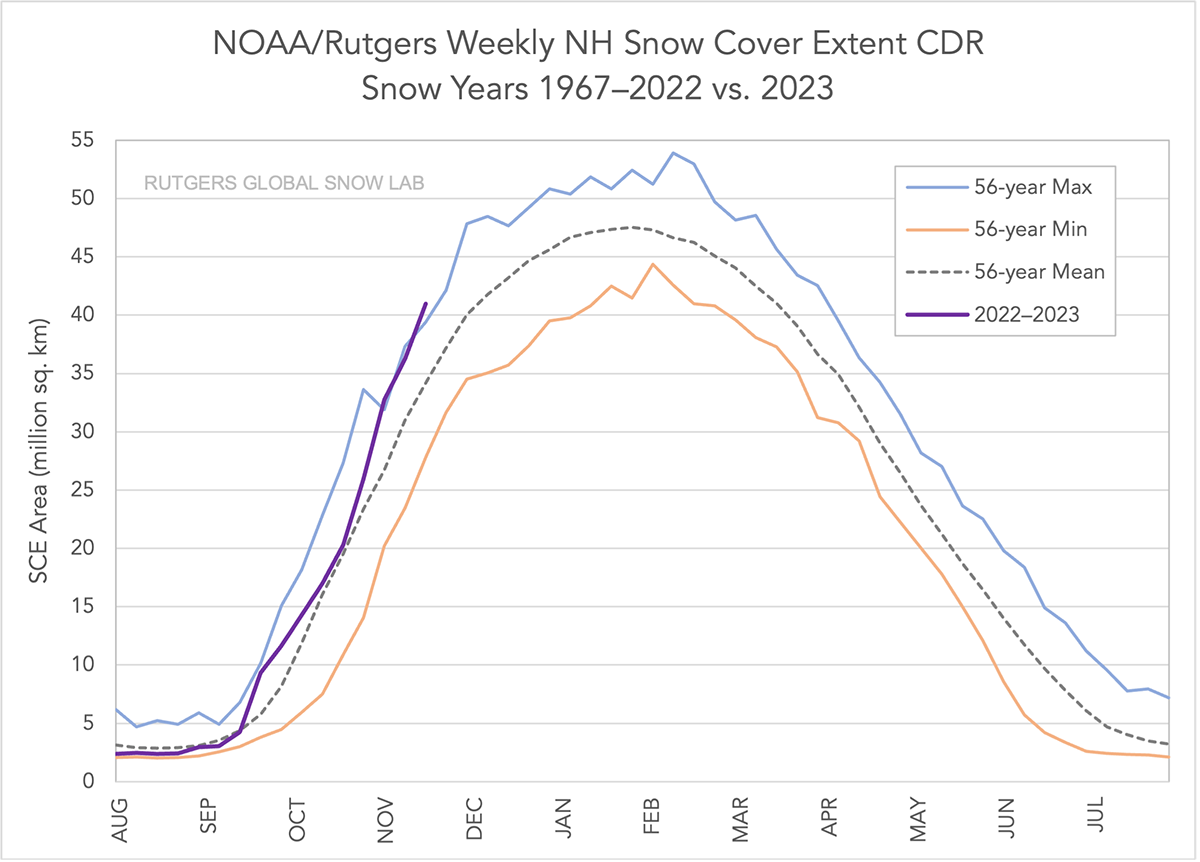
“Snow Extent in the Northern Hemisphere now Among the Highest in 56 years Increases the Likelihood of Cold Early Winter Forecast both in North America and Europe.”
“Snow extent in the Northern Hemisphere at the end of November represents an important parameter for the early winter forecast. This year snow extent is running much higher than average and according to existing global estimates, it is now beyond the highest ever observed so far. Winter forecast, especially in its early phase and in Europe, might be strongly influenced by such a large snow extent, although many other factors need attention.” (My emphasis on sentence,)
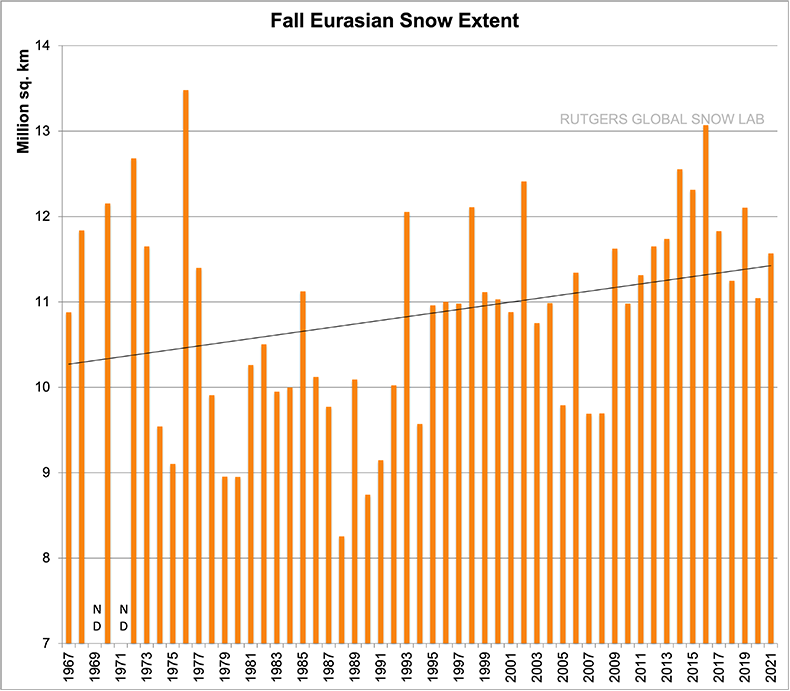
The posting also shows that fall snow extent is increasing lately. The following charts show the trend.
Real data is again conflicting with the Alarmists forecasts of an apocalypse.
Anyone want to bet if some “scientist” will try to show that this is due to global warming,
Growing realization by the climate establishment that the threat of future warming has been cut in half over the past 5 years.
Summary: The climate “catastrophe” isn’t what it used to be. Circa 2013 with publication of the IPCC AR5* Report, RCP8.5 was regarded as the business-as-usual emissions scenario, with expected warming of 4 to 5 oC by 2100. Now there is growing acceptance that RCP8.5 is implausible, and RCP4.5 is arguably the current business-as-usual emissions scenario. Only a few years ago, an emissions trajectory that followed RCP4.5 with 2 to 3 oC warming was regarded as climate policy success. As limiting warming to 2 oC seems to be in reach (now deemed to be the “threshold of catastrophe”),[i] the goal posts were moved in 2018 to reduce the warming target to 1.5 oC. Climate catastrophe rhetoric now seems linked to extreme weather events, most of which are difficult to identify any role for human-caused climate change in increasing either their intensity or frequency.
The main stream media is currently awash with articles from prominent journalists on how the global warming threat less than we thought. Here are some prominent articles:
At the heart of this good news is abandonment of RCP8.5 from UNFCCC policy making. The hero of science behind this abandonment is Justin Ritchie, a recent Ph.D. graduate (whose work has been cited.
The COP26 and now the COP27 have quietly dropped RCP8.5 (and SSP5-8.5) from their considerations, focusing on the envelope between RCP4.5 and RCP2.6. The grand poohbahs of the IPCC apparently didn’t see this coming (or preferred to keep spinning the alarm), since they instructed climate modelers for CMIP6 to continue a focus on SSP5-8.5, and climate researchers continue to focus on this scenario in their impacts publications. The IPCC AR6 prominently featured SSP5-8.5, although WGI did make this lukewarm statement
The second so-called scientific advance is lower values of climate sensitivity. The so-called advance is associated with the IPCC AR6 decision NOT to include values derived from climate models (which have dominated previous IPCC reports). They implicitly acknowledge that climate models are running too hot and that you can pretty much get whatever value of climate sensitivity that you want from a climate model (this has been blindingly obvious to me and many others for over a decade). The IPCC AR6 lowered the upper likely bound of ECS to 4.0oC (from 4.5oC previously); this further acts to reduce the amount of projected warming. The IPCC AR6 also raised the lower likely bound of ECS to 2.5oC (from 1.5oC). Raising the lower bound of ECS is on very shaky ground, as per the recent publication by Nic Lewis
The COP27 is working from a value of expected warming of 2.5oC by 2100. This is arguably still too high for several reasons. IPCC expert judgment dismissed values of climate sensitivity that are on thelower end (that should not have been dismissed as per Nic Lewis’ paper). Further, the IPCC projections do not adequately account for scenarios of future natural climate variability. See these recent posts:
In addition to an insufficient number of solar and volcanic scenarios, the climate models ignore most solar indirect effects, and the climate model treatment of multidecadal and longer internal variability associated with ocean circulations are inadequate. While in principle these factors could go either way in terms of warmer vs cooler, there are several reasons to think these natural factors are skewed towards cooler during the remainder of the 21st century:
Baseline volcanic activity since 1850 has been unusually low
Most solar researchers expect some sort of solar minimum in the mid to late 21st century
Solar indirect effects are inadequately treated by climate models, which would act to amplify solar cooling
A shift to the cold phase of the Atlantic Multidecadal Oscillation is expected in the next decade, which influences not only global temperatures but also Greenland mass balance and Arctic sea ice.
Once you include alternative scenarios of natural variability, temperature change by 2100 could easily be below 2oC and even 1.5oC. Recall that this warming is with reference to a baseline of1850-1900; 1.1oC warming has already occurred.
*AR stands for Assessment Report. These are based upon the content in the Intergovernmental Panel on Climate Change (IPCC) full reports, assembled by working groups. AR6 is the most recent report. The reputation of the ARs is in dispute. The full report, the 6th, is condensed to an AR6. The dispute is that many nonscientific personnel, such as delegates from industry, NGOs, etc. can force change that make the AR inconsistent with the full report.
The alarmist’s climate crisis is encountering some serious headwinds. Not just from we skeptics but also from the ranks of the man-made global warming adherents. This posting will be to set the table for the subsequent postings that will illustrate the headwinds. Another posting that will illustrate the profound damage that the crisis crowd are doing to the young people will also be posted.
I posted in April 2021 how the alarmist’s computer forecasts were biased. Two concepts are the primary tools that the computer operators use to make predictions of future temperatures. One is the representative concentration pathway (RCP) and the other is the equilibrium climate sensitivity (ECS)
RCP
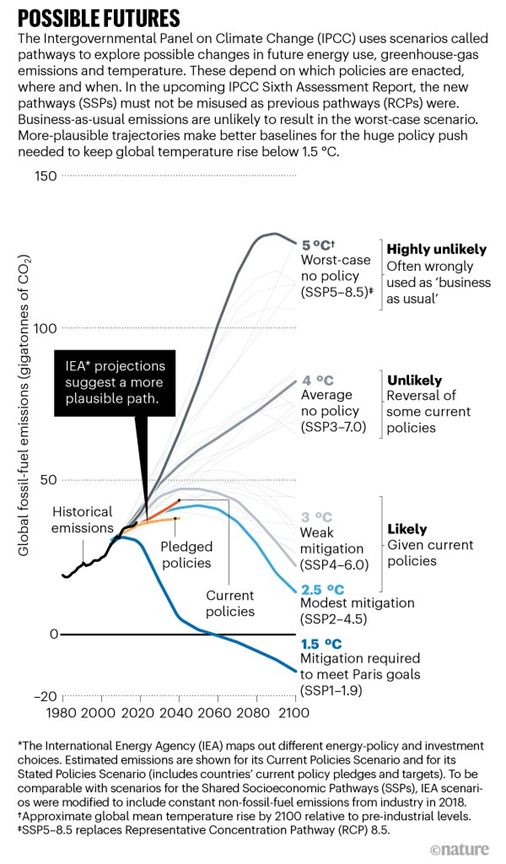
Representative Concentration Pathway (RCP) is an estimate of the amount of CO2 in the atmosphere at any given time.
The chart below shows the range of RCPs the computer programmer can use. The chart has RCPs portraying the forecasted amount of accumulated CO2 in the atmosphere out to the year 2100. The chart has a bit of dialog as well. More on this will appear in the upcoming posting on this topic.
ECS
Theory is that temperature will rise approximately 1C due to a doubling of atmospheric CO2. Further, the CO2 induced increase in temperature will result in creating water vapor. Water vapor is a powerful greenhouse gas. That and some other minor changes in atmospheric gases will result in an additional rise of 2C. Thus, CO2 doubling does not just create 1C rise but rather a 3C rise.
ECS is controversial. There are those that do not believe in the CO2 effect at all. They may not appreciate this postings discussion of ECS and RCP, but the posting is addressing what the Alarmist believe. Most buy into the concept but conclude that the effect is much less than a 3C rise,
This is how the ECS theory works. Surface warming due to doubling of the atmospheric CO2. Going from the nominal 400ppm atmospheric CO2 to 800ppm would result in 3C rise. But other test data says it is less.
Jonova chart
The computer programmer puts in the RCP and the ECS. He can get whatever temperature forecast he wants.
The following is a guest posting by Richard Cronin. He provides a well-documented discussion of how Tidal Pumping drives weather and Climate.
By Richard Cronin
There is no “climate crisis”. The internal heat of the Earth delivered to the ocean floor is grossly misunderstood.
An entirely unappreciated energy input onto the surface of our planet is Tidal Pumping. Not pumping water. Shifting our tectonic plates due to the Earth’s gyrations (Precession, Obliquity, Perihelion, and Orbital Eccentricity) in addition to our varying distance from the planetary gravity fields everywhere from the Sun out to Jupiter.
Milankovitch cycles have nothing to do with solar radiation. They have everything to do with tidal pumping. This information has been coming forward over the last decade by geologists, geophysicists, and astrophysicists. Unfortunately, these disciplines have been overlooked in the discussion about climate.
Tidal pumping by the Sun, Precession of the Equinoxes, Obliquity, Perihelion, Orbital Eccentricity, as well as planetary alignments (particularly Sun, Venus, & Jupiter) move Earth’s tectonic plates. Therefore, all of Earth’s internal heat is delivered to the surface, notably into the waters at the two (2) terminal points of the Pacific’s Ring of Fire. The seismic heat injection is Enormous. Per NASA, this energy input is approx. 99.5 % of all solar radiation but the flawed paradigm is that the internal heat of the Earth is dissipated in Mantle Convection. Mantle Convection and Subduction do not exist.
Per NASA’s very calculations: “The interior of the earth contributes more than 99.5 percent of the total heating of the surface compared with the sun!
This answer, of course is quite wrong because it assumes that 100% of the internal energy is radiated to the surface. In fact, the internal heat source drives powerful convective currents in the mantle so that nearly all of this thermal energy is lost.”
The energy statement is true, but the dissipation of the internal heat into Mantle Convection is wrong. There is no Mantle Convection. The internal heat is delivered to the surface, specifically the ocean floor of our planet and greatly exceeds any causation from minuscule trace gases in our atmosphere.
At the Winter Solstice, the incrementally closer distance between the Sun and Southern Hemisphere induces greater plate movement across the Southern Hemisphere and greater seismicity in the Peru-Chile Trench to drive the El Niño. Alternately, these tidal stresses can find relief and induce greater seismicity in the Tonga-Kermadec Trenches to drive the La Niña. Elevated surface water temperatures near Papua-New Guinea are due to a heat plume emitted from the Tonga Trench, but the heating of these surface waters is also affected by the multi-plate, seismically active regions to the east of Papua-New Guinea, including the New Hebrides and New Britain Trenches. Ergo, sea surface temperatures are highest in these regions east of Papua New Guinea.
Current sea surface temperatures showing cooler waters in the central Pacific and elevated temperatures east of Papua New Guinea. Entirely typical of a strong La Niña:
In “Plate Climatology”, James Edward Kamis describes a single “Source Point” for the La Niña and El Niño as centered on the multi-plate, seismically active regions to the east of Papua-New Guinea. It seems doubtful to me that this region could drive the El Niño off the coast of Peru. I hold that the ENSO is a binodal condition, at either end of the Ring of Fire.
Via bathyscaphic ocean floor mapping, Hillier and Watt (2007) provided an estimate of 1.0 to 3.5 million oceanic seamounts which by definition are formed by submarine volcanoes. This estimate excludes estimates above latitudes 60 degrees North and South. See “Global distribution of seamounts from ship-track bathymetry data” in references.
The Dust Bowl years of the 1930s were caused by a strong, sustained La Niña. Drought across the plains states in summer months , punctuated by springtime flooding conditions further north.
The La Niña brings flooding monsoons across Bangladesh, while the Northern Hemisphere suffers extreme drought in the summer months. Extreme low water conditions across rivers of America’s interior as well as Europe. Yet earlier this spring the Yellowstone River flooded over its banks.
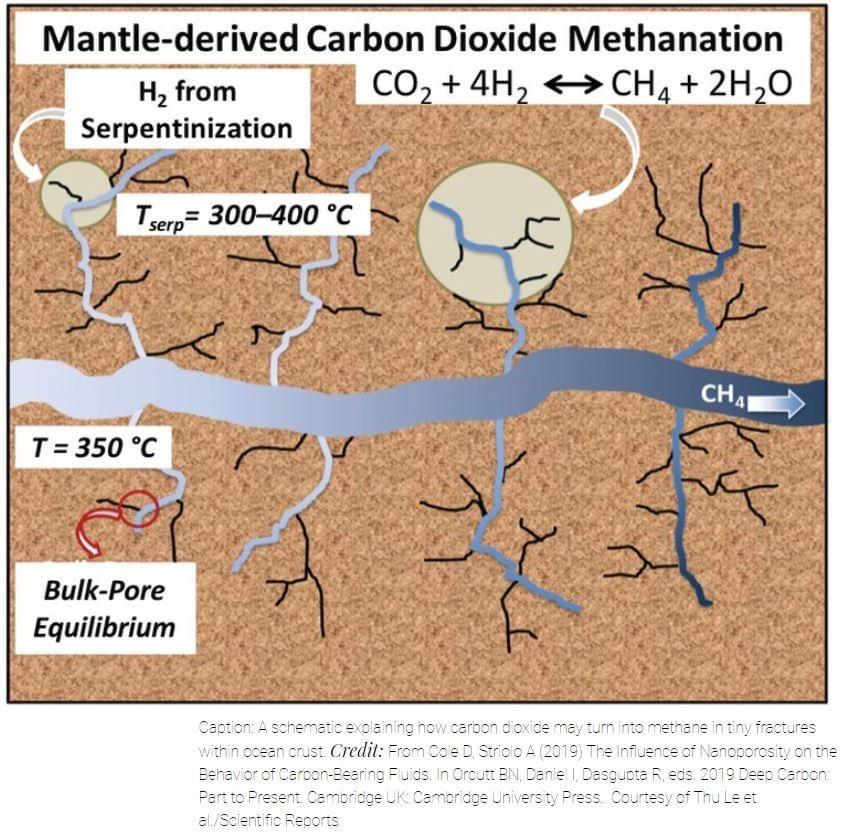
The geochemical reactions throughout the Upper and Lower Mantle are all exothermic (give off heat). Activation Energy is supplied by planetary Decompression. Fischer-Tropsch and Sabatier reactions produce methane and petroleum in unimaginable quantities. (See link). Most is diffused from the ocean floor. Land-based sources are minuscule.
Hydrothermal vents and plain old ocean floor seepage is immeasurable and these acidic discharges react with alkaline ocean waters to release the Heat of Neutralization and the Heat of Dilution.
We have been under pronounced La Niña conditions since autumn of 2020. Last year we went thru the alphabet in hurricane names. Entirely typical of La Niña.
An estimated 50 million tons of water vapor spewed from the Tonga Trench volcano on Jan. 15, 2022. This largest submarine volcano ever observed will produce a warm, wet planet for years. A Richter 7.3 submarine earthquake struck off Tonga on Nov. 11, 2022.
Areas of drought are also caused by an increase in katabatic winds. Moisture condenses on the southern face of the Himalayas, producing monsoons and floods across northern India and Bangladesh. Dry, hot winds flowing down from the Himalayas cause continuous dry conditions for Central Asia.
Significant tidal pumping stresses coincided with the Precession of the planet on Dec. 21, 2021 to tear open the Tonga Trench. Another stress-inducing event is the Perhelion, the closest approach between Earth and Sun, associated with the Earth’s elliptical orbit. The Perihelion occurs two (2) weeks after the Solstices. On April 30, 2022, there was a planetary alignment of Venus-Earth-Mars-Jupiter. On Sept. 26, Jupiter made its closest approach to Earth in 59 years. Tremendous tidal pumping stresses. Tremendous seismic energy release. Totally ignored.
References listed by date. Most of this information was issued in the last half decade. Copy and paste the titles into any web browser.
“Institute for Celestial Geodynamics” ( D. Zbikowski, et al )
“Continental Drift Theory – Unresolved Issues “
“Plate Climatology” by James Edward Kamis. Book published 2019.
“Topological inconsistency of continental drift on the present-sized Earth”
R Meservey. Science. 1969.
“Problem of Convection in the Earth’s Mantle”
E. N. Lyustikh, published in Geophysical Research Letters: 01 January 1969
“Pump-like Tidal Driving of Tectonic Plates – Plates 1” George W. Moore, AAPG Bulletin, GeoScience World, June 1, 1975
“The earth tides”
Judah Levine, December 1982 (NIST)
“Earth tides and the degassing of the Earth”
Khitarov, N. I. ; Voitov, G. I. , March 1982 (NIST)
“Global distribution of seamounts from ship-track bathymetry data”
J.K. Hillier, A.B. Watts, Geophysical Research Letters, July, 2007
—> By definition seamounts are formed by volcanic activity. Hillier and Watt estimate 1 to 3.5 million seamounts and this excludes allowance for regions higher than Latitude 60 degrees. Conservatively, active submarine volcanoes are in the tens of thousands.
“Can Earth’s rotation and tidal despinning drive plate tectonics?”
F. Riguzzi, et al, 2009
“Researchers discover new force driving Earth’s tectonic plates”
Cande & Stegman, Univ. of S. California, July 7, 2011
“On Ohmic heating in the Earth’s core II: Poloidal magnetic fields obeying Taylor’s constraint”. Jackson, Livermore & Ierley, Aug., 2011
“Earth Expansion Evidence: a Challenge for Geology, Geophysics and Astronomy”
G. Scalera, S. Cwojdzinski, National Institute of Geophysics & Vulcanology (Italy), 4-Oct-2011
“Spin-driven tidal pumping: Tidally driven changes in planetary spin coupled with secular interactions between planets.” R. Greenburg et al, Feb. 2013
“Tidal strain and tidal stress in the Earth’s interior” W. Kia, et al, Chinese Journal of Geophysics, November, 2013
“Tidal Stresses – How Gravity Heats Things Up”, Tim James, Dec. 2, 2013 ( author of ‘Astronomical: From Quarks to Quasars, the Science of Space at its Strangest’)
“Secular Increase in the Earth’s LOD (Length of Day) Strongly Implies that the Earth Might Be Expanding Radially on a Global Scale” G.G. Nyambuya ,
4-March-2014
“Asian monsoons in a late Eocene greenhouse world”
A. Licht, G. Dupont-Nivet, et al, Nature, 4-August 2014
—> “But monsoons are still poorly understood, and today’s climate models disagree about how increased carbon dioxide (CO2) in the atmosphere will alter them.”
—> “Asian monsoon began ….. recently several independent teams to around 40 million years ago.” (same duration as Central Asian drought)
“Jupiter’s effect on Earth’s climate”
O. G. Sorokhtin, et al Nov., 2014
“Stanford geologists refute coal development theory” Boyce, Nelson at Stanford 2-Feb. 2016
—> Coal, oil, and gas are NOT produced from squished trees. Fischer-Tropsch (F/T) and Sabatier reactions produce oil and gas on all planets. The only true “fossil fuel” is lignite (brown coal, soft coal, thermal coal) derived from peat bogs of the Tertiary Period. It has only 25 to 35% Carbon value.
—> Heavy crudes, petroleum tars, sub-bituminous coal, bituminous coal vent off volatiles to yield Anthracite (black coal, hard coal) which is 95% Carbon. These carbonaceous fuels all derive from F/T and Sabatier reactions.
“One Paradox of Plate Tectonics”
Laszlo Attila Horvath, July-2016
“Resilience of the Asian atmospheric circulation shown by Paleocene dust provenance”
A. Light, G. DuPont-Nivet et al
Nature Communications 4-August-2016
—> “Our results show that dust sources and near-surface atmospheric circulation have changed little since at least 42 Myr.” (same duration as India-Bangladesh monsoons)
—> “Neither Tibetan uplift nor the decrease in atmospheric carbon dioxide concentration since the Eocene seem to have changed the atmospheric pattern in central Asia,” Licht said. “Wind patterns are influenced by CHANGES IN THE EARTH’S ORBIT over tens or hundreds of thousands of years, but over millions of years these wind patterns are very resilient.”
“Pervasive upper mantle melting beneath the western US”
S. Hier-Majumber, B. Tauzin, et al Earth and Planetary Science Letters. April-2017
—> Just above Transition Region there are Carbonate melts, source of CO and CO2 by acidic attack from sulfur compounds (SO2, etc) produced in the Lower Mantle. CO and CO2 are reagents for Fischer-Tropsch and Sabatier reactions to produce methane and water. Just in the Western U.S. ALONE, centered on Yellowstone, this carbonate melt zone measures approx. 1.8 million sq. km with a thickness ranging from 25 to 70 km. Decomposing just 1 % of this Yellowstone carbonate layer would be equivalent to burning 2.3 trillion barrels of oil.
“The Very Deep Origin of the World’s Biggest Diamonds”
Gemological Institute of America, Winter 2017
—> “Culligan-like diamonds contain …. iron-rich metallic inclusions surrounded by a fluid jacket composed of methane and hydrogen.” This is a Fischer-Tropsch reaction. Iron is the catalyst.
—> Fischer-Tropsch reactions proceed as follows: CO + 3H2, under Reducing Conditions (O2 deficient) and in the presence of an Iron or Cobalt catalyst and starting at 350C, yields methane and water. Further dwell time in a geological “trap” will produce petroleum — in unimaginable quantities. Sabatier reactions perform in much the same way with with CO2 instead of CO catalysts of Vanadium and Silica. CO2 methanation.
“Spectral, spatial-statistical, and graphical evidence that gravitational interaction with the Moon assists in driving Earth’s tectonic plates Part 1”D.Zbikowski, Institute for Celestial Geodynamics, January 2018
“A global forecast for great earthquakes and large volcanic eruptions in the next decade” D. Zbikowski, Institute for Celestial Geodynamics, Sept. 2018
—> “Movement of Earth’s rotational axis with respect to the globe generates motion of the north and south rotational poles upon the surface. Motion of the north rotational pole with respect to the net surface consists of roughly circular wobbles with a quasi-annual period. The wobbles of polar motion are formed primarily from two components-the free Chandler wobble (433 days) and the forced annual wobble (seasonal, 365 days).”
“Empirical evidence for stability of the 405 kiloyear Jupiter-Venus eccentricity cycle over hundred of millions of years.
D.V. Kent, P.E. Olsen, C. Rasmussen, et al, Rutgers University , May 7, 2018
—> “Every 405,000 years, gravitational tugs from Jupiter and Venus slightly elongate Earth’s orbit, an amazingly consistent pattern that has influenced our planet’s climate for at least 215 million years and allows scientists to more precisely date geological events like the spread of dinosaurs, according to a Rutgers-led study.”
“The Ability of Significant Tidal Stress to Initiate Plate Tectonics” by Zanazzi & Triaud, Jan. 2019
“Seismic monitoring reveals tidal stresses in the Earth’s crust”, C. Sens-Schönfelder, et al, Physics World, 15-April-2019
“The phenomenon of subduction is incompatible with Earth’s surface geometry and geomorphology” Lazlo Attila Horvath, July 2019
“Milankovitch (Orbital) Cycles and Their Role in Earth’s Climate”
Alan Buis, NASA Jet Propulsion Laboratory, February 27, 2020
“Tidal modulation of plate motions”
D. Zaccagnino, C. Doglioni, Earth-Science Reviews, June 2020
—> “While mantle convection is fundamental ingredient of geodynamics the driving mechanism of plate tectonics remains elusive. ….. GPS measurements are now accurate enough that, on long baselines, both secular plate motions and periodic tidal displacements are visible.”
—> “Tidal oscillations also correlate with the seismic release.”
“Solar system planetary alignment triggers tides and earthquakes”
S. Awadh, 2021
“Beyond Plate Tectonics”by James Maxlow. Book published 1-Dec.-2021
“Links of planetary energetics to moon size, orbit, and planet spin: A new mechanism for plate tectonics”
A. Hofmeister, Univ. of Washington (St. Louis), January 2022
—> “Tug of sun, moon could be driving plate motions on ‘imbalanced’ Earth”
“The hot zones of global Mw ≥ 5 earthquakes and their decadal migration during 1989–2019”
Jin Chen & Hong Tang, Journal of Geosciences, March 2022
“Precession helped drive glacial cycles in the Pleistocene.”
S. Barker, A. Starr, Geophysical Research Letters. 26-May-2022
GLOBAL-SCALE TIDAL FORCING AND PLATE TECTONICS HAVE BOTH SHAPED THE TECTONIC EVOLUTION OF EUROPA. C. E. Detelich, et al, 53rd Lunar and Planetary Science Conference (2022)
From Politico’s bog: “New U.S. message on climate change: Make China pay.” Is our President out of his mind— wait, wait, I guess that is already answered. He says the US will pay reparations if China does.
First of all, why would he think the US taxpayer should pay reparations. Why not ask the underdeveloped nations to pay reparations for our medical discoveries, our thousands of inventions that have made their life easier, our pitching in to save starving people that routinely occur in Africa, etc.
Moreover, reparations are hard to get right. China and India, combined, are emitting more CO2 than the rest of the world. Every nation in the world has been using some level of fossil fuel. Would we get to reduce our reparations payments for that?
Secondly, China will not do reparations. And thank God for that because if they did, Biden then would have us hoisted by his own petard.
And the third reason is that there is no crisis. It is an invention by the alarmists and the Great Reset group. Is the world warming? Yes, because the UAH satellite global temperature measurements tell me that.
For at least the last million years, the globe cycles, roughly, every 100,000 years between cold and warm. Does that without any SUVs on the road, by the way.
But I do not believe the alarmist’s computer forecasts of future temperatures. Those forecasts have always exceeded the actual global temperatures. The alarmists recognize this. That is why they changed the narrative from “global warming” to “climate change”. But still, they use those faulty forecasts.
And how do they know that we are really, really going to be sorry if, since the year 1890 until now the global temperature will have increased more than 1.5C. Their ability to make accurate predictions has been non-existent. Why should we believe this one?
So, the answer is too back off global catastrophe predictions and focus on doing adaptation when and if necessary. In the meantime, the Earth will continue to green because of the CO2 in the atmosphere.
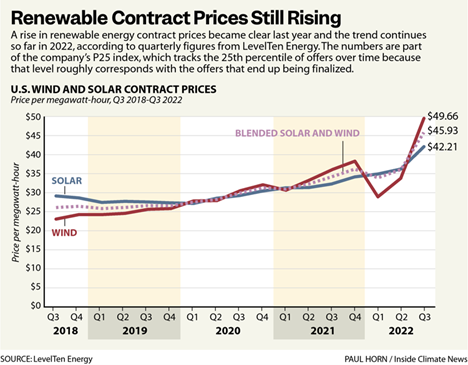
“The trend is unmistakable. Prices are rising—by a lot”.
“But the good news for the wind and solar industries is that their resources remain among the least expensive, largely because every major source of electricity is also experiencing a spike in costs. And the Inflation Reduction Act, passed in August, contains incentives for renewable energy manufacturers to build their products in the United States, which could set the stage for a new era of growth in the domestic supply of wind and solar components, and could help to reduce prices.”
I underlined the long sentence above because this drives me crazy. If renewables are least expensive—Why do they need subsidies? Well of course subsidies and being parasites on the backs of fossil fuels are the reason they appear like they are the” least expensive”. You might counter that big money people are building the wind turbines and the solar cells. So they must be good investments. We, the taxpayer are securing these investments. The Fed’s have made them almost impossible for the investors to loose any money. Really not just lose money but make big money. The Feds, not the market are driving the attempt at transition from fossil fuels to renewables..
But lets look at the Fed largesse. Robert Bryce posted “Talk about corporate welfare: Federal giveaways to wind, solar sectors are about to explode”. He reviews how much money is being given away based upon the approval of badly misnamed “Inflation Reduction Act of 2022”. Bryce focused on how the $370 billion in energy-related spending will be divvied up.
Click on Page 2 to go to read Robert Bryce’s posting.
The forecast global temperatures are the basis of the catastrophic global warming theory. The alarmists use temperature as the goal post when they tell us that the global temperature since 1890 must not rise more than 1.5 degrees Celsius. They say if the temperature exceeds that number, it could mean Armageddon. Surely you have heard them tell us that we have about 10 more years to live if we don’t act now. And telling our young people learning in schools that their life span is going to be very short.
So shouldn’t everyone be versed in how the forecasts of global temperatures are derived by the alarmists.
The alarmists have a bunch of computers with various settings that proport to be able to capture the vast number of variables that produce the Earth’s temperature. In fact, almost none of them provide a comparable forecast into the future. When plotted out the projections by the many computers looks like bed of spaghetti.
All the squiggly lines are individual computer forecasts. The Red line is the average global warming temperatures predicted by the computers. The lower Green straight line is the mean of the actual measured temperature for this same period. Note that as the years go by, the computer forecast gets further away from the actual measured temperature.
As aside observation, can you imagine what each line would look like if not mixed in with all the others. Can you imagine how much confidence you would have for a computer that predicted temperatures that would rise and drop so precipitously over very short times. Real temperatures don’t do that.
In science, it is said that if you have a theory and you make predictions from it and it does not match actual results, your theory is WRONG, So the alarmist’s temperature forecasts are wrong and should NOT be used to make public policy.
I have worked at this topic a number of times. Pretty much the same narrative. Secrets That Global Warming Alarmists Don’t Want You To Know https://wordpress.com/post/cb-dakota.com/108-Part 3 Biased Computers is a posting that shows how the computer programmers can make the temperature forecast hotter.
Cbdakota
The chart was made by Dr. John Christy. On many occasions he has given testimony before Congress.
Developed Nations will Not Fulfill Their Promises of Money to Underdeveloped Nations to combat Global Warming. Big battle to ensue at COP27.
This is not new, news. The energy crisis is crippling The EU economies. They have never fulfilled their promise to annually put big money in to the $100Billion fund for undeveloped nations to use to combat Global Warming. . And they won’t do it this year. The COP 27 will meet in Egypt and the sparks will fly.
A posting by Bloomberg “Global Climate Summit Is Heading for a Geopolitical Hurricane” provides the expected outcome of COP 27.