Category Archives: Solar Activity

Collapsing Consensus–Next Targets Are The Professional Societies


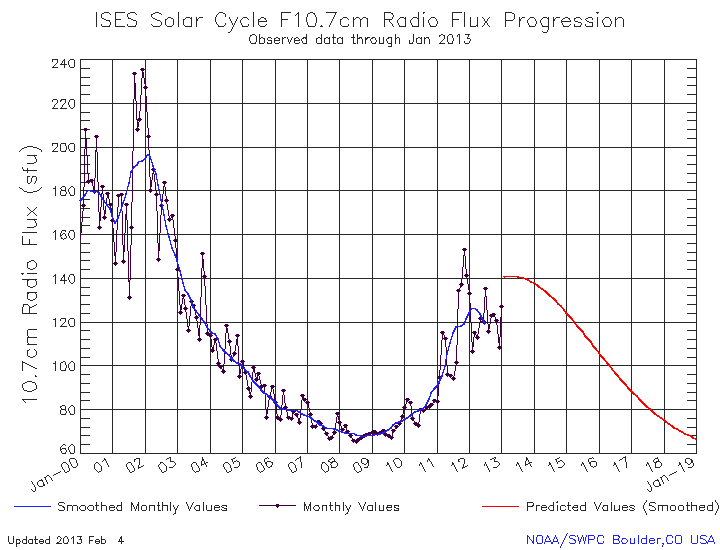
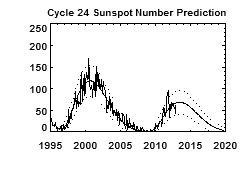
In my previous posting I wondered when the “consensus” scientists would begin to openly call into question the theory that CO2 is the primary forcing agent driving global warming. The longer the “pause” in global warming continues, (the IPCC head, Dr. Pachuri said the pause is now at 17 years), the harder it must be to steadfastly hold to the CO2 theory. Skeptics largely agree that CO2 is a forcing agent but have maintained that natural forces were probably the dominate force. In my opinion, the Sun is most likely the major forcing agent even though the exact mechanism has yet to be proven.

Continue reading

Solar Cycle 24 Update-January 2013


Solar Cycle 24 experienced a small uptick in the number of Sunspots and F 10.7cm solar flux in the month of January.  First the Sunspot chart:
solarcycle24sunspot4feb13
And the F 10.7cm solar flux chart:
solarcycle24f10.7cm4feb13

NASA Revises Cycle 24 Sunspot Prediction.


David Hathaway, NASA solar cycle expert, has a revised forecast for Solar Cycle 24 Sunspot number and Maximum timing.  In May 2012, he forecast the smoothed sunspot number maximum at 60 and the timing of the maximum as the spring of 2013.  His January 2013 Cycle 24  revised forecast is for 69 spots and maximum in the Fall of 2013.  He adds:
“ We are currently over four years into Cycle 24. The current predicted and observed size makes this the smallest sunspot cycle since Cycle 14 which had a maximum of 64.2 in February of 1906.”  
 jan13hathawayssn_predict
       Hathaway’s  NASA Revised January 2013 Sunspot Number Prediction

What Does The Leaked IPCC AR5 Reveal?


The second draft of the Fifth Assessment Report (AR5) of the Intergovernmental Panel on Climate Change (IPCC) was leaked to the internet on 13 December. It is generating a lot of discussion.  So far the main talking point seems be that the leaked report says that the Sun is as great a forcing agent as is CO2.  I scanned the “Summary For Policy Makers” (SPM) from the leaked draft.  I don’t see that view being reflected there. One of the 13 lead author of Chapter 7  “Clouds and Aerosols” was interviewed by Australia’s ABC TV network and he said Chapter 7 does not say the Sun is a major factor.  Chapter 8 “Anthropogenic and Natural Radiative Forcings”  also discusses this issue.  While I think that the Sun is a major forcing agent, much more powerful than CO2, I have little doubt that the final report will not say that.  Especially the SPM.  The full report is large and quite technical.  Most people do not read it and you can bet that no politician or journalist anywhere in the world will read the full report. So the SPM, in the past, ignored any scientific conclusion that did not fit the narrative of catastrophic man-made global warm. It will again.

Continue reading

Global Temperature Anomaly For November Shows Slight Drop


The UAH satellite global temperature data for November has been published by Dr Spencer.  It shows a slight drop.   See chart below.

UAH_LT_1979_thru_Nov_2012_v5.5

Considering that the Sun’s current Solar Cycle is one of the least active in years and that the experts are predicting the next Cycle to be even less active, I am guessing that the global temperatures will be trending lower over the next several years.   Probably below his 0.0 reference line.  We will have to wait and see.

cbdakota

10 Myths of Man-made Global Warming


Friends of Science list 10 reasons disproving the myths of man-made global warming.  I can not improve on their list so here it is in its entirety:
 
COMMON MISCONCEPTIONS ABOUT GLOBAL WARMING
 
MYTH 1:  Global temperatures are rising at a rapid, unprecedented rate.
FACT:  The HadCRUT3 surface temperature index shows warming to 1878, cooling to 1911, warming to 1941, cooling to 1964, warming to 1998 and cooling through 2011. The warming rate from 1964 to 1998 was the same as the previous warming from 1911 to 1941. Satellites, weather balloons and ground stations all show cooling since 2001. The mild warming of 0.6 to 0.8 C over the 20th century is well within the natural variations recorded in the last millennium. The ground station network suffers from an uneven distribution across the globe; the stations are preferentially located in growing urban and industrial areas (“heat islands”), which show substantially higher readings than adjacent rural areas (“land use effects”). Two science teams have shown that correcting the surface temperature record for the effects of urban development would reduce the warming trend over land from 1980 by half.
There has been no catastrophic warming recorded.


MYTH 2:  The “hockey stick” graph proves that the earth has experienced a steady, very gradual temperature decrease for 1000 years, then recently began a sudden increase.
FACT:  Significant changes in climate have continually occurred throughout geologic time. For instance, the Medieval Warm Period, from around 1000 to1200 AD (when the Vikings farmed on Greenland) was followed by a period known as the Little Ice Age. Since the end of the 17th Century the “average global temperature” has been rising at the low steady rate mentioned above; although from 1940 – 1970 temperatures actually dropped, leading to a Global Cooling scare.
The “hockey stick”, a poster boy of both the UN’s IPCC and Canada’s Environment Department, ignores historical recorded climatic swings, and has now also been proven to be flawed and statistically unreliable as well. It is a computer construct and a faulty one at that.

Solar Cycle 24 Is Underperforming Its Predecessors


Solar Cycle 24 is underperforming its predecessors, Cycles 21, 22 and 23. The chart below, using sunspots as proxy for solar activity, shows the progress for Cycles 21, 22 and 23 over their nominal 11 year life cycle. Solar Cycle 24’s current progress is clearly less active than 21, 22 or 23. This level of activity, if it continues at its current pace, will be the least active Solar Cycle in the last 100 years.The chart maker is Solen. (Click on the chart for clarity.)

<am,.

How much longer will Cycle 24 go before its maximum activity occurs and quiets down? Experts are forecasting that in the first part of 2013. When the maximum occurs the Sun’s poles switch. So if you want to make your own guess, lets look at how close the poles are to switching right now. The chart below records the position of the North and South poles with time. The three previous Cycles polar locations are shown and you can see when the poles swapped sides. Cycle 24 poles are drawing near that now and it seems likely they will switch soon. If so, it will be a very weak–solar activity–Cycle. (Click chart for clarity.)


Solar Polar Field – Wilcox Solar Observatory (WSO) – 1976 to Present

Solar experts are predicting that Cycle 25 will be less active than 24. In the past, several Cycles with such low solar activity were associated with cooling global temperatures. The global temperature has plateaued for the past 15 to 16 years. The Warmers say that it has to go at least 20 years to disprove their CO2 man-made global warming theory. We may be heading for a period that will be much longer than 20 years of plateaued or even falling global temperatures. This should send the CO2 theory to the trash bin, but it does not necessarily bode well for mankind. Cooler global temperatures have not provided the era of plenty we now enjoy. Food production will likely be less than optimal and that can’t be a good thing with the continued growth of global population.
cbdakota

No Global Warming For 16 Years


On October 13, 2012 the UK’s Daily Mail posted:  Global warming stopped 16 years ago, reveals Met Office report quietly released… and here is the chart to prove it”.  My posting of several months ago (July 19, 2012) How Many Years Of No Global Warming Are Required To Disprove CO2 As The Primary Factor In Global Warming? reported this pause.  The Daily Mail’s posting is worth a read as it contains interviews with the head of the University of East Anglia’s Climate Research Unit,  Dr. Phil Jones and Professor Judith Curry from Georgia Tech. 

“Some climate scientists, such as Professor Phil Jones, director of the Climatic Research Unit at the University of East Anglia, last week dismissed the significance of the plateau, saying that 15 or 16 years is too short a period from which to draw conclusions.

Others disagreed.  Professor Judith Curry, who is the head of the climate science department at America’s prestigious Georgia Tech university, told The Mail on Sunday that it was clear that the computer models used to predict future warming were ‘deeply flawed’.

Even Prof Jones admitted that he and his colleagues did not understand the impact of ‘natural variability’ – factors such as long-term ocean temperature cycles and changes in the output of the sun. However, he said he was still convinced that the current decade would end up significantly warmer than the previous two.”

Professor Curry’s statement about computer models is spot on.  Jones, however, is not about to give up the source of his income (climate research money) which requires that he and his colleagues continue to alarm and frighten people.

Several other excerpts from the Mail’s posting:

 “Professor Phil Jones, director of the Climate Research Unit at the University of East Anglia, who found himself at the centre of the ‘Climategate’ scandal over leaked emails three years ago, would not normally be expected to agree with her. Yet on two important points, he did.

The data does suggest a plateau, he admitted, and without a major El Nino event – the sudden, dramatic warming of the southern Pacific which takes place unpredictably and always has a huge effect on global weather – ‘it could go on for a while’.

Like Prof Curry, Prof Jones also admitted that the climate models were imperfect: ‘We don’t fully understand how to input things like changes in the oceans, and because we don’t fully understand it you could say that natural variability is now working to suppress the warming. We don’t know what natural variability is doing.’

Yet he insisted that 15 or 16 years is not a significant period: pauses of such length had always been expected, he said.

Yet in 2009, when the plateau was already becoming apparent and being discussed by scientists, he told a colleague in one of the Climategate emails: ‘Bottom line: the “no upward trend” has to continue for a total of 15 years before we get worried.’

But although that point has now been passed, he said that he hadn’t changed his mind about the models’ gloomy predictions: ‘I still think that the current decade which began in 2010 will be warmer by about 0.17 degrees than the previous one, which was warmer than the Nineties.’

Only if that did not happen would he seriously begin to wonder whether something more profound might be happening. In other words, though five years ago he seemed to be saying that 15 years without warming would make him ‘worried’, that period has now become 20 years.”


The author of the posting, David Rose makes the following comment:

 Yet it has steadily become apparent since the 2008 crash that both the statistics and the modelling are extremely unreliable. To plan the future around them makes about as much sense as choosing a wedding date three months’ hence on the basis of a long-term weather forecast.”

Solar Cycle 24 is indicating the least active Sun in the past 100 years.  Most solar scientists predict that Solar Cycle 25 will be even weaker than Cycle 24.  What does this mean?  Such performance in the past has resulted in “solar minimums” that coincided with significantly lower global temperatures. The correlation of solar activity (often indicated by number and size of the sunspots) and global temperatures has been very good over the centuries. 

To read more of the Daily Mail posting: http://www.dailymail.co.uk/sciencetech/article-2217286/Global-warming-stopped-16-years-ago-reveals-Met-Office-report-quietly-released–chart-prove-it.html#ixzz29U2Gb6uW

To read my posting “How Many Years Of No Global Warming Are Required To Disprove CO2 As The Primary Factor In Global Warming?” click here:https://cbdakota.wordpress.com/2012/07/19/how-many-years-of-no-global-warming-are-required-to-disprove-co2-as-the-primary-factor-in-global-warming/

cbdakota

NASA’s Stereo Mission Captures CME–Fastest Ever Recorded


On 23 July 2012, NASA’s Stereo **Mission spacecraft recorded a coronal mass ejection (CME).   The cloud of solar material ejected from the Sun sped out into space at a speed of “between 1,800 and 2,000 miles per second”.  That translates to about 7.2 million miles per hour or about 1.1% of the speed of light.  NASA says it is probably the fastest CME ever measured by any spacecraft.  Incredibly,  it is said that, on average,  the mass ejected into space is  1.6×10¹²kg.   A video of the  23 July CME can be seen by clicking here.

From the NASA announcement of this event:

“Measuring a CME at this speed, traveling in a direction safely away from Earth, represents a fantastic opportunity for researchers studying the sun’s effects. Rebekah Evans is a space scientist working at Goddard’s Space Weather Lab, which works to improve models that could some day be used to improve predictions of space weather and its effects. She says that the team categorizes CMEs for their research in terms of their speed, with the fastest ones – such as this one — labeled “ER” for Extremely Rare.”

**The STEREO mission consists of two spacecraft with orbits that for most of their journey give them views of the sun that cannot be had from Earth. Watching the sun from all sides helps improve our understanding of how events around the sun are connected, as well as gives us glimpses of activity we might not otherwise see.

cbdakota

Solar Cycle 24 Update July 2012


Solar Cycle24 July sunspot and F 10.7cm radio flux numbers are up slightly from June.  Pretty much in line with the activity projection and much below that of Solar Cycle 23. (Click on Graphs for Clarity)

Large Filament on the Sun

The Sun currently has a filament that stretches more that 400,000km across the face. Filaments are formed in magnetic loops that hold relatively cool, dense gas suspended above the surface of the Sun. Because they are cooler than the photosphere they can look dark.

courtesy of solarham.net

But when viewed in profile they look like a giant loop, called a prominence.

courtesy of NASA

Occasionally when these filaments collapse,  a coronal mass ejection (CME) can occur.   Because the filament is looking directly at the Earth,  a CME could cause problems.   Lets hope this does not happen.

cbdakota