
Solar Cycle 24 experienced a small uptick in the number of Sunspots and F 10.7cm solar flux in the month of January. First the Sunspot chart:

And the F 10.7cm solar flux chart:
Cycle 24’s maximum is nearing. Sometime this year, probably sooner than later. Because the Sun’s poles reverse at the time of the maximum, the following chart shows that both north and south are converging at the Sun’s equator which would suggest an immanent reversal:

courtesy of Wilcox Solar Observatory and Leif Svalgaard
The solar experts generally are forecasting that Cycle 25 will be less energetic than Cycle 24. Looking at the collapsing pattern of the Solar Cycles, 25 may really be a pygmy.

courtesy of Solen.info/solar/
Finally for those who follow the Livingston and Penn prediction of loss of sunspots all together, here are the plots of sunspot umbral intensity and magnetic field. If you remember, the two scientists speculate that sunspots do not form when the magnetic field strength is less than 1500 Gauss. Look at the dots which represent sunspots. Note that the dots seem to be limited to the 1500 Gauss line.
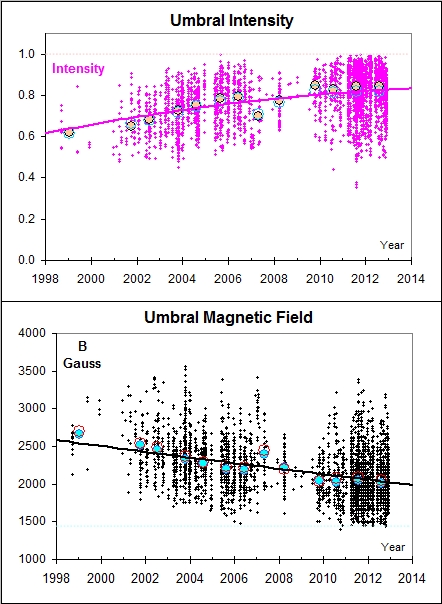
Courtesy of Leif Svalgaard
The intensity is the inverse. Sunspots are slightly colder that the rest of the Sun’s surface and thus they look “black”. If the Sunspots are getting brighter, that means they are getting hotter, and at some point they will become hot enough to be invisible.
If you are interested in some additional discussion of their theory, click here.
cbdakota

It looks mightily to me as if cycle 24 had its maximum already – late 2011!!!!