Category Archives: CO2

The Science Is Settled Myth: Part 2 Stop Energy Transition


World Climate Declaration. 

Proving that there isn’t a 97% scientist’s consensus, there are One thousand nine hundred and forty-four scientists, engineers, Noble prize winners and other accredited people that have signed the WORLD CLIMATE DECLARTION and their statement is “There is no climate emergency”. You are not hearing much from these 1944 experts, and you can rightly blame that on the government that provides study money almost only to people who follow the narrative that there is a climate emergency.  And when someone publishes a paper saying that there is no climate emergency, they are ignored by the media who also follow the narrative that there is a climate emergency.

The Declaration scientists on this issue is: “OUR ADVICE TO THE WORLD LEADERS IS THAT SCIENCE SHOULD STRIVE FOR A SIGNIFICANTLY BETTER UNDERSTANDING OF THE CLIMATE SYSTEM, WHILE POLITICS SHOULD FOCUS ON MINIMIZING POTENTIAL CLIMATE DAMAGE BY PRIORITIZING ADAPTATION STRATEGIES BASED ON PROVEN AND AFFORDABLE TECHNOLOGIES. The good news is that we have time to work this out. There is no evidence that we are in danger of a catastrophic event. Rational climate scientists do not see an apocalyptic ending for Earth, by CO2 emissions. 

Extreme Weather

The average citizen has heard that Green House Gases (GHG) are warming the globe.  They probably do not fully understand how GHGs are supposed to work.  But they have been convinced that Extreme Weather, as advertised by the alarmists and the media, is caused by GHGs.  Hurricanes, for one extreme weather, are believed to be increasing.   Is that true?  No, it isn’t true. Cyclones, called hurricanes and typhoons, happen all over the globe.  Typhoons are as strong as any hurricane.  As a personal experience, I got lucky to get a flight out of Tawain a day before a major typhoon that came ashore.

 The following chart is a measure of Accumulated Cyclone Energy (ACE) hurricane and typhoon strength.

Figure: Last 50-years+ of Global and Northern Hemisphere Accumulated Cyclone Energy: 24 month running sums. Note that the year indicated represents the value of ACE through the previous 24-months for the Northern Hemisphere (bottom line/gray boxes) and the entire global (top line/blue boxes). The area in between represents the Southern Hemisphere total AC

.

Source Global Tropical Cyclone Activity
Dr. Ryan N. Mau
e

The high point of ACE occurred in the mid-nineties and has fallen off over the following years 30 years.  This refutes the concept that hurricanes and typhoon’s ACE is a function of rising global temperatures.

Alarmists and the Media

There is no emergency.    Yes, this contradicts what the media is saying, but polls show that almost nobody trusts them. The media takes the word of climate alarmists and then amplifies it. The media seems never to go back and reviews all the alarmists’ predictions that have largely failed. If they did, there is a chance that they might not file those stories. WUWT has a repository of the many predictions the alarmists have made and are shown to be wrong.  Several other looks at their bad predictions can be accessed by clicking here and here.   As people are made aware of these misses, they lose trust in the media.  So much for non-investigating reporters.  May they drive media’s believability lower.

Extreme Weather

So, what is the evidence?  Let’s start with extreme weather again.

The International Panel on Climate Change (IPCC) is the UN’s scientific body studying the so called “manmade” climate change. While they do not study natural causes, some of their work is useful.   The alarmists make every weather story out to be evidence of impending doom, however, the IPCC says that they do not have any confidence that most of the weather events are caused by climate change.  Roger Pielke,jr posted “What the IPCC Actually Says About Extreme Weather”.  Pielke’s posting has a chart from the IPCC showing what they have confidence in is due to climate change and what they do not have confidence in.  I have picked several of the weather conditions that the IPCC does not have confidence are caused by climate change:

River Flood

Heavy Precipitation

Agriculture Ecology Drought

Severe Windstorms

Tropical Cyclones (aka Hurricanes and Typhoons)

Heavy Snowfall and Ice Storms

Relative Sea Level

Coastal Flooding

That surely takes away most of the media narrative about “severe weather” being caused by man-made climate change.


Evidence that Alarmists are not playing square with the public.

This is perhaps their biggest whopper.

Their long-range predictions are predicated on sharp increases in global temperatures.  Everything is melting, sea levels rising, massive loss of flora and fauna, great numbers of people having to migrate north, etc.  So where do these predictions of high temperatures come from.  Why, they come from a group of programed computers.

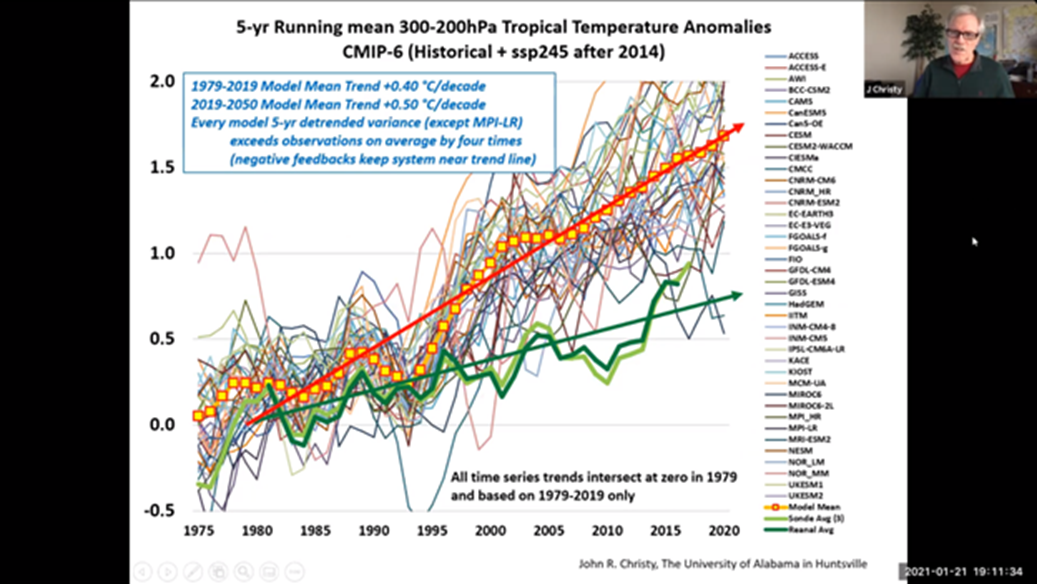
See the chart below:

The red line is the average global temperature forecast made by the group of programed computers.

 The squiggly lines are the individual computer output (They are shooting up and ramping down wildly. Hard to take seriously.) 

The green line is actual measured temperatures by satellites.  These satellite temperature measurements have been verified by weather ballons. 

Dr John Christy notes that the programed computer’s temperature trend is +0.50C per decade. That would mean that from 2019 to 2100 the temperature would rise about 4C.  

The satellite temperature trend is +0.15C from 2019 to 2100 about +1.2C.

Who do you want to believe—actual temperature measurements or a pack of programed computers?

The 1944 scientist, etc., weigh in on these computer made predictions:

“To believe the outcome of a climate model is to believe what the model makers have put in. This is precisely the problem of today’s climate discussion to which climate models are central. Climate science has degenerated into a discussion based on beliefs, not on sound self-critical science. Should not we free ourselves from the naive belief in immature climate models”

CO2 Saturation Curve

Another reason to believe we have years of time before a transition is needed, if at all.

For those that believe atmospheric carbon dioxide (CO2) is driving the global temperature up, you can be consoled that as more CO2 collects in the atmosphere it has a less warming effect. The chart below is somewhat dated but that doesn’t change the concept.  The current saturation of atmospheric CO2 is about 425 parts per million.

Natural Causes Creating temperature Rises

A remarkable paper has been published in The American Journal Of Economics and Sociology and the authors are Andy May and Marcel Crok. It is titled “Carbon Dioxide and Warming Climate are Not a Problem.  The paper covers a number of  issues  I liked the proof of natural cause using ocean cycles.   From that paper comes:

Since general circulation climate models and the modern CO2 and greenhouse gas warming hypothesis were developed in the 1960s and 70s many natural climate oscillations have been discovered. These long-term climatic oscillations and the resulting “climate regime shifts” strongly suggest that natural forces, possibly driven by cyclic changes in the Sun, are causing some of the recent global warming observed since 1920, or even earlier. It is beyond the scope of this paper to detail all the natural ocean oscillations discovered and described in the past few decades, but one of the major, and most important, oscillations is the Atlantic Multidecadal Oscillation (AMO), first named by Richard Kerr in 2000 but formally described by Stephen Gray and colleagues in 2004. The AMO has a very strong climatic signal and has been around since at least 1567AD, so it clearly does not have a human cause.

The authors start with a recognized temperature anomalies chart.  The presumed start of the fossil fuel use age was 1870. The baseline was set at about -0.4 above that temperature. The anomaly is “easy to see” changes in temperature.,. On your standard thermometer, change from 1901 measured temperature to the forecast 2101 temperature. The change would not be noticeable.

The anomaly:

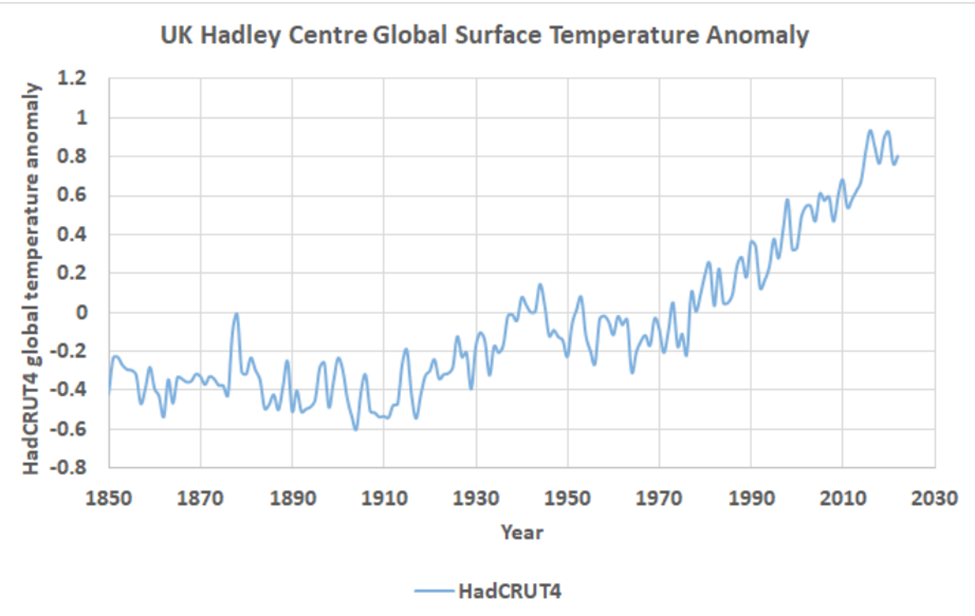
The AMO, which is based on North Atlantic sea-surface temperatures is plotted below. 

A graph showing the number of amo detrended

Description automatically generated

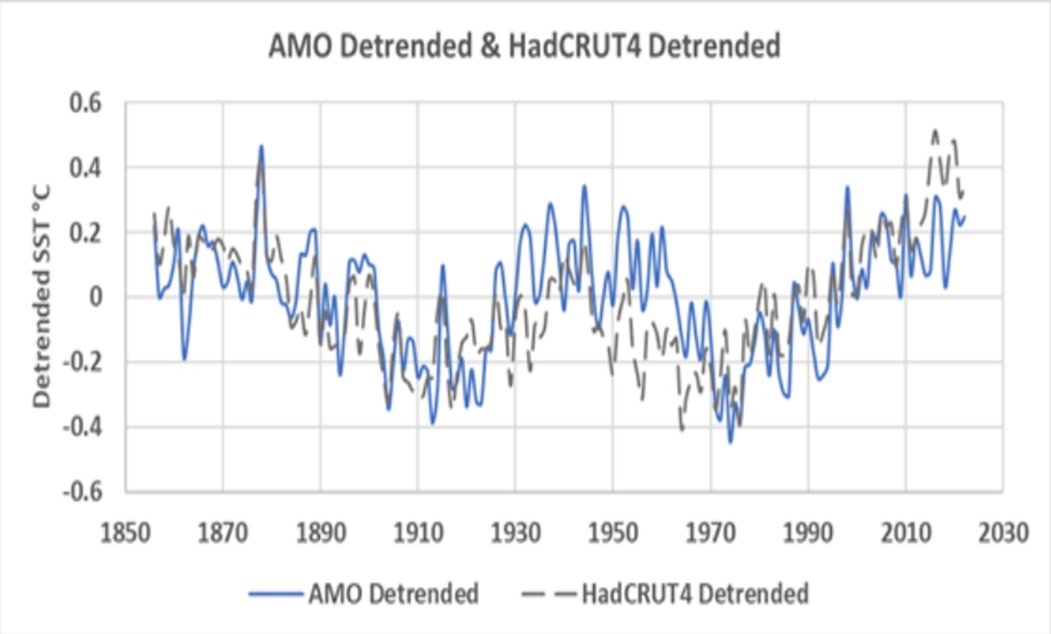
Figure 2. The Atlantic Multidecadal Oscillation (AMO) plotted in its raw form (top) and as a detrended index (bottom plot). The HadCRUT4 global temperature average record has also been detrended and overlain, as a gray dashed line, on the detrended AMO. Data from NOAA

There are several key features displayed in figure 2. First, we observe that the secular trend in the AMO of 0.3°C is about 30% of the warming observed globally in the 20th century. Next, we observe that the warming period from 1980 to 2005 coincides with an upturn in the AMO index. The AMO index has been traced to 1567AD, thus it is a natural oscillation. These observations cast some doubt on the AR6 claim that all 20th century warming is due to human influence and there is no net natural impact.  The second feature we will point out in figure 2 is that the full AMO climate cycle is 60-70 years, and it matches the estimated global temperature changes in the 20th century. To make this comparison easier, the HadCRUT4 record from figure 1 is also detrended and overlain as a gray dashed line in the lower plot of figure 2. What if the so-called human-caused warming from 1976 to the present day was boosted by a natural cycle? It would mean that the IPCC calculation of the impact of human greenhouse gases was too high, just as their calculation of tropical tropospheric warming is too high, something they admit in AR6.

 The Carbon Cycle

I find that many do not know what the carbon cycle is and the place in the cycle that man made emissions are accounted. 

The Wikipedia Chart for the “carbon** cycle” shows “man made” and natural emissions.  In the center, in red, is the fossil fuel etc. man-made emissions, 9 gigatonne of carbon in the year.  The presummed “natural” emissions are illustrated by the white arrows pointing upward, and the total is 210 gigatonne of carbon in the year. The natural carbon in circulation is very much larger than the man-made carbon.  Then 210 gigatonnes  returns to the oceans and plants. However, not all the manmade carbon stays in the atmosphere it is estimated, some returns, 3 gigatonne, to feed new plants and some, 2 gigatonne going in to the oceans. Now the theorized trouble maker remaining in the atmosphere is 4 gigatonnes.  (** Converting the carbon to carbon dioxide is to multiply by 3.3.  The chart was made several years ago. The concept is still good.)

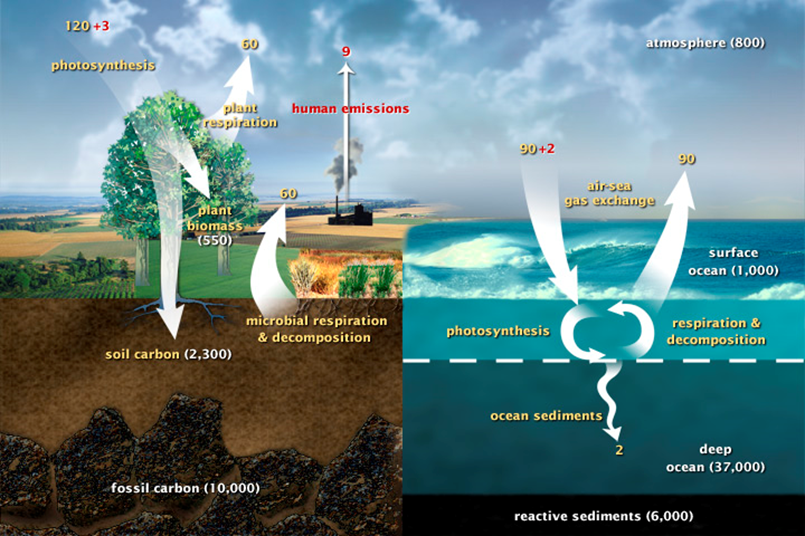
Some may not recognize how much 425 parts per million(ppm) are.  425ppm converted to percent, is 0.0425%. 

The Earth’s atmosphere is nominally—Nitrogen= 78 %, Oxygen =21%,  Argon=1%  and  CO2= 0.0425%.  Not much of that CO2, huh.

Summary

As every year  goes by the alarmists should realize the harm they are doing to science and their profession.  I think the media should recognize the low standing  they have but  perhaps they may be to juvinile to do that.  

The science is not settled.  Their many failed predictions have demonstrates that their “science” is not proven.  Their “science” is made of fear mongering.  Every weather event that they claim to be evidence is not supported by the IPCC and demonstrated data. Be it hurricanes or Arctic Sea ice.  The predicted  global temperatures produced by  a group of computers way over shoots the actual measured temperature.  And they refuse to make corrections..    The World Climate Declaration statement is on the mark. I repeat it:

“OUR ADVICE TO THE WORLD LEADERS IS THAT SCIENCE SHOULD STRIVE FOR A SIGNIFICANTLY BETTER UNDERSTANDING OF THE CLIMATE SYSTEM, WHILE POLITICS SHOULD FOCUS ON MINIMIZING POTENTIAL CLIMATE DAMAGE BY PRIORITIZING ADAPTATION STRATEGIES BASED ON PROVEN AND AFFORDABLE TECHNOLOGIES.”

Part 3 will begin examination of electricity and wind and solar power generation.

cbdakota

 WE MUST REVERSE ENERGY TRANSITION, NOT JUST STOP IT.


Subscribe to continue reading

Subscribe to get access to the rest of this post and other subscriber-only content.

Natural Causes For Weather Changes


I post “Essay # 1 – Solar & Planetary Tidal Pumping – The Real Cause for Changes in Weather (Original Issue Dec. 18, 2023, Revised May 23, 2024 – Richard Cronin)” because I believe he has made interesting concepts regarding natural forces and weather.

An invisible force permeates the Universe. You don’t even think about it. Gravity and the ever-changing distances between major celestial bodies and Earth, causing Tidal Pumping which drives tectonics, volcanism, and changes to weather and climate.

It is very well known that Jupiter’s massive gravity field heats the moons Io, Ganymede, and Europa to drive extensive volcanism as they proceed through their elliptical orbits. Io is the most volcanic celestial body in the solar system. In fact, per recent NASA observations, these moons pump one another. This phenomenon is called Tidal Pumping or Tidal Heating. The Earth is affected in just such a manner by all major celestial bodies from the Sun out to Jupiter (Kent & Olsen, 2018).

Observe the animation of our Solar System with the gravity fields of the Sun and major planets flinging the Earth around in a helical or corkscrewing action. Neither Newton, Kepler, nor Einstein had any awareness of this motion and how it imposes stresses on the Earth’s crust, opening up Earth’s tectonic plates to spill immeasurable seismic heat into the South Pacific. This is the source of the El Nino Southern Oscillation (ENSO).  See video, Key word search: Helical Solar System.

).  See video, Key word search: Helical Solar System.

Gravitational effects within the Solar System drive Tidal Pumping for the short term El Nino Southern Oscillation (ENSO). Orbiting the Milky Way and passing close to other massive stellar systems drives much greater Tidal Pumping effects and Ice Ages.

Completely unappreciated in the energy balance of the Earth and gravitational force are at least five (5) phenomena. Perhaps just as important is that these effects are not uniformly distributed. There are about 40 to 50 “hot spots” globally. Hawaii, Iceland, Samoa, Yellowstone, Campi Flegrei (Naples), the Gulf of Guinea off Africa, and the Gulf of Maine. Due to the El Niño initiated in 2023 the Gulf Stream and the Gulf of Maine were quite warm and had the adherents of Anthropogenic Climate Change alarmed. In past epochs the Gulf of Maine was quite volcanic, like Yellowstone. In fact, Hawaii and Iceland “co-pulsate”. (Mjelde, Faleide 2009)

The variances in gravitational forces from the Sun and even out to Jupiter exert Tidal Pumping forces on Earth’s crust, which is quite thin and fragile, thus spilling seismic heat into the South Pacific and drive the El Niño Southern Oscillation (ENSO). Jupiter and Venus exaggerate the eccentricity of Earth’s orbit on a 405,000 year cycle (Kent, Olsen, et al 2018 Rutgers). Think of squeezing and re-squeezing a hard rubber ball and it heats up. This is what stirs seismic activity. The interior of the planet is not rigid and  unyielding. It is ductile and elastic with large reservoirs molten silicates and carbonates in the Upper Mantle as well as the molten Iron/Nickel Outer Core. The molten carbonates decompose by sulfur-based acids percolating up from the Lower Mantle. From penetrating radar observations it has been identified that lying 350 km below Yellowstone is a reservoir of molten carbonates measuring 25 km to 70 km thick and covers the area of Mexico. Researchers from the University of London estimate that if just 1 % of this reservoir were to decompose, it would be equivalent to burning 2.3 million barrels of oil.  The EPA now estimates that the Upper Mantle contains 100 trillion million metric tons of carbon in the Upper Mantle locked in carbonate minerals, which is decomposing under acidic attack. Moreover, it is now known that the core of the planet is not solid. It is the consistency of mushy butter, comprised of “superionic Iron” in constant motion. This is the real source of the Earth’s magnetic field (Butler & Tsuboi, 2021 / Sun & Kim, 2022 / He & Lin, 2023)

As the Solar System orbits the Milky Way, the Earth is flung about between the Sun and Jupiter the tail of a kite. The Earth is like a strip of cloth tied onto the tail. Tremendous stresses on Earth’s crust. Neither Newton, Kepler, nor Einstein were aware of this phenomenon.

The Sun’s gravity field pumps the Earth as we proceed through the Northern Hemisphere’s Winter Solstice (the Southern Hemisphere swings closest to the Sun) and, two weeks later, the Perihelion (the Earth’s closest approach to the Sun). These combined events rip and tear open the Trenches of the Ring of Fire to inject quantities immeasurable quantities of seismic heat into the waters of the South Pacific to drive the El Niño Southern Oscillation (ENSO). The key stress points are the two terminal points of the Ring of Fire, the Tonga Trench. In addition to the Tonga Trench, the New Hebrides Trench and New Britain Trench drive the La Niña and the Peru/Chile trench drives the El Niño.


The line of latitude of the deepest point of the Tonga Trench, the Horizon Deep, lies at 23.3 degrees South latitude. The deepest point of the Peru/Chile Trench, the Richards Deep, lies at approx. 23.2 degrees South latitude. Earth’s current Obliquity, the angle of inclination is about 23.4 degrees. The Osbourne Trough associated with the Tonga Trench lies at 25.5 degrees South latitude This is nominally the line of maximum, maximum Tidal Pumping stresses across the South Pacific.

From 1989 to 2018, the pattern of Richter 5+ earthquakes has migrated from the New Hebrides Trench towards the Tonga Trench and from the Central American Trench towards the Peru-Chile Trench. (Chen & Tang, 2022).

Focus on Mid-Oceanic Ridge (MOR) systems is inappropriate. Seismic heat injection from plate fractures and hydrothermal vents along ridge systems or on the abyssal plain is readily diluted and the heat is dissipated. Arising from the trenches the column of warm waters remains relatively intact and is carried east to west as it approaches the surface. There is a subsurface plume effect. This is observed in the elevated sea surface temperatures, with the Torres Strait and Bismarck Sea show the greatest warming. See records of maximum sea surface temperatures in these regions, Sept. 2022.

As opposed to Mid-Oceanic Ridge systems, Trench systems cutting through continental shelves are particularly noteworthy. The continental shelves were the beaches formed during the Ice Ages. They are nearly a uniform 140 meters below current sea level, relatively shallow. The Peru-Chile Trench cuts through the continental shelf of South America at depth of 145 meters below current sea level.

The onset of the El Niño is signaled by a cold water upwelling along the coast of Peru and Chile. This is due the melting of methane clathrates beneath the ocean floor from the opening of the Peru/Chile Trench (J. Kamis – “Plate Climatology”). Frozen methane clathrates exist between 100 to 1000 meters below the ocean floor. This cold upwelling brings up deep water fish from the Humboldt Current. Due to the east-to-west plume effect, the surface waters of the central Pacific warm first, then spread eastward as the clathrate melting diminishes.

In 2021/2022, the Winter Solstice was DE. 21,2021. The Perihelion was Jan.4 2022.


On Jan. 15, 2022 the Tidal Pumping stresses which had accumulated over a rather lengthy La Niña ripped loose in the Tonga Trench in the southwest Pacific. The largest submarine volcano ever observed spewed an estimated 50 to 150 million tons of water vapor into the atmosphere. The Pacific continued to warm throughout 2022, aided by Jupiter’s closest approach to the Earth in 59 years which occurred on Sept. 26, 2022.  A giant hand turned up the steam vaporizer to the maximum setting so 2023 was deemed to be the “Hottest Year on Record”.

With the stresses relieved in the southwest Pacific, the Tidal Pumping stresses shifted to the Eastern Pacific, opening up the Peru/Chile Trench and other seismically active regions off South America to drive the 2023 El Niño. Typical of an El Niño there were no hurricane landfalls on the U.S. East Coast in 2023 tropical storms were steered out into the North Atlantic, although Tropical Storm Ophelia flooded New York City in Sept. 2023. That moisture still affects us as we proceeded into early 2024, with ample rain and mudslides in California, record snows at ski resorts around the world during the winter of 2023/2024and a cool rainy spring in Delaware.

It is bewildering how Svente Arrhenius (1896), Gilbert Plass (1956), and continuing through today’s pseudo-scientists have ignored or misunderstood water in their analyses, especially phase change and the Second Law of Thermodynamics.  Doesn’t anybody understand the cooling effects of the water cycle ? Arrhenius held the global absolute humidity at a fixed 10 grams per cubic meter. Plass entirely ignored the radiative effects Long Wave Infrared Radiation (LWIR) from cloud tops due to phase change. Condensation to rain and freezing to snow. The Earth’s surface temperature is controlled by low clouds (Kauppinen & Malmi, 2019). The Earth is the Water Planet. If you heat up on the planet’s surface, for whatever reason, you evaporate more water to provide more cooling via the water cycle. Such is the case of the 50 to 150 million tons of water vapor spewed out of the largest submarine volcano ever observed in the Tonga Trench on January 15, 2022. The steam reached the stratosphere. These waters continued to warm through 2022, aided by Jupiter’s closest approach to Earth in 59 years on Sept, 26, 2022  followed by precipitation and cooling in the winter of 2023/2024

An entirely separate discussion is necessary regarding the heat producing (exothermic) geochemical reactions inside the planet which are entirely ignored in the current heat balance of the Earth. Logically, Tidal Pumping should impart mixing for multiple exothermic geochemical reactions, such as decomposition of carbonates, serpenization to generate Hydrogen, plus Fischer-Tropsh and Sabatier reactions to generate hydrocarbons. There are really only two (2) “fossil fuels” – lignite coal produced from peat bogs and wetlands plus Kerogens produced by algae and phytoplankton wedged into shales. Indeed, the internal heat of the Earth resolves the Faint Young Sun Paradox, wherein photosynthetic life emerged approx. 3.5 billion years ago when the Earth should have been frozen solid, with no liquid water on the surface. At that time, the Sun was only 70 % of its current luminosity.


Further reading: “The Chthonian Planet – Why Life Exists on Earth (Human Activity in No Way Affects the Weather nor Climate – Issue Date March 17, 2023)”
Key word search: Chthonian Planet Cronin SSRN

Richard F. Cronin, BChE, MBA, P.E. (retired), 30 years E.I. DuPont de Nemours

cbdakota


If


Reliable Electric Energy Is Being Threatened By EPA And The States.


Subscribe to continue reading

Subscribe to get access to the rest of this post and other subscriber-only content.

The Basis for a Significant Amount of Global Warming Research has become Untethered from the Real World.


.

On November 30, 2020 Roger Pielke, jr  posted “The Unstoppable Momentum of Outdated Science”. It was subtited : “Much of climate research is focused on implausible scenarios of the future, but implementing a course correction will be difficult”.  

It is almost a year and a half since posting but the problem still exists. 

EVs are Evil


I am rebloging a posting by Issues & Insights titled:

“Its Time to Admit IT:EVs are Evil”.

The authors zero in on these issues:

  • They are not Zero emissions.
  • They are not cheaper to operate.
  • They are built with slave labor.
  • They are environmental rapists.

To read it as I & I wrote it click here.

cbdakota

If 2035 Car Sales are 100% EV, 83% of All Cars on the Road Will Still be Gasoline or Diesel Fueled.


President Biden has called for 50% of all new car and light truck sales be Zero Emission Vehicles (ZEV) by 2030. Even more draconian laws from States like California say:

“…….. all new cars sold in the state by 2035 be free of greenhouse gas emissions like carbon dioxide”. 

That means no gasoline vehicle sales can be made in California after 2035.

What is the outcome of these proposals that only allow ZEV to be made? The Fuels Institute, a proponent of the man-made global warming, posted “Reducing carbon emissions effectively-now and tomorrow” has the answer.   The charts premise is that of California’s pathway, meaning 100% of new car sales are ZEVs and no new fossil fuel powered cars can be sold.

As the chart shows, in a hypothetical scenario in which all U.S. light duty vehicle sales are required to be ZEV in 2035, the market would likely only convert 16.5% of vehicles in operation to ZEV by that time. This would leave 83.5% of vehicles in 2035 still operating primarily on liquid fuels used in combustion engines with a potential life expectancy of longer than 20 years. This means that BEVs and a cleaner electricity grid will not be able to significantly cut transportation-related CO2e emissions for many years to come, resulting in increased atmospheric concentrations that will linger for another 100-plus years

It might be possible for the manufacturers to make enough ZEVs, but it may not make any difference if the manufacturers can. The cost, the range anxiety, the charging time, fires, etc. have turned off the common man buying ZEVs so far.

cbdakota

Skeptics Need a Platform to Spread Their Science


Open Letter to Speaker of the House of Representatives.

Speaker Kevin McCarthy

Your leadership regarding Climate Change is very important.  Your members must weigh in on the nearly a half of trillion dollars of subsidies for the so-called renewable energy projects and directing legislation to stop the urge of the Democrats to rush headlong into unproven schemes to replace fossil fuels.

It looks like you are off to a good start.  Headline on blogs such as thisGOP-Led House Panels Shift Gears, Goes Full Throttle For Domestic Energy Production.”    

Your Email for contributions has a list of your objectives beyond just energy that are things I hope you can obtain though it will be uphill with the Senate and Executive in the hands of the Democrats.  I hope you can find ways to block the Biden Administration’s plans.

This letter is to focus on just one part of the House’s objectives and that is to counter the disinformation that the global warming alarmists have been spewing.  The way things work now are—-Media support the alarmist’s “experts” and they know that there will be no significant effort by skeptics to counter the alarmists. 

Now that you can control the Committee’s agenda, your members should standup to the global warming alarmists.  This will take some courage on everyone’s part because some members are afraid of the media.   Fox’s post titled “Politico Urges readers don’t believe the polls showing sinking levels of trust of media” One of Politico staff protested the results of the Gallup poll.  But the poll says: 

“The recent polling showed only 16% of Americans said they have a “great deal or quite a lot” of confidence in newspapers with only 11% of Americans having confidence in television. It represented a 5% decrease since 2021 and was also the lowest rating given towards newspapers since Gallup’s original poll back in 1973.

And there is no need not be afraid of the title “skeptic”.  Almost without exception skeptics believe that the globe is warming. 

The skeptics need a microphone that is so big it can work around the media. I think the House of Representatives can do this.

The House could have regular sessions of skeptical testimony. The House should rely on the skeptical experts, of which there are many, to counteract the alarmists. Don’t be afraid to allow the alarmists “experts” to testify, too.  The alarmists usually get beaten in debates with the skeptics. In fact they have a reluctance to debate.  Try getting Al Gore to debate any skeptical expert. No way, he always backs out. You will be doing this to help educate all of the Members of the House of Representatives.   Record all the sessions and publish them on YouTube.

Who are these skeptic experts? You can find them on The Clintel website that has posted “There is No Climate Emergency.”   

The site names 1010 experts listed by country. (The site needs to update the list as it has now grown to 1499 experts.)    

The Skeptical Daily post a summary regarding the skeptics on the lists and some notable quotes. They call the list of the skeptic experts a Declaration.

“The scale of the opposition to modern day ‘settled’ climate science is remarkable, given how difficult it is in academia to raise grants for any climate research that departs from the political orthodoxy.  A lead author of the declaration, Professor Richard Lindzen, has called the current climate narrative “absurd”, but acknowledged that trillions of dollars and the relentless propaganda from grant-dependent academics and agenda-driven journalists currently says it is not absurd.

The Declaration is an event of enormous importance, although it will be ignored by the mainstream media. But it is not the first time distinguished scientists have petitioned for more realism in climate science. In Italy, the discoverer of nuclear anti-matter Emeritus Professor Antonino Zichichi recently led 48 local science professors in stating that human responsibility for climate change is “unjustifiably exaggerated and catastrophic predictions are not realistic”. In their scientific view, “natural variation explains a substantial part of global warming observed since 1850”. Professor Zichichi has signed the WCD.

The Declaration notes that the Earth’s climate has varied for as long as the planet has existed, with natural cold and warm periods. “It is no surprise that we are experiencing a period of warming,” it continues. Climate models have many shortcomings, it says, “and are not remotely plausible as global policy tools”. They blow up the effect of greenhouse gases, such as carbon dioxide, but ignore any beneficial effects. “CO2 is not a pollutant,” it says. “It is essential to all life on Earth. Photosynthesis is a blessing. More CO2 is beneficial for nature, greening the Earth; additional CO2 in the air has promoted growth in global plant biomass. It is also good for agriculture, increasing the yield of crops worldwide.”

Last year, Steven Koonin, an Under-Secretary of Science in the Obama Administration, published a book titled Unsettled in which he noted that, “The science is insufficient to make useful projections about how the climate will change over the coming decades, much less what our actions will be.” He also noted that rigidly promulgating the idea that climate change is settled demeans and chills the scientific enterprise, “retarding its progress in these important matters”. In 2020, the long-time green activist Michael Shellenberger wrote a book called Apocalypse Never in which he said he believed the conversation about climate change and the environment had in the last few years “spiraled out of control”. Much of what people are told about the environment, including the climate, is wrong, he wrote.

These experts get printed in skeptic websites, but we need to widen the audience.

First and foremost the media, the alarmists and some educators have convinced the young that they may die soon.  This poisoning of our childrens minds must be stopped.

From a November 27, 2022 posting by EuroNews.GreenMore than two thirds of children between the ages of seven and twelve are worried about climate change, a new survey reveals.

The climate crisis can be overwhelming. (Click on that climate link.  See what the kids are being taught.)

Statistics often paint a dire picture of the earth’s trajectory. The UN has warned that existing climate pledges provide ‘no credible pathway’ to preventing temperatures from rising 1.5 degrees above pre-industrial levels. Deadly floods and fires are on the rise, while global wildlife populations have shrunk 70 per cent since 1970.

Presented with these facts, it’s easy to sink into eco-anxietyPrevious studies have proven that this distress is heightened in children and the new survey confirms this.”

Secondly, the public should know that the basis of the catastrophic climate change is the computer forecasted global temperatures. It goes, things get very hot, glaciers melt, sea level rises, cities are deluged with sea water, crops cannot survive, creatures cannot adapt to temperatures and huge extinctions occur, etc.

The following chart shows that the forecast temperatures by the alarmist are higher than the actual temperature readings and that the forecast temperatures become more ridiculous as time goes by.  These temperatures are the ones They use to forecast catastrophe.

All the squiggly lines are individual computer forecasts. The Red line is the average global warming temperatures predicted by the computers.  The lower Green straight line is the mean of the actual measured temperature for this same period.  Note that as the years go by, the computer forecast gets further away from the actual measured temperature. The actual temperatures noted in the chart are based upon weather balloons and satellite measurements.  The actual temperatures are rising but not at the rate that will cause a catastrophic outcome.  The computer produced temperature forecasts are used to brain wash our children.

Thirdly, faulty pillars of despair that climate change alarmist preach are debunked in the WattsUpWithThat January 19, 2023 posting titled A Critical Examination of the Six Pillars of Climate Change Despair:  From this posting:

“In 2023 it’s hard to avoid seeing images and headlines like these. The result for many is a deep seated fear[5], anxiety[6] [7], and pessimism[8] [9] about the future. The topic of Climate Change (CC) has seeped into nearly every facet of our lives, and never in a positive way. It’s always present as a dark cloud hanging over society; a source of guilt for those who indulge in some of life’s most basic pleasures, the basis of moralistic judgments by those who like to signal their concern, and the cause of nihilism[10] [11] and hopelessness[12] felt by many in the youngest generations.

    Why does CC have such deeply negative connotations and harmful effects on people’s mental well being? Because we are constantly reminded of the six dark and destructive consequences of CC:

      1) heat will cause millions to die or live in misery

      2) tens of millions (some say billions) will be forced to migrate

      3) a million or more species will become extinct in just a few decades

      4) sea level rise will have disastrous world-wide consequences

      5) agricultural production will be devastated, causing widespread famine

      6) humanity will suffer floods, droughts, and other terrible natural disasters

    These are the six pillars of climate change despair that activists and the media obsess over. The activists do it because they think they are saving the planet; the media do it because bad news gets more clicks than good news. Plus, they both do it to appear virtuous. They both keep ramping up the rhetoric so that with each passing year the predictions about each of these consequences become even more frightening and apocalyptic. There are some lesser concerns (eg. Arctic and glacier melting), but these six are the catastrophic ones.

    No wonder so many people are depressed and pessimistic about the future. It shouldn’t be surprising there’s an epidemic of “climate change anxiety”.

    But is it in any way justified?  What is the truth (if any) behind these catastrophic predictions? That’s what I want to examine here. The fact is, every one of these pillars is made of sand, and crumbles apart when subjected to the slightest critical scrutiny.

The author, Doug R Rogers, puts together a comprehensive essay.  Please read it to it end by clicking here.

The Fourth issue is the headlong race to decarbonize the world.  Renewables (mostly wind and solar) are believed to be the future energy sources, leaving fossil fuels (coal, oil and natural gas) to be only available chemical feed stocks, for example. Combined with electric vehicles (EV) the globe will be free of carbon dioxide gas vented into the atmosphere they say.

The benefits accrued by fossil fuels are discounted in this rush to decarbonization. The benefits from vented CO2 are enormous.  The greening of the globe has been the result of the vented CO2.  Crops, such as wheat, oats, rice, potatoes, cane, etc. have skyrocketed in quantity feeding billions of new people. 


Renewables are not reliable.  What we know is that wind and solar are dependent on the weather.  No wind, no sun, no renewable produced electrical energy.  No where has a major grid sourced by solely wind and solar been demonstrated.  No plans have been made to prove a grid can actually run solely on wind and solar.  Grids have to be supplied  24/7 with NO interruptions. Yet we find that the politicians, urged on by the media, are willing to build more wind and solar capacity and prematurely shut down fossil fuels before they can prove that renewables can provide 24/7 with no interruptions.

The enormous upset that has occurred in western Europe would not have been so serious if renewable could have done the job.  For example, Germany has renewables with name plate capacity greater than the nation’s electrical needs.  But at times in September ‘22 the wind did not blow, and the sun shined only intermittently.  So no matter what their nameplate capacity was, wind and solar were producing little to no electricity. That happened and they stumbled through, saved by natural gas and coal based production of electricity.  

Obviously, there are many more issues than the several I have mentioned.  I picked them because the first one, traumatizing our children has to be stopped NOW.  The other three go right to the heart of the problem. The experts could line up excellent debates or testimonies at House Committee requests.

Expert testimony by skeptics has been ignored by the media.  So how can we get around that? 

Freelancers Wanted: Help Knock Out the Mainstream Propaganda Machine   authored by Matt Taibbi is a plan to create a team to produce a document that knocks out the mainstream Propaganda machine.   Perhaps supporters that could fund similar skeptical teams.  There must be NGOs that are skeptical in their view.  Find them, give them help with finance, programs and topics

Another interesting team is the Center of the American Experiment. The Center of the American Experiment is a Minnesota-based think tank that advocates for conservative and free-market principles.[5] One of their tasks has been to target the objectional courses that public schools in Minnesota are putting into their schooling.  The Center of the American Experiment has people and programs to show what is going on and how to change it. The group will speak to PTAs school boards or other interested groups. This group has been successfully getting schools to drop radical racial material.  This could be a model for another skeptical group to copy.

.   

Work with the local TV stations.  They are often in need of topics to produce for their locality.  Hire people that know how to do communications.  Make sure that Federal Departments that award research money gives skeptics fair treatment. If they don’t, you can have your way with their funding.

I hope that some of the ideas are useful to you.

Good luck

cbdakota  

The Great Reset Demands MONEY


Last week the Great Reset group gathered in Davos Switzerland to continue contriving the destruction of capitalism using global warming as the vehicle. These so-called elites arrived using an alleged 1200 private jets. If they actually believed that carbon dioxide (CO2) is pushing the planet ultimately to an apocalypse, they would do these meetings by Zoom . But instead, they choose to create large amounts of jet engine exhausts of CO2 into the atmosphere. No, they believe that they should govern the planet. To do that they need to spark fear that global warming will bring on extinction. And only these elite can save you by turning governance over to them.

A Washington Times https://www.washingtontimes.com/news/2023/jan/23/editorial-for-select-at-davos-money-is-key-to-stay/?mc_cid=cc44f4808d&mc_eid=557687911 editorial focused the money as follows: (posting is behind a paywall)”

Beware of the individual who refers to his ilk as “we select group of human beings.” It’s the unmistakable mark of the elite who believe their concern for climate can save the world. Mindful that those who guaranteed the safety of the COVID-19 vaccines now associated with disturbing health anomalies derive from the same exclusive class, Americans should regard the purveyors of climate change remedies with studied caution.

The most self-assured of this sort have a habit of showing up for the World Economic Forum’s annual gathering, which recently concluded in Davos, Switzerland. With his “select group” puffery, President Biden’s special envoy for climate, John Kerry, gathered his fellow discussion panelists and audience into a league of their own.

It is all a part of forum founder Klaus Schwab’s plan to “master the future” through climate change activism. Eager to oblige, Mr. Kerry urged all within earshot to rebuff any self-image of “a crazy tree-hugging lefty liberal” and embrace their identity of the “almost extraterrestrial” breed who are “saving the planet.” He made the case that the key to staying cool is “money, money, money, money, money, money, money”: The denizens of Davos want $3 trillion annually to finance greenhouse gas reductions.

By contrast, climate guru and former Vice President Al Gore showed little hesitation in personifying the crazy tree-hugger. Referring to human-caused atmospheric emissions, the Davos forum regular claimed, “That’s what is boiling the oceans, creating these atmospheric rivers and the rain bombs and sucking the moisture out of the land, creating the droughts and raising the sea level and causing these waves of climate refugees predicted to reach one billion in this century.”

All this “settled science” from a self-appointed climate expert who, according to The Washington Post, could not quite manage a gentleman’s C in his Harvard science classes.”

I think that this man-made catastrophe theory will only be abandoned when the cost to fund this program becomes too high for the average citizen and/or explicit examples of failures become so common that people will no longer put up with it.  A major failure would be a long stretch of global cooling.  High priced electricity and frequent black outs will be a trigger too.  And ultimately when it becomes known that renewables are useless without backup nuclear and/or fossil fuels.

When politicians are faced with being voted out, we will be able to drop this crap.

Real science will then out the charlatan’s “settled science” and they will be defamed.  

The average citizen may become distrustful of any scientist, unfortunately because of this.

cbdakota

Will there be a solar minimum soon?


Chart from video of interview of Dr Zharkova Phd ** Click on charts to enlarge

The chart above shows the forecast for Solar Cycles 25, 26 and beyond by Valentina Zharkova.Phd. She believes that she and her team have determined how to forecast solar cycle activity. Solar Cycle 25 is underway and she predicts it will be less active than Solar Cycle 24 and Solar Cycle 26 will be much less active.

Madame Zharkova is much bolder than many other experts with respect to when or if there will be a solar minimum. Before we discuss Madame Zharkova, let’s look into some of the issues that surround the question of an upcoming Solar Minimum.

** The video begins at (2 minutes and 14 seconds.)

To begin with, look at the December 2022 Global temperature.  It dropped to an anomaly of 0.05C from November 2022’s 0.17C anomaly.  This measurement continues the decline of global temperatures since the last El Nino where the anomaly peaked at about 0.4 C. (Red line)

The chart above is from a Dr Roy Spencer posting.

This has resulted in a number of people saying we are on our way to another “little ice age”.   Let’s look at several predictions of serious global cooling

ENSO is the system name acronym for and the Southern Oscillation. It a major factor affecting global temperature.

The El Nino (ocean warming) and the La Nina (ocean cooling) are considered natural phenomena, meaning that they are not man-made actions.  A simplistic description of this phenomena is that over a period of time sun and or submerged volcanos, warm a body of western Pacific Ocean, lying along the equator and its temperature rises. This causes atmospheric changes and the hot water flows eastward to the coast of South America. This is called El Nino.  After several years the conditions change and the body of water flows westward and cool, deep ocean water along South America coast rises This is the La Nina.. This ebb and flow has a major effect on global weather.

The above chart illustrates the Nino and Nina occurrences from 1990 to the present.  Comparing the temperature chart and the Ninos charts show that when an El Nino occurs the global temperature rises. Conversely global temperature drops when a La Nina occurs. The charts seems to show that El Ninos are stronger that La Ninas.  (It would be interesting if someone had measured the chart area for the two.)

Now eyeballing the charts, it looks like the strong El Ninos, a natural occurrence, are the major mover of the global temperatures. 

Examining the global temperature chart, the period following the 1997 -1998 El Nino, stretching out to about 2015 shows that global temperature is flat, in other words, no significant change in global temperature was recorded. Something like 15/16 years.  This happened even though atmospheric C02 was increasing. Does this relegate CO2 to be only a minor forcing? Does this indicate that the sun (or volcanos) are causing global temperatures to rise?

Viewing Solar Cycles.

Solar Cycle 24 was much less active than its predecessors. The new Cycle 25 activity is almost identical to Solar Cycle 24 as can be seen in the following chart

The chart above is courtsey of Solan.Info.

Cycle 25 at 30 months after cycle start is the green line and that is where Cycle 24, the black line, was at thirty months. The other Cycles, from other years, that had unusually low activity are shown on this chart. Cycle 24 the black line was less activity than the others.

For contrast, the following chart shows the “Modern Maximum”, group of Cycles, meaning very active. The chart is a little dated as the last rising blue line is Solar Cycle 24.

The solar cycles 24 and 25 are substantially less active than their predecessors.  There is really no strong signal yet that the temperature is dropping due to low activity Solar Cycles. Perhaps there is a time delay built into the system.

Cloud Formation due to weak Solar Cycles

This allows us to examine three theories.  First comes the Svensmark theory: From the posting “comes this description of the theory:

“In 1995, Henrik Svensmark discovered a startling connection between the cosmic ray flux from space and cloud cover. He found that when the sun is more active–more sunspots, a stronger magnetic field, larger auroras, stronger solar winds, etc.–fewer cosmic rays strike the earth and cloud cover is reduced, resulting in warmer temperatures.”  When the sun is inactive, more of them penetrate the atmosphere. Upon reaching the lower atmosphere where more sulphur dioxide, water vapor, and ozone is present, the cosmic rays ionize the air, releasing electrons that aid in the formation of more CCN and form more dense clouds. This increase in low-cloud amount reflects more solar energy to space, cooling the planet.”

CERN set up chambers to test this theory. While there was some verification, they said that cosmic rays did form clouds, but the formation was much too small to have any effect.  It appears that there are many that still think Svensmark is correct.  We will have to wait to see future developments.

There are some new theories positing that Ultra Violet (UV) is a player.   

First some UV information from Wiki: “The Sun emits ultraviolet radiation at all wavelengths, including the extreme ultraviolet where it crosses into X-rays at 10 nm. Sunlight in space at the top of Earth’s atmosphere is composed of about 50% infrared light, 40% visible light, and 10% ultraviolet light, for a total intensity of about 1400 W/m2 in vacuum.[22]

The atmosphere blocks about 77% of the Sun’s UV, when the Sun is highest in the sky (at zenith), with absorption increasing at shorter UV wavelengths. At ground level with the sun at zenith, sunlight is 44% visible light, 3% ultraviolet, and the remainder infrared.[23][24] Of the ultraviolet radiation that reaches the Earth’s surface, more than 95% is the longer wavelengths of UVA, with the small remainder UVB. Almost no UVC reaches the Earth’s surface.[25] 

The shorter bands of UVC, as well as even more-energetic UV radiation produced by the Sun, are absorbed by oxygen and generate the ozone in the ozone layer when single oxygen atoms produced by UV photolysis of dioxygen react with more dioxygen. The ozone layer is especially important in blocking most UVB and the remaining part of UVC not already blocked by ordinary oxygen in air.”

Here is one of the UV theories It is called the Winter GateKeeper Hypothesis. I would like to say that I know enough to describe this hypothesis, but I can not. Dr Judith Curry has posted it on her site, which I think is a favorable appraisal of this hypothesis. She has also noted another researcher which seems to have a favorable opinion. So I will give you a summary:

“The Winter Gatekeeper Hypothesis integrates different components of the transport system in the stratosphere, troposphere, and ocean. A schematic of the energy processes involved is presented in Fig. 8.1, with energy transport represented by white arrows. Solar modulation starting in the stratosphere affects all transport, and Vinós (2022) showed a solar effect on ENSO and the polar vortex. The mechanism by which solar activity modulates ENSO activity is still unknown, but this author proposes a solar modulation of the Brewer-Dobson tropical upwelling, known as the “tropical route” of the “top-down mechanism” (Maycock & Misios 2016; Vinós 2022).”

“Fig. 8.1. Northern Hemisphere winter meridional transport outline. The energy gain/loss ratio at the top of the atmosphere determines the maximal energy source in the tropical band and the maximal energy sink in the Arctic in winter. Incoming solar energy is distributed in the stratosphere and troposphere/surface where it is subjected to different transport modulations. Energy (white arrows) ascends from the surface to the stratosphere at the tropical pipe (left dashed line) and is transported towards the polar vortex (right dashed line) by the Brewer–Dobson circulation. Stratospheric transport is determined by UV heating at the tropical ozone layer, which establishes a temperature gradient affecting zonal wind strength through thermal wind balance, and by the quasi-biennial oscillation (QBO). This double control determines the behavior of planetary waves (black arrows) and determines if the polar vortex undergoes a biennial coupling with the QBO (BO). In the tropical ocean mixed-layer, ENSO is the main energy distribution modulator. While the Hadley cell participates in energy transport and responds to its intensity by expanding or contracting, most energy transport in the tropics is done by the ocean. Changes in transport intensity result in the main modes of variability, the AMO, and PDO. Outside the tropics, most of the energy is transferred to the troposphere, where synoptic transport by eddies along storm tracks is responsible for the bulk of the transport to high latitudes. The strength of the polar vortex determines the high latitudes winter climate regime. A weak vortex promotes a warm Arctic/ cold continents winter regime, where more energy enters the Arctic exchanged by cold air masses moving out. Jet streams (PJS, polar; TJS, tropical; PNJ, polar night) constitute the boundaries and limit transport. Red oval, the part of the Winter Gatekeeper Hypothesis studied in Veretenenko 2022. Figure from Vinós 2022”

Finally, a few notes about the Zharkova theory.

From the posting in Principia Scientific titled “The Woman Who Could Cancel Net Zero”comes another theory.   The woman in this case is  Professor Valentina Zharkova of the University of Northumbria. The professor’s fields are applied mathematics, plasma physics, pattern recognition, solar-terrestrial physics and solar activity. She forecasts that “in the next 30yrs, global warming problem will be last thing in our mind. Then the solar cycles return to being active.

With her team, she has studied the Sun’s many magnetic fields.   She says that sunspots are not a strong enough signal to base any predictions on.  So the team separated the magnetic fields in separate components with a principal component analysis using Eigen vectors and Eigen values. She used the output to create a method to predict solar cycle activity. She maintains that she demonstrated that the teams work can closely match the past solar cycles and they can use it to project the future solar cycle activity.

It would be enormous step in understanding the Sun if Dr Zharkova’s system proves out. It might well be a big hit on the man-made global warming theory, too.

cbdakota