Growing realization by the climate establishment that the threat of future warming has been cut in half over the past 5 years.
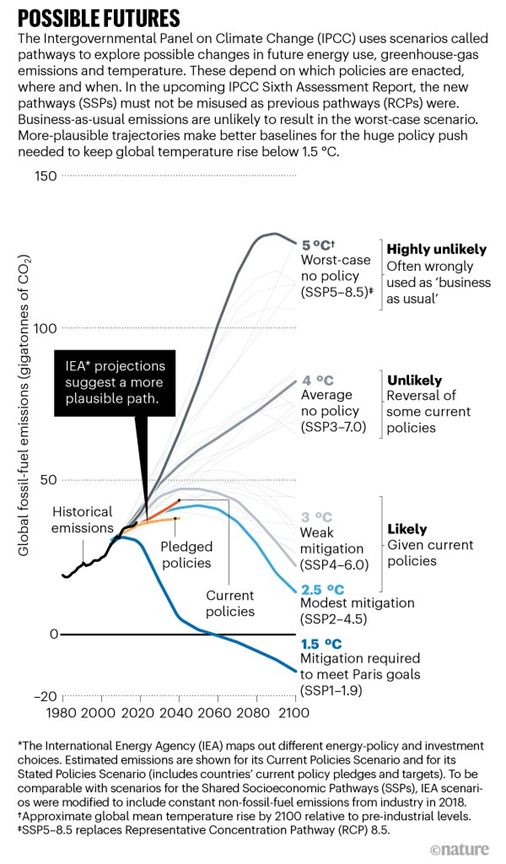
Summary: The climate “catastrophe” isn’t what it used to be. Circa 2013 with publication of the IPCC AR5* Report, RCP8.5 was regarded as the business-as-usual emissions scenario, with expected warming of 4 to 5 oC by 2100. Now there is growing acceptance that RCP8.5 is implausible, and RCP4.5 is arguably the current business-as-usual emissions scenario. Only a few years ago, an emissions trajectory that followed RCP4.5 with 2 to 3 oC warming was regarded as climate policy success. As limiting warming to 2 oC seems to be in reach (now deemed to be the “threshold of catastrophe”),[i] the goal posts were moved in 2018 to reduce the warming target to 1.5 oC. Climate catastrophe rhetoric now seems linked to extreme weather events, most of which are difficult to identify any role for human-caused climate change in increasing either their intensity or frequency.
The main stream media is currently awash with articles from prominent journalists on how the global warming threat less than we thought. Here are some prominent articles:
At the heart of this good news is abandonment of RCP8.5 from UNFCCC policy making. The hero of science behind this abandonment is Justin Ritchie, a recent Ph.D. graduate (whose work has been cited.
The COP26 and now the COP27 have quietly dropped RCP8.5 (and SSP5-8.5) from their considerations, focusing on the envelope between RCP4.5 and RCP2.6. The grand poohbahs of the IPCC apparently didn’t see this coming (or preferred to keep spinning the alarm), since they instructed climate modelers for CMIP6 to continue a focus on SSP5-8.5, and climate researchers continue to focus on this scenario in their impacts publications. The IPCC AR6 prominently featured SSP5-8.5, although WGI did make this lukewarm statement
The second so-called scientific advance is lower values of climate sensitivity. The so-called advance is associated with the IPCC AR6 decision NOT to include values derived from climate models (which have dominated previous IPCC reports). They implicitly acknowledge that climate models are running too hot and that you can pretty much get whatever value of climate sensitivity that you want from a climate model (this has been blindingly obvious to me and many others for over a decade). The IPCC AR6 lowered the upper likely bound of ECS to 4.0oC (from 4.5oC previously); this further acts to reduce the amount of projected warming. The IPCC AR6 also raised the lower likely bound of ECS to 2.5oC (from 1.5oC). Raising the lower bound of ECS is on very shaky ground, as per the recent publication by Nic Lewis
The COP27 is working from a value of expected warming of 2.5oC by 2100. This is arguably still too high for several reasons. IPCC expert judgment dismissed values of climate sensitivity that are on thelower end (that should not have been dismissed as per Nic Lewis’ paper). Further, the IPCC projections do not adequately account for scenarios of future natural climate variability. See these recent posts:
In addition to an insufficient number of solar and volcanic scenarios, the climate models ignore most solar indirect effects, and the climate model treatment of multidecadal and longer internal variability associated with ocean circulations are inadequate. While in principle these factors could go either way in terms of warmer vs cooler, there are several reasons to think these natural factors are skewed towards cooler during the remainder of the 21st century:
Baseline volcanic activity since 1850 has been unusually low
Most solar researchers expect some sort of solar minimum in the mid to late 21st century
Solar indirect effects are inadequately treated by climate models, which would act to amplify solar cooling
A shift to the cold phase of the Atlantic Multidecadal Oscillation is expected in the next decade, which influences not only global temperatures but also Greenland mass balance and Arctic sea ice.
Once you include alternative scenarios of natural variability, temperature change by 2100 could easily be below 2oC and even 1.5oC. Recall that this warming is with reference to a baseline of1850-1900; 1.1oC warming has already occurred.
*AR stands for Assessment Report. These are based upon the content in the Intergovernmental Panel on Climate Change (IPCC) full reports, assembled by working groups. AR6 is the most recent report. The reputation of the ARs is in dispute. The full report, the 6th, is condensed to an AR6. The dispute is that many nonscientific personnel, such as delegates from industry, NGOs, etc. can force change that make the AR inconsistent with the full report.
The alarmist’s climate crisis is encountering some serious headwinds. Not just from we skeptics but also from the ranks of the man-made global warming adherents. This posting will be to set the table for the subsequent postings that will illustrate the headwinds. Another posting that will illustrate the profound damage that the crisis crowd are doing to the young people will also be posted.
I posted in April 2021 how the alarmist’s computer forecasts were biased. Two concepts are the primary tools that the computer operators use to make predictions of future temperatures. One is the representative concentration pathway (RCP) and the other is the equilibrium climate sensitivity (ECS)
RCP
Representative Concentration Pathway (RCP) is an estimate of the amount of CO2 in the atmosphere at any given time.
The chart below shows the range of RCPs the computer programmer can use. The chart has RCPs portraying the forecasted amount of accumulated CO2 in the atmosphere out to the year 2100. The chart has a bit of dialog as well. More on this will appear in the upcoming posting on this topic.
ECS
Theory is that temperature will rise approximately 1C due to a doubling of atmospheric CO2. Further, the CO2 induced increase in temperature will result in creating water vapor. Water vapor is a powerful greenhouse gas. That and some other minor changes in atmospheric gases will result in an additional rise of 2C. Thus, CO2 doubling does not just create 1C rise but rather a 3C rise.
ECS is controversial. There are those that do not believe in the CO2 effect at all. They may not appreciate this postings discussion of ECS and RCP, but the posting is addressing what the Alarmist believe. Most buy into the concept but conclude that the effect is much less than a 3C rise,
This is how the ECS theory works. Surface warming due to doubling of the atmospheric CO2. Going from the nominal 400ppm atmospheric CO2 to 800ppm would result in 3C rise. But other test data says it is less.
Jonova chart
The computer programmer puts in the RCP and the ECS. He can get whatever temperature forecast he wants.
The following is a guest posting by Richard Cronin. He provides a well-documented discussion of how Tidal Pumping drives weather and Climate.
By Richard Cronin
There is no “climate crisis”. The internal heat of the Earth delivered to the ocean floor is grossly misunderstood.
An entirely unappreciated energy input onto the surface of our planet is Tidal Pumping. Not pumping water. Shifting our tectonic plates due to the Earth’s gyrations (Precession, Obliquity, Perihelion, and Orbital Eccentricity) in addition to our varying distance from the planetary gravity fields everywhere from the Sun out to Jupiter.
Milankovitch cycles have nothing to do with solar radiation. They have everything to do with tidal pumping. This information has been coming forward over the last decade by geologists, geophysicists, and astrophysicists. Unfortunately, these disciplines have been overlooked in the discussion about climate.
Tidal pumping by the Sun, Precession of the Equinoxes, Obliquity, Perihelion, Orbital Eccentricity, as well as planetary alignments (particularly Sun, Venus, & Jupiter) move Earth’s tectonic plates. Therefore, all of Earth’s internal heat is delivered to the surface, notably into the waters at the two (2) terminal points of the Pacific’s Ring of Fire. The seismic heat injection is Enormous. Per NASA, this energy input is approx. 99.5 % of all solar radiation but the flawed paradigm is that the internal heat of the Earth is dissipated in Mantle Convection. Mantle Convection and Subduction do not exist.
Per NASA’s very calculations: “The interior of the earth contributes more than 99.5 percent of the total heating of the surface compared with the sun!
This answer, of course is quite wrong because it assumes that 100% of the internal energy is radiated to the surface. In fact, the internal heat source drives powerful convective currents in the mantle so that nearly all of this thermal energy is lost.”
The energy statement is true, but the dissipation of the internal heat into Mantle Convection is wrong. There is no Mantle Convection. The internal heat is delivered to the surface, specifically the ocean floor of our planet and greatly exceeds any causation from minuscule trace gases in our atmosphere.
At the Winter Solstice, the incrementally closer distance between the Sun and Southern Hemisphere induces greater plate movement across the Southern Hemisphere and greater seismicity in the Peru-Chile Trench to drive the El Niño. Alternately, these tidal stresses can find relief and induce greater seismicity in the Tonga-Kermadec Trenches to drive the La Niña. Elevated surface water temperatures near Papua-New Guinea are due to a heat plume emitted from the Tonga Trench, but the heating of these surface waters is also affected by the multi-plate, seismically active regions to the east of Papua-New Guinea, including the New Hebrides and New Britain Trenches. Ergo, sea surface temperatures are highest in these regions east of Papua New Guinea.
Current sea surface temperatures showing cooler waters in the central Pacific and elevated temperatures east of Papua New Guinea. Entirely typical of a strong La Niña:
In “Plate Climatology”, James Edward Kamis describes a single “Source Point” for the La Niña and El Niño as centered on the multi-plate, seismically active regions to the east of Papua-New Guinea. It seems doubtful to me that this region could drive the El Niño off the coast of Peru. I hold that the ENSO is a binodal condition, at either end of the Ring of Fire.
Via bathyscaphic ocean floor mapping, Hillier and Watt (2007) provided an estimate of 1.0 to 3.5 million oceanic seamounts which by definition are formed by submarine volcanoes. This estimate excludes estimates above latitudes 60 degrees North and South. See “Global distribution of seamounts from ship-track bathymetry data” in references.
The Dust Bowl years of the 1930s were caused by a strong, sustained La Niña. Drought across the plains states in summer months , punctuated by springtime flooding conditions further north.
The La Niña brings flooding monsoons across Bangladesh, while the Northern Hemisphere suffers extreme drought in the summer months. Extreme low water conditions across rivers of America’s interior as well as Europe. Yet earlier this spring the Yellowstone River flooded over its banks.
The geochemical reactions throughout the Upper and Lower Mantle are all exothermic (give off heat). Activation Energy is supplied by planetary Decompression. Fischer-Tropsch and Sabatier reactions produce methane and petroleum in unimaginable quantities. (See link). Most is diffused from the ocean floor. Land-based sources are minuscule.
Hydrothermal vents and plain old ocean floor seepage is immeasurable and these acidic discharges react with alkaline ocean waters to release the Heat of Neutralization and the Heat of Dilution.
We have been under pronounced La Niña conditions since autumn of 2020. Last year we went thru the alphabet in hurricane names. Entirely typical of La Niña.
An estimated 50 million tons of water vapor spewed from the Tonga Trench volcano on Jan. 15, 2022. This largest submarine volcano ever observed will produce a warm, wet planet for years. A Richter 7.3 submarine earthquake struck off Tonga on Nov. 11, 2022.
Areas of drought are also caused by an increase in katabatic winds. Moisture condenses on the southern face of the Himalayas, producing monsoons and floods across northern India and Bangladesh. Dry, hot winds flowing down from the Himalayas cause continuous dry conditions for Central Asia.
Significant tidal pumping stresses coincided with the Precession of the planet on Dec. 21, 2021 to tear open the Tonga Trench. Another stress-inducing event is the Perhelion, the closest approach between Earth and Sun, associated with the Earth’s elliptical orbit. The Perihelion occurs two (2) weeks after the Solstices. On April 30, 2022, there was a planetary alignment of Venus-Earth-Mars-Jupiter. On Sept. 26, Jupiter made its closest approach to Earth in 59 years. Tremendous tidal pumping stresses. Tremendous seismic energy release. Totally ignored.
References listed by date. Most of this information was issued in the last half decade. Copy and paste the titles into any web browser.
“Institute for Celestial Geodynamics” ( D. Zbikowski, et al )
“Continental Drift Theory – Unresolved Issues “
“Plate Climatology” by James Edward Kamis. Book published 2019.
“Topological inconsistency of continental drift on the present-sized Earth”
R Meservey. Science. 1969.
“Problem of Convection in the Earth’s Mantle”
E. N. Lyustikh, published in Geophysical Research Letters: 01 January 1969
“Pump-like Tidal Driving of Tectonic Plates – Plates 1” George W. Moore, AAPG Bulletin, GeoScience World, June 1, 1975
“The earth tides”
Judah Levine, December 1982 (NIST)
“Earth tides and the degassing of the Earth”
Khitarov, N. I. ; Voitov, G. I. , March 1982 (NIST)
“Global distribution of seamounts from ship-track bathymetry data”
J.K. Hillier, A.B. Watts, Geophysical Research Letters, July, 2007
—> By definition seamounts are formed by volcanic activity. Hillier and Watt estimate 1 to 3.5 million seamounts and this excludes allowance for regions higher than Latitude 60 degrees. Conservatively, active submarine volcanoes are in the tens of thousands.
“Can Earth’s rotation and tidal despinning drive plate tectonics?”
F. Riguzzi, et al, 2009
“Researchers discover new force driving Earth’s tectonic plates”
Cande & Stegman, Univ. of S. California, July 7, 2011
“On Ohmic heating in the Earth’s core II: Poloidal magnetic fields obeying Taylor’s constraint”. Jackson, Livermore & Ierley, Aug., 2011
“Earth Expansion Evidence: a Challenge for Geology, Geophysics and Astronomy”
G. Scalera, S. Cwojdzinski, National Institute of Geophysics & Vulcanology (Italy), 4-Oct-2011
“Spin-driven tidal pumping: Tidally driven changes in planetary spin coupled with secular interactions between planets.” R. Greenburg et al, Feb. 2013
“Tidal strain and tidal stress in the Earth’s interior” W. Kia, et al, Chinese Journal of Geophysics, November, 2013
“Tidal Stresses – How Gravity Heats Things Up”, Tim James, Dec. 2, 2013 ( author of ‘Astronomical: From Quarks to Quasars, the Science of Space at its Strangest’)
“Secular Increase in the Earth’s LOD (Length of Day) Strongly Implies that the Earth Might Be Expanding Radially on a Global Scale” G.G. Nyambuya ,
4-March-2014
“Asian monsoons in a late Eocene greenhouse world”
A. Licht, G. Dupont-Nivet, et al, Nature, 4-August 2014
—> “But monsoons are still poorly understood, and today’s climate models disagree about how increased carbon dioxide (CO2) in the atmosphere will alter them.”
—> “Asian monsoon began ….. recently several independent teams to around 40 million years ago.” (same duration as Central Asian drought)
“Jupiter’s effect on Earth’s climate”
O. G. Sorokhtin, et al Nov., 2014
“Stanford geologists refute coal development theory” Boyce, Nelson at Stanford 2-Feb. 2016
—> Coal, oil, and gas are NOT produced from squished trees. Fischer-Tropsch (F/T) and Sabatier reactions produce oil and gas on all planets. The only true “fossil fuel” is lignite (brown coal, soft coal, thermal coal) derived from peat bogs of the Tertiary Period. It has only 25 to 35% Carbon value.
—> Heavy crudes, petroleum tars, sub-bituminous coal, bituminous coal vent off volatiles to yield Anthracite (black coal, hard coal) which is 95% Carbon. These carbonaceous fuels all derive from F/T and Sabatier reactions.
“One Paradox of Plate Tectonics”
Laszlo Attila Horvath, July-2016
“Resilience of the Asian atmospheric circulation shown by Paleocene dust provenance”
A. Light, G. DuPont-Nivet et al
Nature Communications 4-August-2016
—> “Our results show that dust sources and near-surface atmospheric circulation have changed little since at least 42 Myr.” (same duration as India-Bangladesh monsoons)
—> “Neither Tibetan uplift nor the decrease in atmospheric carbon dioxide concentration since the Eocene seem to have changed the atmospheric pattern in central Asia,” Licht said. “Wind patterns are influenced by CHANGES IN THE EARTH’S ORBIT over tens or hundreds of thousands of years, but over millions of years these wind patterns are very resilient.”
“Pervasive upper mantle melting beneath the western US”
S. Hier-Majumber, B. Tauzin, et al Earth and Planetary Science Letters. April-2017
—> Just above Transition Region there are Carbonate melts, source of CO and CO2 by acidic attack from sulfur compounds (SO2, etc) produced in the Lower Mantle. CO and CO2 are reagents for Fischer-Tropsch and Sabatier reactions to produce methane and water. Just in the Western U.S. ALONE, centered on Yellowstone, this carbonate melt zone measures approx. 1.8 million sq. km with a thickness ranging from 25 to 70 km. Decomposing just 1 % of this Yellowstone carbonate layer would be equivalent to burning 2.3 trillion barrels of oil.
“The Very Deep Origin of the World’s Biggest Diamonds”
Gemological Institute of America, Winter 2017
—> “Culligan-like diamonds contain …. iron-rich metallic inclusions surrounded by a fluid jacket composed of methane and hydrogen.” This is a Fischer-Tropsch reaction. Iron is the catalyst.
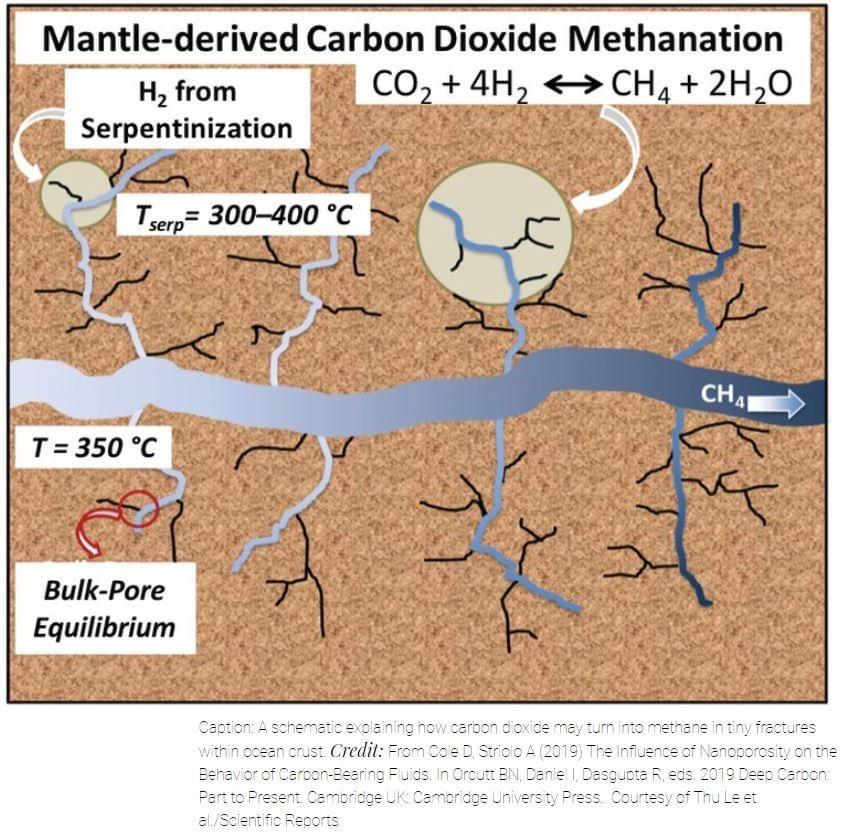
—> Fischer-Tropsch reactions proceed as follows: CO + 3H2, under Reducing Conditions (O2 deficient) and in the presence of an Iron or Cobalt catalyst and starting at 350C, yields methane and water. Further dwell time in a geological “trap” will produce petroleum — in unimaginable quantities. Sabatier reactions perform in much the same way with with CO2 instead of CO catalysts of Vanadium and Silica. CO2 methanation.
“Spectral, spatial-statistical, and graphical evidence that gravitational interaction with the Moon assists in driving Earth’s tectonic plates Part 1”D.Zbikowski, Institute for Celestial Geodynamics, January 2018
“A global forecast for great earthquakes and large volcanic eruptions in the next decade” D. Zbikowski, Institute for Celestial Geodynamics, Sept. 2018
—> “Movement of Earth’s rotational axis with respect to the globe generates motion of the north and south rotational poles upon the surface. Motion of the north rotational pole with respect to the net surface consists of roughly circular wobbles with a quasi-annual period. The wobbles of polar motion are formed primarily from two components-the free Chandler wobble (433 days) and the forced annual wobble (seasonal, 365 days).”
“Empirical evidence for stability of the 405 kiloyear Jupiter-Venus eccentricity cycle over hundred of millions of years.
D.V. Kent, P.E. Olsen, C. Rasmussen, et al, Rutgers University , May 7, 2018
—> “Every 405,000 years, gravitational tugs from Jupiter and Venus slightly elongate Earth’s orbit, an amazingly consistent pattern that has influenced our planet’s climate for at least 215 million years and allows scientists to more precisely date geological events like the spread of dinosaurs, according to a Rutgers-led study.”
“The Ability of Significant Tidal Stress to Initiate Plate Tectonics” by Zanazzi & Triaud, Jan. 2019
“Seismic monitoring reveals tidal stresses in the Earth’s crust”, C. Sens-Schönfelder, et al, Physics World, 15-April-2019
“The phenomenon of subduction is incompatible with Earth’s surface geometry and geomorphology” Lazlo Attila Horvath, July 2019
“Milankovitch (Orbital) Cycles and Their Role in Earth’s Climate”
Alan Buis, NASA Jet Propulsion Laboratory, February 27, 2020
“Tidal modulation of plate motions”
D. Zaccagnino, C. Doglioni, Earth-Science Reviews, June 2020
—> “While mantle convection is fundamental ingredient of geodynamics the driving mechanism of plate tectonics remains elusive. ….. GPS measurements are now accurate enough that, on long baselines, both secular plate motions and periodic tidal displacements are visible.”
—> “Tidal oscillations also correlate with the seismic release.”
“Solar system planetary alignment triggers tides and earthquakes”
S. Awadh, 2021
“Beyond Plate Tectonics”by James Maxlow. Book published 1-Dec.-2021
“Links of planetary energetics to moon size, orbit, and planet spin: A new mechanism for plate tectonics”
A. Hofmeister, Univ. of Washington (St. Louis), January 2022
—> “Tug of sun, moon could be driving plate motions on ‘imbalanced’ Earth”
“The hot zones of global Mw ≥ 5 earthquakes and their decadal migration during 1989–2019”
Jin Chen & Hong Tang, Journal of Geosciences, March 2022
“Precession helped drive glacial cycles in the Pleistocene.”
S. Barker, A. Starr, Geophysical Research Letters. 26-May-2022
GLOBAL-SCALE TIDAL FORCING AND PLATE TECTONICS HAVE BOTH SHAPED THE TECTONIC EVOLUTION OF EUROPA. C. E. Detelich, et al, 53rd Lunar and Planetary Science Conference (2022)
From Politico’s bog: “New U.S. message on climate change: Make China pay.” Is our President out of his mind— wait, wait, I guess that is already answered. He says the US will pay reparations if China does.
First of all, why would he think the US taxpayer should pay reparations. Why not ask the underdeveloped nations to pay reparations for our medical discoveries, our thousands of inventions that have made their life easier, our pitching in to save starving people that routinely occur in Africa, etc.
Moreover, reparations are hard to get right. China and India, combined, are emitting more CO2 than the rest of the world. Every nation in the world has been using some level of fossil fuel. Would we get to reduce our reparations payments for that?
Secondly, China will not do reparations. And thank God for that because if they did, Biden then would have us hoisted by his own petard.
And the third reason is that there is no crisis. It is an invention by the alarmists and the Great Reset group. Is the world warming? Yes, because the UAH satellite global temperature measurements tell me that.
For at least the last million years, the globe cycles, roughly, every 100,000 years between cold and warm. Does that without any SUVs on the road, by the way.
But I do not believe the alarmist’s computer forecasts of future temperatures. Those forecasts have always exceeded the actual global temperatures. The alarmists recognize this. That is why they changed the narrative from “global warming” to “climate change”. But still, they use those faulty forecasts.
And how do they know that we are really, really going to be sorry if, since the year 1890 until now the global temperature will have increased more than 1.5C. Their ability to make accurate predictions has been non-existent. Why should we believe this one?
So, the answer is too back off global catastrophe predictions and focus on doing adaptation when and if necessary. In the meantime, the Earth will continue to green because of the CO2 in the atmosphere.
At a book signing event on 2 November, Greta Thunberg, joined the major global warming alarmists when she acknowledges that global warming is merely a cover for their real objective—destroying capitalism. The Telegraph,com. posted “Greta Thunberg: It’s time to transform the West’s oppressive and racist capitalist system”. The telegraph made the following comment:
“The 19-year-old Swedish activist has announced that as well as tackling her usual area of climate action and awareness-spreading, she has now thrown her weight behind defeating the West’s “oppressive” capitalist system.
Calling for a “system-wide transformation” at her book launch in London, she claimed that the world’s current “normal” – dictated by the people in power – has caused the climate breakdown.
She said: “We are never going back to normal again because ‘normal’ was already a crisis. What we refer to as normal is an extreme system built on the exploitation of people and the planet.
“It is a system defined by colonialism, imperialism, oppression and genocide by the so-called global North to accumulate wealth that still shapes our current world order.”
Wow, her family is middle to upper class. She is living in a capitalist nation that is nothing like her description of capitalism. One wonders where, in her youth, she has formed such opinions.
Michael Shellenberger made this comment:“Media Must Take Responsibility For Greta Climate Panic” He is right. Think of the young people that have been taken in about global warming only to learn that it is capitalism that is her real enemy.
Developed Nations will Not Fulfill Their Promises of Money to Underdeveloped Nations to combat Global Warming. Big battle to ensue at COP27.
This is not new, news. The energy crisis is crippling The EU economies. They have never fulfilled their promise to annually put big money in to the $100Billion fund for undeveloped nations to use to combat Global Warming. . And they won’t do it this year. The COP 27 will meet in Egypt and the sparks will fly.
A posting by Bloomberg “Global Climate Summit Is Heading for a Geopolitical Hurricane” provides the expected outcome of COP 27.
Rupert Darwall points his finger at President Biden and the Climate Alarmists as the creators of the current world energy crisis in his posting “Joe Biden’s Energy Crisis”. He says:
“…the energy crisis was not sparked by Saudi Arabia and its Gulf allies or by Iranian ayatollahs. It was self-inflicted, a foreseeable outcome of policy choices made by the West: Germany’s disastrous Energiewende that empowered Vladimir Putin to launch an energy war against Europe; Britain’s self-regarding and self-destructive policy of “powering past coal” and its decision to ban fracking; and, as Joseph Toomey shows in his powerful essay, President Biden’s war on the American oil and gas industry.”
“Hostilities were declared during Joe Biden’s campaign for the Democratic presidential nomination. “I guarantee you. We’re going to end fossil fuel,” candidate Biden told a climate activist in September 2019, words that the White House surely hopes get lost down a memory hole.”
The Biden Administration’s actions are all over the map. When US gasoline prices skyrocketed, and they found their policy on the wrong side they begged Venezuela, Iran and Russia to send their production to the US. Their campaign promises were abandoned by their fear of losing votes come November. How do you spell “hypocrites”?
“Although the price of oil has slipped back from recent highs, the factors behind high gasoline prices remain in place. Foremost among these is the steep decline in U.S. oil refinery capacity triggered when Covid lockdowns crushed demand but continued after the economy reopened. There has never been such a large fall in operable refinery capacity.
Just recently, the Biden Administration said that Big Oil was failing to keep the Northeastern states inventory of gasoline up to standard capacity. Darwall responds”
“Moreover, Gulf Coast refineries were operating at 97 percent of their operating capacity in June 2022. As Toomey remarks, “There isn’t any more blood to be squeezed out of this turnip.”
Darwall notes where climate alarmists are part of the problem. He says:
“Corporate and Wall Street ESG** policies are another factor driving refinery closures, especially of facilities owned by European oil companies to meet punishing decarbonization targets that will effectively end up sunsetting them as oil companies. If finalized as proposed, the Securities and Exchange Commission’s proposed climate disclosure rules, with the strong support of the Biden administration, will heighten the vulnerability of U.S. oil and gas companies to climate activists and woke investors to force them to progressively divest their carbon-intensive activities, such as refining crude oil, and eventually out of the oil and gas sector altogether. To these should be added aggressive federal policies aimed at phasing out gasoline-powered vehicles in favor of electric vehicles (EVs); an administration staffed from top to bottom by militants who believe that climate is the only thing that matters in politics; and an increasingly hostile political climate (“you know the deal,” Biden said of oil executives when campaigning for the presidency. “When they don’t deliver, put them in jail”).”
cbdakota
**ESG (Environmental, Social, Governance) has become a major issue of interest in the modern corporate world. Usually associated with things like climate change, pollution and resource scarcity, in reality, ESG covers a much wider spectrum of socio-economic issues like employability practices, diversity, social and cultural ethics, data security and sustainability.
SRI investors seek companies that promote ethical and socially conscious themes including diversity, inclusion, community-focus, social justice, and corporate ethics, in addition to fighting against racial, gender, and sexual discrimination.
This is the sixth posting of a series listing things that the alarmists and the mainstream media do not want made public. At the top of this posting is a link to the preceding postings.
The Paris Agreement (PA) has been a flop, so far. The PA’s target is lowering CO2 emissions. Since the PA was signed in 2015 by some 180+ nations, the CO2 emissions have risen.
The chart below, from Rhodium, shows the percentage of the total global emissions of the so-called greenhouse gases made by the top 8 emitters in 2019. China is far and away the leading emitter and will be increasing the difference in the future. CO2 from fossil fuels is nominally 80+ % of the total emissions. The rest of the total is from cement manufacturing, methane, and fluorocarbons, etc. In 2020, the emissions dropped due to COVID but are forecast to be back up in 2021.
The International Energy Agency forecasts that 2021 will exceed the emissions in 2019. Their forecast is 33GtCO2 for the year 2021.
China and India as well as many nations in Africa and Asia are installing coal-based power plants at a breakneck speed. Because coal combustion produces more CO2 per Megawatt hour, than any other commonly used fossil fuel, it is the primary target of the alarmists. Bloomberg Green data reports on the primary users of coal int 2019:
COAL USER
% OF TOTAL COAL USED
CHINA
51.7
INDIA
11.8
US
7.2
REST OF THE WORLD
29.3
The US has been reducing the use of coal by using natural gas as a replacement.
The premise of the PA is to essentially eliminate all global manmade CO2 emissions to prevent the global temperature to have risen to 2C since 1900. Or else, awful things are going to happen the alarmists tell us.
If the US were able to totally reduce their emissions, would that prevent the global temperature to rise to 2C?
“Not when almost 90 percent of all of the planet’s global emissions come from outside of US borders. We could go to zero tomorrow and the problem isn’t solved,” Kerry conceded.
All the signers of the PA must submit their Nationally Determined Contribution (NDC), a plan to reduce CO2 emission. Then every 5 years they are to make a new set of NDCs more robust than the preceding submittal. There are no penalties for not meeting your NDC nor are there any for not making a sufficient effort. The burden for accomplishing this objective is laid on these 42 nations that signed the PA. This group consists of the 27nations within the EU, Australia, Canada, Chile, Iceland, Israel, Japan, Korea, Mexico, New Zealand, Norway, Switzerland, Turkey, the US, and the UK. These nation are accused of creating the problem because they have used fossil fuels to discontinue the use of horses, whale oil, backbreaking labor, inadequate living conditions, child labor, while at the same time providing affordable and available electricity— just to mention a few reasons.
The first submission of NDCs were underwhelming. And since then, the story is:
President Xi and the then President Obama met. Obama was going to bring China into the PA. The deal was that China could continue increasing their emission until 2030 without disapproval of the PA organization. From China’s perspective it was a perfect opportunity to build up their manufacturing/economy while the other nations were destroying theirs.
China has disappointed in every way, especially those who thought China was really into environmental stuff. China recently announced that wind and solar are too unreliable to depend upon. An added that they were reducing support to renewables. That was followed by the fact that they were going to build more coal plants. They offered to buy the UKs steel business. Does that sound like someone who worries about the global warming theory? Their new five-year plan that was expected to be based upon using less coal, turned out to be based on more coal.
“At a time when China is so obviously saying one thing and doing another, and clearly not fulfilling its share of the world’s commitments to reducing CO2 emissions — as the world’s second-largest economy– sends all the wrong signals. What China and others see is that no matter what it does — even if it deceives the world and continues its predatory behavior — the US is willing to reduce its own competitiveness, leaving China a thick red carpet to become the world’s dominant superpower, the very role to which it aspires. “
This same Gatestone posting also reminds that the Chinese government are not people of their word:
“It is extremely unlikely that China will deliver on its climate commitments and there are enough precedents to show that the CCP’s pledges cannot be trusted. In 1984, China pledged that Hong Kong’s autonomy, including its rights and freedoms, would remain unchanged for 50 years under the principle of “one country, two systems” after the 1997 return to Chinese sovereignty. By June 2020, however, when China introduced its iron-fisted national security law in Hong Kong, China had reneged on its pledge, and the CCP continues to crush Hong Kong.
China also broke its 2015 commitment not to militarize artificial islands that Beijing has been building in the Spratly Islands chain in the South China Sea and it has never honored at least nine of the commitments it made when it joined the World Trade Organization, to name just a few instances.
The list of broken pledges does not even include the lies that China told the world about the supposed non-transmissibility of the Coronavirus, which originated in Wuhan and has so far taken more than three million lives and ravaged countless economies.”
And another pact, the Montreal Protocol on Ozone is another example of a broken pledge. Jonathan Turley’s post titled China found in massive violation of the Montreal Protocol:
“A study in Nature shows a massive violation by China in the release of ozone-depleting gases like chlorofluorocarbons. China agreed to the Montreal Protocol to stop such CFC pollution. However, it now appears that the Chinese regime is violating the Protocol. A concentration of increased CFC pollution was traced to the northeastern provinces of Shandong and Hebei.”
“We find no evidence for a significant increase in CFC-11 emissions from any other eastern Asian countries or other regions of the world where there are available data for the detection of regional emissions. “
“Several considerations suggest that the increase in CFC-11 emissions from Eastern mainland China is likely to be the result of new production and use, which is inconsistent with the Montreal Protocol agreement to phase out global chlorofluorocarbon production by 2010.”
“If China cannot comply with the Montreal Protocol to control these most dangerous pollutants (particularly with the availability of alternatives for industry) the nation undermines its already low credibility on environmental compliance.”
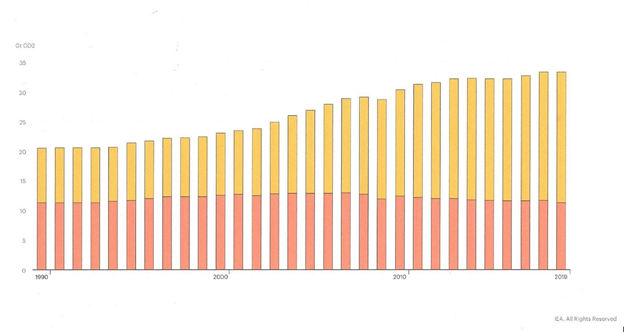
Look at what is already under way. This chart by IEA shows the Energy Related CO2 Emissions. The table that follows illustrates that the Advanced Economies have a diminishing role in controlling CO2 emissions.
Yellow is “Rest of the World” and rust is “Advanced Economies”.
IEA Chart
2010 2019
GtCO2
% of Total
GtCO2
% of Total
Advanced Economies
12.6
54.5
11.3
34
Rest of the World
10.5
45.5
22.0
66.0
Total
23.1
100
33.3
100
Energy Related C02 Emissions
IEA Data
In ten years, the advanced Economies reduced their energy related emissions by 1.3 GtCO2. The Rest of the World increased their emissions by 11.5 GtCO2. Neither China, nor India nor Brazil nor Russia nor the other Asian and African nations are going to stop installation of fossil fuel-based energy. Their reasons for this are many but they want their people to have electricity and other products of fossil fuels, too.
So, John Kerry nailed it, ““Not when almost 90 percent of all of the planet’s global emissions come from outside of US borders. We could go to zero tomorrow and the problem isn’t solved,”
If the West attempts to decarbonize, it will not succeed. I think that the further they get in this futile and misdirected attempt will be disastrous —not to the climate but to the viability of the West. The public will eventually wake up to the facts. Price rises for everything and sharp rises for electricity and gasoline, the new name for renewable will be unreliables, jobs will disappear as manufacturing leaves our shores for lower cost energy, and an unease about the US loss of stature and ability to protect its citizens. These things are likely to create public awareness that the government programs have had disappointing results.
If the West attempts to decarbonize, it will not succeed. I think that the further they get in this futile and misdirected attempt will be disastrous —not to the climate but to the viability of the West.
There is another party that wants to see the West fail. That is a movement titled the Great Reset. This blog will discuss the Great Reset in the next posting.
From a recent Dr. Roy Spencer blog: Seldom is the public ever informed of these glaring discrepancies between basic science and what politicians and pop-scientists tell us. Why does it matter? It matters because there is no Climate Crisis. There is no Climate Emergency. Yes, irregular warming is occurring. Yes, it is at least partly due to human greenhouse gas emissions. But seldom are the benefits of a somewhat warmer climate system mentioned, or the benefits of more CO2 in the atmosphere (which is required for life on Earth to exist). But if we waste trillions of dollars (that’s just here in the U.S. — meanwhile, China will always do what is in the best interests of China) then that is trillions of dollars not available for the real necessities of life. Prosperity will suffer, and for no good reason.“
This is the fifth posting of a series listing things that the alarmists and the mainstream media do not want made public. At the top of this posting is a link to the preceding postings.
To hear the global warming alarmists, carbon dioxide (CO2) is poison. It is on a mission to destroy the Earth. It is a pollutant that must be stopped. There are some people convinced that if fossil fuels burning was completely stopped, there would be no more CO2 anywhere. The alarmists do not want you to know how beneficial CO2 is.
“Carbon is the backbone of life on Earth. We are made of carbon, we eat carbon, and our civilizations—our economies, our homes, our means of transport—are built on carbon”. That is a quote from NASA’s posting, the Carbon Cycle.
POISON
Let us begin by disposing of the myth that CO2 is a poison. Do you know that every time you exhale, your breath contains about 40,000 parts per million (ppm) CO2. That contrasts with air you breathe that has a concentration of about 415ppm.
MAN-MADE CO2 IS A SMALL FRACTION OF THE CARBON CYCLE
The NASA chart below tells the story of the CO2 from manmade sources, and natural source. The natural sources are in white and the man-made sources are in red. The numbers are gigatons of carbon presumably because the form that carbon assumes in this chart might not always be in the form of carbon dioxide **.
According to this chart, five of the nine manmade gigatonnes of carbon are removed from the atmosphere. The “greening” of the Earth’s surface is attributable to an increase in atmospheric CO2, that would explain the “Net terrestrial uptake shown on the chart.
\
Into Atmosphere
Man Made
Fossil Fuels, Concrete etc.
9-5 GtC/Y
in
Plants
Respiration
60
in
Soil
Respir & Decomp
60
in
Ocean
Respir & Decomp
90
Out of Atmosphere
Plants
Photosynthesis &Biomass
120 + 3
out
Ocean
Photosynthesis
90+ 2
Atmosphere Net
In
214 G tC/Y
Atmosphere Net
Out
210 GtC/Y
GtC/Y is gigatonnes of carbon per year. (1 gigatonne =billion tonnes.) (1 tonne =2205 pounds)
** CO2’s molecular weight is 44 because it is made up of 12 from carbon and 32 from two oxygens. Thus, the gigatonnes of CO2 are larger than the fraction of carbon (C) numbers shown on the chart.
The most accurate number on the chart is probably the net increase in the atmosphere as it is considered well mixed. Measurements of atmospheric CO2 concentration are made frequently and in several places around the globe.
It is likely, that the fossil fuel, etc. number is the next most accurate number on this chart. Emission sources are reasonably known so a fairly good estimate can be made. The other numbers may be swags (Scientific Wild Ass Guess).
The amount of manmade CO2 relative to the amount of natural CO2 is quite small. It is about 4% of the total.
CROP PRODUCTION SETS RECORDS DUE TO INCREASED ATMOSPHERIC CONCENTRATION OF C02.
Trend in Annual Average Leaf Area 2000 to 2017
Satellite images show that plant cover has become lush all over the world. This increase in green biomass worldwide is equivalent to a new green continent twice the size of the US.
It has been long known that increasing CO2 benefits plant growth through the CO2 fertilization effect. Recognizing the benefits of this, greenhouses often increase CO2 to 1,500 ppm. Research from laboratory studies by the Center for the Study of CO2 and Global Change has documented that a 300 ppm rise in CO2 levels would increase plant biomass by 25 to 50%. This significant boost in plant productivity, along with a boost from lengthening growing seasons, means that we are better able to feed a hungry planet.
An additional significant benefit from this increasing CO2 fertilization is that the plants have smaller stomata (pores) and have lessened water needs. Less water used means that more stays in the ground and is leading to increased soil moisture across much of the planet and a “greening” of the Earth. According to NASA, up to 50% of the Earth is “greening,” in part due to higher CO2 levels. This increased soil moisture is a primary cause for the long-term decrease in forest fires and droughts worldwide.
A group of scientists from Australia, focusing on the southwestern corner of North America, Australia’s outback, the Middle East, and some parts of Africa studied satellite imagery by teasing out the influence of carbon dioxide on greening from other factors such as precipitation, air temperature, the amount of light, and land-use changes. The team’s model predicted that foliage would increase by some 5 to 10 percent given the 14 percent increase in atmospheric CO2 concentration during the study period. The satellite data agreed, showing an 11 percent increase in foliage after adjusting the data for precipitation, yielding “strong support for our hypothesis,” the team reports.
In addition to greening dry regions, the CO2 fertilization effect could switch the types of vegetation that dominate in those regions. “Trees are re-invading grass lands, and this could quite possibly be related to the CO2 effect,” Donohue said. “Long lived woody plants are deep rooted and are likely to benefit more than grasses from an increase in CO2.”
And food crops are setting new records in addition to its record forecast for global wheat production in 2021, the FAO said it’s expecting a new and higher estimate for world cereal production in 2020, now seen at 2.76 billion tonnes, a 1.9% increase from the previous year, lifted by higher-than-expected outturns reported for maize in West Africa, for rice in India, and wheat harvests in the European Union, Kazakhstan, and the Russian Federation.
“ … the global wheat out turn is seen at a record, while maize is placed at the second largest ever and barley at the highest in a decade,” the report said.
The leader in studying CO2 effects on plant growth is the CO2 Science Organization. One of their studies is as follows:
The first step in determining the monetary benefit of historical atmospheric CO2 enrichment on historic crop production begins by calculating what portion of each crop’s annual yield over the period 1961-2011 was due to each year’s increase in atmospheric CO2 concentration above the baseline value of 280 ppm that existed at the beginning of the Industrial Revolution.
To summarize what they did was begin with the wheat body mass and yield that occurred in 1961 and what it would be 50 years later using the CO2 growth factor. The atmospheric CO2 concentration went up during those 50 years by 37.4 ppm. They did account for the factors such as new improvements in the wheat seed, the amount of planting of during those years for example. This was to make sure that only the CO2 enhancement part would be used to determine the money benefits. The resultant value of 4.35% indicates the degree by which the 1961 yield was enhanced above the baseline yield value corresponding to an atmospheric CO2 concentration of 280 ppm. They also used constant dollars for the study.
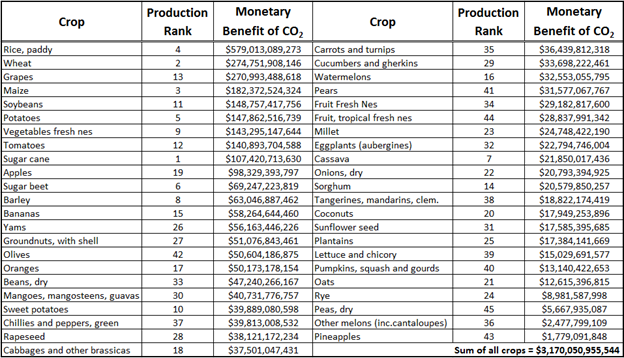
Table 3. The total monetary benefit of Earth’s rising atmospheric CO2 concentration on each of the forty-five crops listed in Table 1 for the 50-year period 1961-2011. Values are in constant 2004-2006 U.S. dollars.
.
As can be seen from Table 3, the financial benefit of Earth’s rising atmospheric CO2 concentration on global food production is enormous. Such benefits over the period 1961-2011 have amounted to at least $1 billion for each of the 45 crops examined; and for nine of the crops the monetary increase due to CO2 over this period is well over $100 billion. The largest of these benefits is noted for rice, wheat, and grapes, which saw increases of $579 billion, $274 billion and $270 billion, respective.
Yes, the monetary benefit of all the crops, is $3,170,050,955,544. $3+trillion.
This report also calculates what the benefit would be by 2050. That sums up to $9.765 trillion. The full report can be seen by clicking this link.
These results will be rehashed when this series discusses the Social Cost of Carbon.
The following, recent study found that the greening was playing a “beneficial role of the land carbon sinks……”
CO2-induced planetary greening leads to an enormous expansion of Earth’s carbon sink.
By 2100 this greening-sink effect will offset 17 years of equivalent human CO2 emissions.
This easily supersedes the effect of the Paris Agreement’s CO2-mitigation policies.
In a break from the deflating global news of viral infections and rising death rates, a groundbreaking new study (Haverd et al., 2020) affirms the “beneficial role of the land carbon sink in modulating future excess anthropogenic CO2 consistent with the target of the Paris Agreement” via the fertilization effect of rising CO2.
There has been a 30% rise in global greening since 1900. CO2 fertilization is the “dominant driver” of these greening trends, with an additional positive contribution from climate warming.
When CO2 levels double (to 560 ppm), this CO2-fertilization-greening effect is expected to increase to 47%.
Growth in the land’s carbon sink – absorbing excess CO2 emissions – will reach 174 PgC by the end of the century.”
This is the equivalent of eliminating 17 full years of human CO2 emissions.”
There are still some government groups and alarmists that are denigrating the crops produced by the CO2 greening effect.
“In their Summary for Policymakers issued in 2014, the UN intergovernmental Panel on Climate Change acknowledges that the planet has greened, but they say that major crops that 1C above preindustrial levels will negatively impact yields, further they say that thereafter median yields will be reduced by 0 to 2% per decade”.
We are 7 years down the road, and the greening and crop records just keep rolling in despite this forecast by the IPCC.
“We analyzed the impact of elevated CO2 concentrations on the sufficiency of dietary intake of iron, zinc and protein for the populations of 151 countries using a model of per-capita food availability stratified by age and sex, assuming constant diets and excluding other climate impacts on food production. We estimate that elevated CO2 could cause an additional 175 million people to be zinc deficient and an additional 122 million people to be protein deficient (assuming 2050 population and CO2 projections). For iron, 1.4 billion women of childbearing age and children under 5 are in countries with greater than 20% anaemia prevalence and would lose >4% of dietary iron.”
Don’t you like how these experts think they can detail the numbers of people that will be harmed. They are not good at this. Never do these IPCC types ever find anything but doom for any theory but theirs.
“And Prof Judith Curry, the former chair of Earth and atmospheric sciences at the Georgia Institute of Technology, added: “It is inappropriate to dismiss the arguments of the so-called contrarians, since their disagreement with the consensus reflects conflicts of values and a preference for the empirical (i.e., what has been observed) versus the hypothetical (i.e., what is projected from climate models).
“These disagreements are at the heart of the public debate on climate change, and these issues should be debated, not dismissed.”
NASA has not hidden this information, but the alarmists and the mainstream media have done their best to prevent you from seeing it.
No matter how they try to eliminate CO2 it just keeps making life more livable. It is part of the energy making process in plants and animals. without which we would all die. The mass starvation predicted by the alarmists as the world’s population ballooned, did not happen because CO2 increased the food supply.
From a recent Dr. Roy Spencer blog: Seldom is the public ever informed of these glaring discrepancies between basic science and what politicians and pop-scientists tell us. Why does it matter? It matters because there is no Climate Crisis. There is no Climate Emergency. Yes, irregular warming is occurring. Yes, it is at least partly due to human greenhouse gas emissions. But seldom are the benefits of a somewhat warmer climate system mentioned, or the benefits of more CO2 in the atmosphere (which is required for life on Earth to exist). But if we waste trillions of dollars (that’s just here in the U.S. — meanwhile, China will always do what is in the best interests of China) then that is trillions of dollars not available for the real necessities of life. Prosperity will suffer, and for no good reason.“
In the previous postings, the computers predicting global temperatures were shown to be much higher than the actual measured temperatures and that you are not being told that the actual measured global temperatures are currently falling and do not seem to have a link with the rising CO2 accumulating in the atmosphere. This posting looks at the future predictions of global temperatures and how they are biased to make you think they are going to be rising quickly.
To have some understanding how the computers are programed one needs to be acquainted with Equilibrium Climate Sensitivity (ECS) and Representative Concentration Pathways (RCP).
ECS
Firstly, an examination of ECS. The 1979 Charney Report, named for the Chairman of an Ad Hoc group stated:
“We believe, therefore, that the equilibrium surface global warming due to doubled CO2 will be in the range IC to 4C, with the most probable value near 3°C”.
That means, for a doubling of atmospheric CO2, global temperature will rise approximately 1C due to CO2, and the CO2 induced increase in temperature will result in more water vapor. Water vapor is a powerful greenhouse gas. That and some other minor changes in atmospheric gases will result in an additional rise of 2C. Thus, CO2 doubling does not just create 1C rise but rather a 3C rise. They acknowledged that there was a lot of uncertainty about this number. How water vapor and clouds interact are not yet known with any certainty.
Climate sensitivity is expressed two ways. Transient Climate Sensitivity (TCS) is the initial effect of the change in CO2 concentration. ECS does not happen until the oceans heat come into equilibrium with atmospheric heat, for example.
ECS is controversial. There are those that do not believe in the CO2 effect at all. They may not appreciate this postings discussion of ECS and RCP but the posting is addressing what the Alarmists believe. Also, many others buy into the concept but conclude that the effect is much lower than the 3C rise due to a doubling of atmospheric CO2. Down as low as 1C. As well, there are alarmists that use ECS in the 4C range.
As can be seen in the Part 1 posting, the ECS being used has yielded too high of global temperatures.
It has long been known that previous generations of climate models exhibit excessive warming rates in the tropical troposphere. With the release of the CMIP6 (Coupled Model Intercomparison Project Version 6) climate model archive we can now update the comparison. We examined historical (hindcast) runs from 38 CMIP6 models in which the models were run using historically observed forcings. We focus on the 1979–2014 interval, the maximum for which all models and observational data are available and for which the models were run with historical forcings. What was previously a tropical bias is now global. All model runs warmed faster than observations in the lower troposphere and midtroposphere, in the tropics, and globally. On average, and in most individual cases, the trend difference is significant. Warming trends in models tend to rise with the model Equilibrium Climate Sensitivity (ECS), and we present evidence that the distribution of ECS values across the model is unrealistically high.”
If you are a climate computer programmer, you can increase the ECS, and it will result in an increase in forecast temperature.
RCP
Representative Concentration Pathway (RCP) is an estimate of the amount of CO2 in the atmosphere at any given time. After studying numerous scenarios, more than the available computer time would allow, they settled on just 5 RCPs.
It is my understanding that the upcoming IPCC’s 6th Assessment Report will use somewhat revised versions of the original 5 pathways. These revisions are to accommodate current thinking about the options and potential pathways. Only RCP 8.5 remains as orginally conceived. At least one of the pathways will meet Paris Agreement goal of of keeping global temperature rise below 1.5C . In between 1.5 and 8.5are three others that do not meet the objective but are considered potential outcomes depending on mitigation policies. The pathways keep track of the forecast fossil fuel emissions of CO2” versus “years” beginning at the current time continuing out to the year 2100.
The alarmists and many other warmers are using RCP8.5 as Business As Usual. Most are not notifying the reader that the forecast CO2 in the atmosphere for their predicted temperatures is the HIGHLY UNLIKELY pathway. Some postings have said that it is physically impossible, requiring such things as all the minable coal would have to be burned. What does this amount to? The alarmists are using the Highest CO2 concentration. They are also using a Equilibrium Climate Sensitivity that historically is too high. This combination will deliver Highly Unlikely predicted global temperatures. They need to scare you into going along with the alarmist’s program.
Some scientists and engineers do not believe that carbon dioxide emissions and other so-called greenhouse gases are causing global temperature to rise. My guess is that most of the scientists and engineers believe that those gases do influence the globe’s temperature. Within the believing group, however, there is a divide as to how much temperature rise can be attributed to the greenhouse gases. (Your host, cbdakota, is an agnostic skeptic that believes that on-the- whole, the sun is in control).
From a recent Dr. Roy Spencer blog:
“Yes, more CO2 must produce some warming. But the amount of warming makes all the difference to global energy policies. Seldom is the public ever informed of these glaring discrepancies between basic science and what politicians and pop-scientists tell us. Why does it matter? It matters because there is no Climate Crisis. There is no Climate Emergency. Yes, irregular warming is occurring. Yes, it is at least partly due to human greenhouse gas emissions. But seldom are the benefits of a somewhat warmer climate system mentioned, or the benefits of more CO2 in the atmosphere (which is required for life on Earth to exist). But if we waste trillions of dollars (that’s just here in the U.S. — meanwhile, China will always do what is in the best interests of China) then that is trillions of dollars not available for the real necessities of life. Prosperity will suffer, and for no good reason.“