Category Archives: AGW

Science Comprehension For Tea Party Members Greater Than “Not Teaparty Members”


Dan Kahan, the Elizabeth K. Dollard Professor of Law & Professor of Psychology at Yale Law School, is a member of the Cultural Cognition Project, an interdisciplinary team of scholars who use empirical methods to examine the impact of group values on perceptions of risk and related facts.  Much to his surprise, his testing revealed that Tea Party members have higher “science comprehension “ than do “not teaparty members”.  The chart below shows this result:

teapartyandsciencetpscic

Continue reading

Penn And Livingston Cycle 25 Sunspot Forecast


Penn and Livingston, in their September 2010 IAU publication “Long-Term Evolution Of Sunspot Magnetic Fields” predicted that Solar Cycle 24 would peak at an International Sunspot number of 66 and Solar Cycle 25 at 7!!

Sunspotdiagram

Considering that NASA believes that the peak for Cycle 24 will be 67, their prediction looks pretty good.   So would you bet against their Cycle 25 prediction of 7?

Continue reading

IPCC Errs When Concluding The Sun Is Not A Major Factor In Global Temperatures


While the IPCC doesn’t have an answer for why there has been no statistical increase in global temperatures for going on 17 years,  they don’t think the Sun has been a significant factor.  They  generalize that  volcanoes, deep ocean warming,  and particulate matter in the atmosphere may be the cause.

Duncan Q&A : on change of climate change : Earth and Sun

Copy of Woodcutting by TheGuardian.com by Duncan Clark

Continue reading

Solar Cycle 24 September 13 Update


The International Sunspot number for September dropped to 37 from 66 in August.    The F10.7cm solar flux moved downward as well from 115 in August to 103 in September.   Both are measures of Solar activity.  Again, Solar Cycle 24 is decidedly less active than recent Solar Cycles. (Click on the charts to improve clarity.  All charts are  by “Solar Terrestrial Activity Report”).

ssncycle24=0ct13

This chart, from Solen etc, is interesting.  The black line labled Ri is the International Sunspot number. The Rnorth indicates the number of Sunspots that were counted in the Sun’s northern hemisphere and Rsouth those formed in the southern hemisphere. Rnorth plus Rsouth equal Ri.  Rnorth peaked in late 2011 at about 97 Sunspots.  Rsouth peaked at about 50  in the middle of  last year.  The smoothed number is the official count.  The smoothed number is calculated by doing a 13 month average from the numbers that lag 6 months behind the current month.  The maximum smoothed number for Cycle 24 so far is 66.9 which occurred in early 2012.  Most of the solar cycle experts believe that will be the maximum for Cycle 24.

Below is the solar polar field strength chart updated for September showing the south and north poles have both crossed the  Sun’s equator.  It is suggested that you read the discussion regarding solar polar fields by clicking on this Forecasting Solar Cycle 25 Using The Solar Polar Field Strength”.

solarpolarfields-oct13

This chart puts Cycle 24 in perspective with Cycle 23.

ssncycles23_24-oct13

The projected Sunspot number, shown in green, is also a 13 month average but it has no six month delay built into the calculation.

cbdakota

Skeptical Scientists Effectively Challenge IPCC Climate Change Report


The IPCC has issued the 2013 report on global Climate change.  The skeptic community has effectively challenged the IPCC primary positions.   This post will provide a broad selection of those challenges for the reader to examine.   Each of the 18  entries will give you the title, a brief synopsis, and the link to that document.

The IPCC failed on two major issues.  Their failed to explain why global temperatures have not increased in the past 16 years despite a continued growth of atmospheric carbon dioxide (CO2).   The second issue is that of climate sensitivity.  They did say that in the past, they had overestimated climate sensitivity but did not tell us what they now believe it to be. This posting will also cover climate model performance and should the IPCC be discontinued.

GLOBAL TEMPERATURES

Continue reading

August Electric Vehicle Sales


This might be the right time to begin separating monthly sales of plug-in hybrids vehicles from battery vehicles.  So here goes.

Plug-in hybrids (PHV) August Sales.

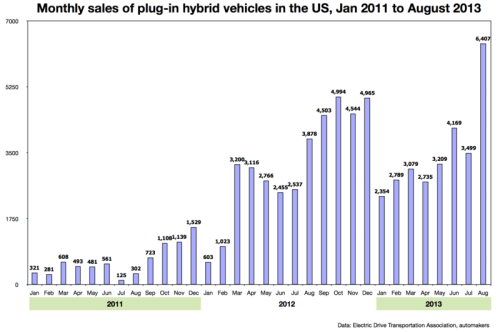
The August PHV sales were up by 83% over July’s sales.  Volt led this category with 3,351 vehicle sales and a 52% share of this market. Volt year-to-date sales were 14, 994. The Prius PHV sales were 1,791 and with year-to-date sales of 6,822.   Others making a showing were Ford C-Max with sales of 621 and Ford Fusion Energi with 600.

pluginsalesaugust136a00d8341c4fbe53ef019aff36fe6e970d-800wi

(Click on chart for clarity)

The chart does show some reasonably good upward movement for PHEV sales. But not to get too excited just yet, Green Car Congress posts that: “With overall light-duty vehicles sales of 1,503,151 units in August (up 17% year-on-year), according to AutoData, plug-in hybrids had a 0.4% share of the August new vehicle market.”

Battery Electric Vehicles (BEV) August Sales

The Nissan LEAF August sales were 2,420 with year-to-date sales at 14,123.

Tesla is the elephant in the room.  The next report on sales will be at the end of the third quarter so it is a guess where they rank in the scheme of things.  Green Car Congress reports sales of Leafs plus a number of other models with sales in the 200 or below would add to August BEV sales of 3,206.  They estimate that upward of 1700 Teslas were probably sold in August increasing the total BEV August sales to about 4,900 units. BEV sales would be about 0.3% of the August new vehicle sales.

Still far from impressive.

cbdakota

How Credible Is The IPCC Climate Reporting?


The Non-Intergovernmental Panel on Climate Change (NIPCC) has issued their 2013 report “Climate Change Reconsidered II-Physical Science”.  This report, a Summary for Policy Makers (SMP), challenges the data within the IPCC’s SMP scheduled for release this month.

Let’s contrasts the two reports.  The NIPCC science is empirical data based.  The IPCC also includes empirical data but their methodology relies heavily  on computer based guesses projections,  the scientific conclusion are revised to satisfy political objectives and the IPCC is not home to scientists that want to submit studies that contradict the message that global warming is man-made.  NIPCC says this about the IPCC: “The hypothesis implicit in all IPCC writings, though rarely explicitly stated, is that dangerous global warming is resulting, or will result, from human-related greenhouse gas emissions.”   They start with a conclusion and look for studies that support the conclusion.  That’s not the the scientific method.

Continue reading

It Is Better To Adapt Than Mitigate CO2 Emission-Mitigation Is 50X More Costly


Paraphrasing Hamlet, “Is it better to mitigate CO2 emissions from sources such as fossil fuels or adapt to global changes that might happen if emissions were not regulated?  Ah that’s the question.”

hamlet220px-Edwin_Booth_Hamlet_1870

Continue reading

Political Class Does Not Care If Climate Science Is Wrong


If you are a skeptic you may think that you are winning the science battle with the warmers.  You probably have always thought that in the end you would win that battle and that would settle things.  You were half right, you are winning the science battle but you have not yet deterred the politicians.   The science has never mattered much to them.  The warmer’s programs to combat  “global warming are really the only things that matter to them.  Whether it is Cap & Trade, Carbon tax, or some other scheme, they are for it.  They tell you they are doing this for your own good.  But in fact most of them want greater control of your life and they can do it through taxes and regulations that are at the heart of these schemes.

Continue reading

IPCC Draft Of The “Summary For Policy Makers” Leaked


The hype around the soon to be released UN Intergovernmental Panel on Climate Change (IPCC) Summary for Policy Makers  (SPM) does make me a little ill.   The last such report was issued in 2007 and it does not seem that the assemblers of the report have learned much in that time.  It is not that they have completely ignored reality but just mostly ignored it.

Continue reading