Category Archives: AGW

ExxonMobil’s— “The Outlook For Energy-View to 2040″


The ExxonMobil Report contains a wealth of information. This posting will look at the status of renewable energy in the context of the world forecasts. While there are a number of postings that contend that renewables will be a dominate player, logic says that will not be true. One recent posting declares that within ten years the world could be supplied exclusively by renewable. I would take that bet on the other side.

First some background from the ExxonMobil Report.

The world population will grow from 7.2 billion in 2014 to 9 billion in 2040. India will replace China as the world’s most populated nation at 1.6 billion people. The globes energy demand will increase by 25% from 2014 to 2040. The report believes without their forecasted improvements in energy use, demand would be double their 2040 forecast shown in the report’s 2040 forecast.

The chart below is their forecast of world energy demand 2014 to 2040:  (click on charts to enlarge)


global fundamentals energy demand_full
The dashed line is the demand without the efficiency improvement forecast in the Report.

Continue reading

Greens Want To Kill Fracking By Slashing, Already Minor, Methane Emissions


Paul Driessen’s posting covers a lot of territory. He talks about the new “big” issue, methane (CH4) in the atmosphere and the future of (or perhaps the non-future of)  solar and wind “renewable energy”. The CH4 fraud that Driessen discusses is reminiscent of what EPA has done to the country with their mercury rules. Mercury emissions are primarily from natural sources and the man-made emission sources from the US are a very small part of the whole.

Click here to read about mercury. Read Driessen’s posting below.

cbdakota

Guest essay by Paul Driessen posted on WattsUpWithThat

Quick: What is 17 cents out of $100,000? If you said 0.00017 percent, you win the jackpot.

That number, by sheer coincidence, is also the percentage of methane in Earth’s atmosphere. That’s a trivial amount, you say: 1.7 parts per million. There’s three times more helium and 230 times more carbon dioxide in the atmosphere. You’re absolutely right, again.

Equally relevant, only 19% of that global methane comes from oil, natural gas and coal production and use. Fully 33% comes from agriculture: 12% from rice growing and 21% from meat production. Still more comes from landfills and sewage treatment (11%) and burning wood and animal dung (8%). The remaining 29% comes from natural sources: oceans, wetlands, termites, forest fires and volcanoes.

The manmade portions are different for the USA: 39% energy use, 36% livestock, 18% landfills, and 8% sewage treatment and other sources. But it’s still a piddling contribution to a trivial amount in the air.

Continue reading

Climate Models Botch Another Prediction


I am reblogging a posting from realclearscience.com titled “Climate Models Botch Another Prediction”. Tom Hartsfield is the posting’s author and he sums up the issues of the continued failures of climate models and the way the warmers view themselves in a holy war and must stop the skeptics at all costs.

cbdakota

———————————————————————————————-Climate Models Botch Another Prediction:     by Tom Hartsfield

hartsfield346399_5_

Today’s news tells of another mistake of exaggerated climate science prediction.

I’m not getting in the foxhole with the warriors on either side of the raging climate war. But I think there’s something more alarming going on than the spike in CO2 level charts.

Our global system of air currents, ocean currents, cloud patterns, resonant temperature cycles, energy storage and release mechanisms, and further processes is mind-bogglingly complex.

Presently, the best climate models fall many orders of magnitude short of the power and intricacy needed to effectively predict the long-term climate patterns that emerge from the interactions of all these planetary systems. And that’s not a failure of science; it’s just the reality of how tough the problem is.

Predictions are made by building models using the smartest simplifications we have thought of and running them on the most powerful computers ever built. Basically, it’s the best we can do right now.

But there is a major failure of science going on.

Continue reading

Dr Svalgaard Makes Preliminary Prediction Of Solar Cycle 25 Size


Solar science expert Leif Svalgaard of Stanford University, makes a prediction of Solar Cycle 25 size: “Preliminarily it looks like a repeat of Cycle 24, or at least not any smaller.”

Svalgaard uses a technique that is based upon the dipole moment when the preceding Solar Cycle reaches the minimum. He used this technique for his prediction of Solar Cycle 24 sunspot number that turned out to be very close to what actually took place. He predicted Cycle 24 Sunspot numbers would be much smaller than Cycle 23 when at the same time most of the other forecasters were predicting a rerun of Cycle 23.

Continue reading

Is Global Temperature Driving The Rise In Atmospheric CO2?


The question asked in the last posting was “ If CO2 Emissions Are Not Rising, Why Is Atmospheric CO2 Rising At “Unprecedented” Rates?” The latest news is that the human emissions are flat lining but curiously the record shows that for the last four years, the atmospheric CO2 measured at Mauna Loa, has risen faster than ever.

The warmers tell us that there can be no ambiguity about why the atmospheric CO2 is climbing. It is because the “natural” carbon in the carbon cycle is perfectly balanced and addition of unnatural carbon, in the form of CO2 from the burning of fossil fuels is the cause.

For several years, several skeptics have ventured that the rise in atmospheric CO2 is due to the gradual rise of global temperatures. This thinking coincides with the results of the Antarctic Ice Core data that indicates for hundreds of thousand of years when temperature rises or falls CO2 responds to the change in temperature by rising or falling to match the temperature.

Dr. Murry Salby has been lecturing on his findings that show atmospheric CO2 coincides with changes in global temperature and shows no coincidence with increases in CO2 emissions from fossil fuels. In a nutshell, Salby’s theory says, the rate of change of CO2 in the atmosphere can be described by an equation that demonstrates that it only depends on temperature change.

Continue reading

If CO2 Emissions Are Not Rising, Why Is Atmospheric CO2 Rising At “Unprecedented” Rates?


The International Energy Agency (IEA) has announced that global carbon dioxide (CO2) emissions have not increased for two years running. They say the global economy has grown during this period and that it shows that economic growth and CO2 emissions have been decoupled. Further they are attributing this condition as likely due to renewable energy growth, and China having curbed its use of coal to improve the environment. They note that China has promised to stop increasing emission in 2030 but the IEA thinks we may be seeing the stoppage now.   Fat Chance.

You might think then that atmospheric CO2 must have flat-lined too. If you think that you are wrong.   Climatecentral.org posted “Unprecedented Spike in CO2 levels in 2015” and from that posting we get this:

” The annual growth rate of carbon dioxide in the atmosphere rose more in 2015 than scientists have ever seen in a single year, the National Oceanic and Atmospheric Administration announced Thursday.

It was the fourth year in a row that carbon dioxide concentrations grew by more than 2 parts per million, with an annual growth rate of 3.05 parts per million in 2015. ­The spike comes in the same year that Earth reached an ominous global warming milestone — scientists last year measured the highest atmospheric concentrations of carbon dioxide ever recorded.”

But wait, but wait. If the emissions are not increasing how can the atmospheric CO2 be increasing at an “unprecedented rate” or even growing at all.

Continue reading

One Papers Confirms “Pause”, Another Says It Didn’t Happen


The WUWT site, Anthony Watts posted“The ‘Karlization’ of global temperature continues – this time RSS makes a massive upwards adjustment”

It seems since my last posting,  the RSS satellite temperature record will be revised.   It appears that it will be cited as proving there was no “pause”. Dr Mears, the chief scientist of RSS said that he has been bombarded with emails wondering why the RSS is supporting the DENIER’S view. Mears believes that the denialists (his words) like to cherry pick the starting point.   Watts commented on this by saying:

” It seems to me based on his recent comments that Dr. Mears has gotten fed up with people using his RSS data set to suggest that the world isn’t warming as he expects it should”.

greengorillas3hurondrmeetings

Continue reading

Observed GlobalTemperatures Well Below IPCC 1990 Forecast


The “pause” in the global temperature rise is at 18+ years. This is disconcerting the warmer scientists because atmospheric carbon dioxide (CO2) content has been increasing during this period. The warmers have resorted to very poorly disguised attempts to alter the temperature record. Despite their temperature record alterations, the global temperature is well below that forecast by the IPCC in their 1990 report. How much altering of the record must the warmers do to get back in step with the IPCC forecasts? Lord Monckton of Brenchley has posted on the WUWT website “The abject failure of official global-warming predictions”. In his posting he compares land-based temperature organizations and satellite based temperature organizations versus the prediction by the IPCC.

Two charts follow: The first is the UAH plot of global temperatures for an 18 years and 6 months long pause. UAH is a satellite-based record. The second is the RSS satellite based temperatures which differs slightly from the UAH data. The RSS data yields a pause of 18 years and 8 months duration.

UAHtemppuaseclip_image002_thumb2

UAH Global Temperature Chart Showing Duration of the Pause. The left hand scale shows temperature anomalies (plus and minus) in degrees C. The right hand scale shows atmospheric CO2 concentration in PPM. The heavy blue line is the global temperature trend line for the period In small(er) print in the middle of the chart is the trend line slope. For this chart, the trend is a -0.01C temperature change per century.

Continue reading

Is There A Pause In Global Temperatures?


The “pause”, meaning the lack of global temperature rise in the 21st century, has gotten a lot of attention. The warmers want to deny that it is significant. The skeptics say that it is very significant in that atmospheric carbon dioxide (CO2) has been increasing during this period of time. According to the wamer’s theory, global temperatures should have been rising. Last year, some of the keepers of the global temperature records decided they had, had enough of this focus on the “pause”. So they made some bogus changes to the way the temperature was measured and when they were finished, they said—– see there really was no pause. Click here to see how they have tried to pull this off.

There are several global temperature amassing groups. These groups broadly are divided by being ground based or satellite based. The former are dependant on temperatures measured mostly from ground-based stations supplemented by some ocean surface temperature measurements. The ground-based stations are primarily in populated areas. Northern Hemisphere stations predominate. The vast areas of the oceans (75 % of the globe’s surface) are minimally covered. There are also enormous areas of land where population is very limited, or no one at all. In those areas, computers predict the missing temperatures.

The ground station leaders are: (1) (GISS), NASA Goddard Institute for Space Studies (2) (HadCRUT4) the Hadley Centre of the UK Met Office and the land surface air temperature records compiled by the Climatic Research Unit (CRU) of the University of East Anglia. (3) NCEI) NOAA’s National Centers for Environmental Information.

(For those of you with longer memories, yes, the University of East Anglia was the headquarters of the Climategate gang)

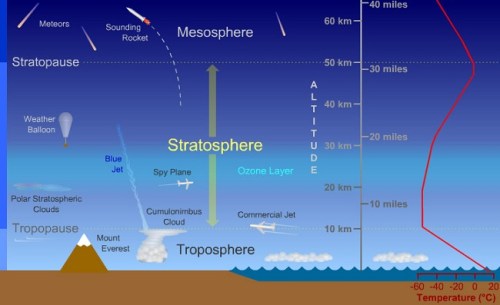
The latter group consists of two satellite based global temperature-measuring organizations. Satellites measure radiance in various wavelengths in troposphere. The troposphere extends about 7 miles above the Earth’s surface and the troposphere is where all of our weather occurs. The radiance measurements are translated into temperatures. In 1979, the University of Alabama at Huntsville (UAH) was the first satellite system to begin reading these temperatures. Start up problems are typical with any new breakthrough technology. For example early on there were problems with orbital decay and also with drift.   The UAH promptly made allowances for those problems as they have  with some smaller ones as time has past. The weather balloons (radiosondies) that have been used for many years, show agreement with the UAH satellite measurements. This is confirming proof of the satellite systems high accuracy and because it actually measures temperature across nearly the entire globe, that makes it the gold standard. The other satellite system is the Remote Sensing System (RSS). UAH and RSS have a few differences in how they make their tropospheric measurements, still the resulting temperatures are in close agreement. The satellites measurements cover about 95% of the Earth’s surface eliminating the use of computers to simulate actual measurements, as is the case with the ground based systems.

The illustration below shows the Earth’s atmosphere with the troposphere being the lowest part.

earth_stratosphere_diagram

The final player in this drama is the Intergovernmental Panel on Climate Change (IPCC). The IPCC is a branch of the UN. It was created to show how man was causing global warming and what the consequences of that would be. No, the IPCC was not created to examine the science of global warming; the founders had already decided man was the cause. The IPCC is programmed to report on the status of their work about every 5 years or so. The IPCC is often said to be the warmer’s equivalent of the “spoken word.” Most of the mainstream media accepts without question any pronouncement that is said to be from the IPCC—in their mind, it is the ultimate authority. Many major newspapers and science journals (and other media, too) do not allow, in their media, skeptical views, research, questions, letters to the editor, etc.

The IPCC produce temperature forecasts. These forecasts are the basis for catastrophic things that will happen—-flood, drought, snow, sea level, vast migrations of people, etc. —–if we do not quit using fossil fuels.

In the next posting, we will compare the IPCC temperature forecasts to the ground and satellite measured temperatures.

cbdakota


An Interesting Admission From A Top Warmer Scientist.


Reddit.com has a site called AskScience where an inquiring mind submits a question and expert scientist answer the inquiry.  Recently a question was submitted by a person concerned that the IPCC was underestimating the problem of catastrophic man-made global warming.   The questioner wanted to know the answer to the following:

” Given the nonlinear nature of the atmosphere, how can we have any confidence in long term predictions of temperature rise? “

A Major warmer scientist from MIT answered the question as follows:”

We are worried about that too. Climate is an enormously complex system and we do not pretend that we can predict is with much accuracy, which is why, for example, in the IPCC reports there is a generous range of possible outcomes. (K.E.)   (My emphasis.)

green_men_of_climate_alarmism

Kerry Emanuel (KE) answered that question.   Are you asking who he is? Well, see the following introduction that he provided:

“I’m Kerry Emanuel, a Professor of Atmospheric Science at the Massachusetts Institute of Technology in Cambridge, Massachusetts. I do research on hurricanes and other types of severe weather, on climate change, and how climate change might affect severe weather. My research is mostly theoretical, but I also build computer models and occasionally participate in field experiments and build and use laboratory experiments. I have flown research aircraft into hurricanes, and wrote a book called “Divine Wind: The History and Science of Hurricanes”, aimed at a general reader and covering both the science of hurricane and how they have influenced history, art, and literature.”

If one googles Dr Emanuel, the source will almost invariably call him a “conservative warmer”. At one time he did vote for a Republican candidate. However he voted for President Obama because Emanuel admits that he is a single-issue voter and Obama signs the warmer’s songs. So much for being called a conservative.

Anyway, almost all of us agree with Dr Emanuel that warmer’s predictions are unlikely to be accurate.

cbdakota