
Dr. Roy Spencer posted ‘EPIC FAIL: 73 Climate Models vs. Observations for Tropical Tropospheric Temperature” on his website. The posting used, “Courtesy of John Christy, a comparison between 73 CMIP5 models (archived at the KNMI Climate Explorer website) and observations for the tropical bulk tropospheric temperature (aka “MT”) since 1979.” That chart is shown below: (Click chart for better view.)

The Coupled Model Intercomparison Project, (CMIP) is an assembly of the “expert’ climate models from around the world in one place as a service to the Intergovernmental Panel on Climate Change (IPCC). The chart examines the model predictions and the actual measured temperatures for the area known as the tropical mid troposphere. This area has always been the place where greenhouse gas warming would show the most profound signal according to the Anthropenic Global Warming theory (AGW)—aka, man-made global warming. The chart illustrates that the 73 CHIP model’s output ranges pretty widely in their predictions of the temperature anomaly through the years based upon the forecast increasing levels of CO2. In green with bubbles, is the average measured temperature from 4 radiosonde (weather balloons) and 2 satellites programs over the same time periods. The black line is the “mean” temperature prediction by the CMIPs computer models. The distance between the mean and the last actual measurement appears to be about +0.6°C apart.
So, Dr. Spencer says that the models are an “epic fail”. It certainly looks like Dr. Spencer called it correctly.
But there was some push-back by the warmers saying that the plots of the 73 should not have been shown as linear, that the start time of the chart was not proper and that the weather balloons and the satellite temperatures should also be shown separately rather than as an average.
Dr Spencer responded with this chart:
Spenser said about their complaints:
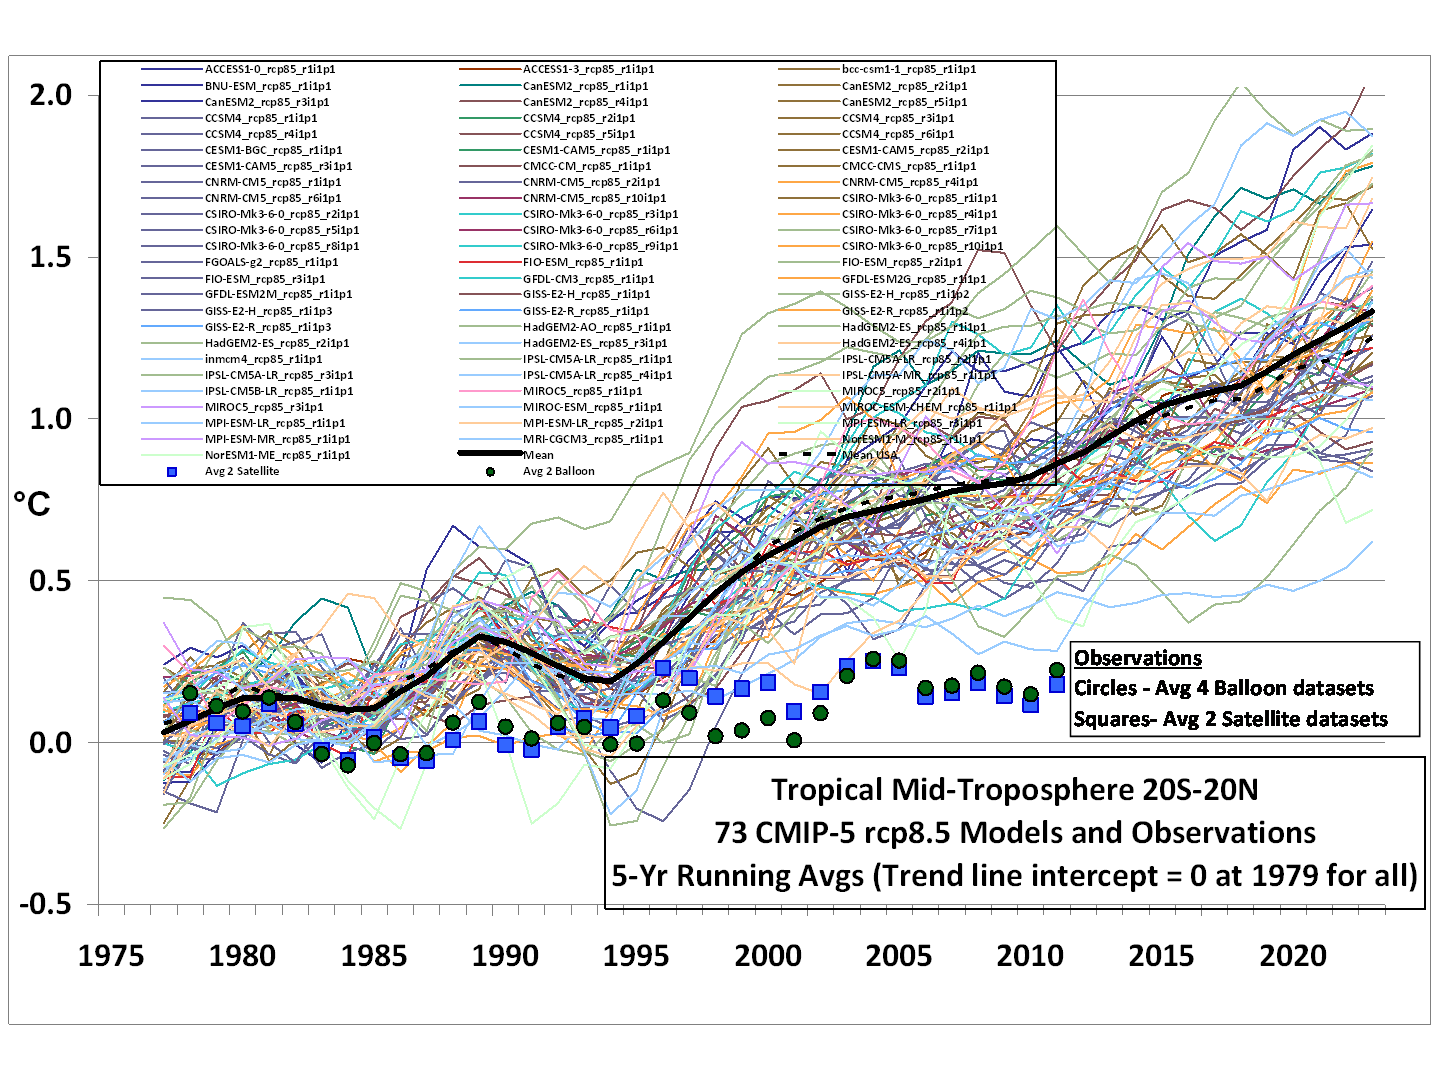
“In response to those who complained in my recent post that linear trends are not a good way to compare the models to observations (even though the modelers have claimed that it’s the long-term behavior of the models we should focus on, not individual years), here are running 5-year averages for the tropical tropospheric temperature, models versus observations (click for full size):
In this case, the models and observations have been plotted so that their respective 1979-2012 trend lines all intersect in 1979, which we believe is the most meaningful way to simultaneously plot the models’ results for comparison to the observations.”
The changes do not change the conclusion however. It is still a fail.
It is very likely that most, if not all of the modelers, are very intelligent people. When I see the mess of curves that these modelers produce, one thing always occurs to me—If you could actually model the atmosphere to get a forecast temperature, you would only need one model.
Any more that than shows that all these bright people have 73 different ideas of how the atmosphere works and not one of them can duplicate actual measurements.
cbdakota

Pingback: “Ensemble Of Climate Models Is Statistically Meaningless” | Climate Change Sanity
Gee, how come I didn’t see this on sites like phys.org. Just no money in HoHum?