
The source for this posting comes from work done by Dr Roy Spencer. His web site can be accessed by clicking here.
Satellite Measured Atmospheric Temperature Anomalies.
First the University of Alabama –Huntsville (UAH) satellite global temperature anomaly. The May anomaly dropped to +0.074 C from April’s anomaly of +0.103. The global temperature anomaly in January 2013 was +0.504 which was the highest temperature since early 2010. This chart below covers the time period that the satellite system has been in existence. By contrast with the ground based temperature measuring systems, the satellite system is essentially global in that it is measuring lower atmospheric temperature of the ¾ of the globe represented by the oceans as well as the ground. It is the gold standard of global temperature measurements in my opinion. (Click on Charts to Enlarge.)

The global, hemispheric, and tropical LT anomalies from the 30-year (1981-2010) average for the last 17 months are:
YR MON GLOBAL NH SH TROPICS
2012 1 -0.134 -0.065 -0.203 -0.256
2012 2 -0.135 +0.018 -0.289 -0.320
2012 3 +0.051 +0.119 -0.017 -0.238
2012 4 +0.232 +0.351 +0.114 -0.242
2012 5 +0.179 +0.337 +0.021 -0.098
2012 6 +0.235 +0.370 +0.101 -0.019
2012 7 +0.130 +0.256 +0.003 +0.142
2012 8 +0.208 +0.214 +0.202 +0.062
2012 9 +0.339 +0.350 +0.327 +0.153
2012 10 +0.333 +0.306 +0.361 +0.109
2012 11 +0.282 +0.299 +0.265 +0.172
2012 12 +0.206 +0.148 +0.264 +0.138
2013 1 +0.504 +0.555 +0.453 +0.371
2013 2 +0.175 +0.368 -0.018 +0.168
2013 3 +0.183 +0.329 +0.038 +0.226
2013 4 +0.103 +0.120 +0.086 +0.167
2013 5 +0.074 +0.162 -0.013 +0.113
YR=year; MON=month; Global; NH=Northern Hemisphere; SH=Southern Hemisphere; Tropics.
Satellite Measured Sea Surface Temperature Anomalies
Satellite measured sea surface temperature anomalies are shown in the chart below.
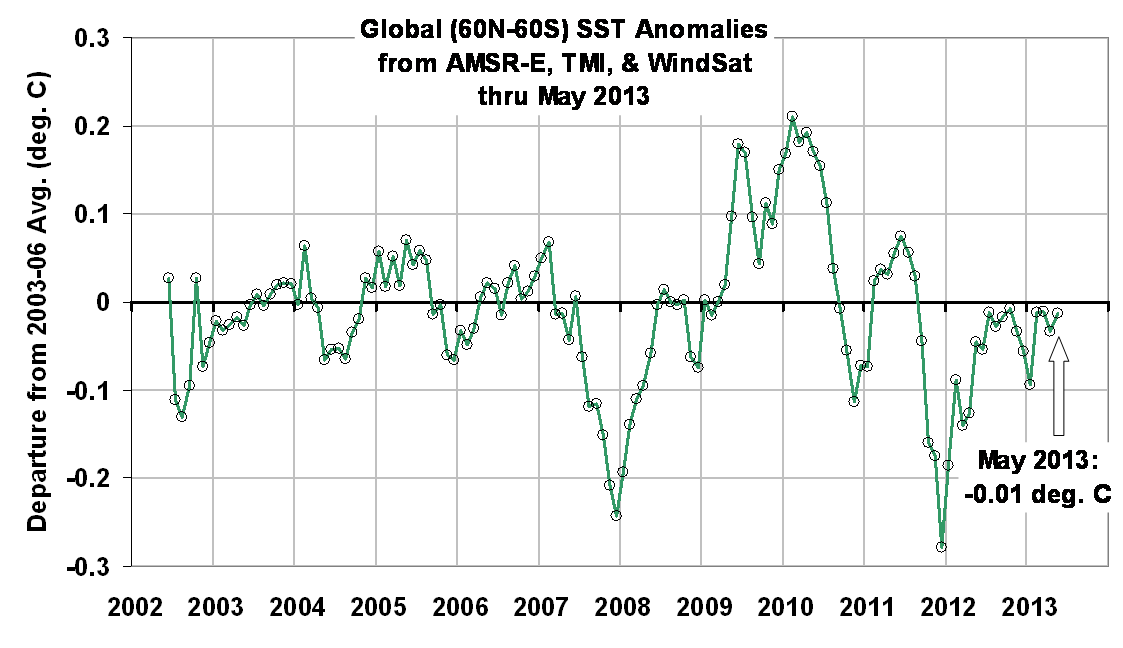
Dr Spencer summaries this chart as follows:
“The anomalies are computed relative to only 2003-2006 because those years were relatively free of El Nino and La Nina activity, which if included would cause temperature anomaly artifacts in other years. Thus, these anomalies cannot be directly compared to, say, the Reynolds anomalies which extend back to the early 1980s. Nevertheless, they should be useful for monitoring signs of recent ocean surface warming, which appears to have stalled since at least the early 2000′s. (For those who also track our lower tropospheric temperature [“LT”] anomalies, these SST anomalies average about 0.20 deg. C cooler than LT since mid-2002, but there is considerable variability in that number).
The SST retrievals come from Remote Sensing Systems (RSS), and are based upon passive microwave observations of the ocean surface from AMSR-E on NASA’s Aqua satellite, the TRMM satellite Microwave Imager (TMI), and WindSat. While TMI has operated continuously through the time period (but only over the tropics and subtropics), AMSR-E stopped nominal operation in October 2011, after which Remote Sensing Systems patched in SST data from WindSat. These various satellite SST datasets have been carefully intercalibrated by RSS.”
These charts are consistent with the concept of no statistically significant change in global temperature for the past 15 years.
cbdakota
