Category Archives: Sunspots

Penn And Livingston Cycle 25 Sunspot Forecast


Penn and Livingston, in their September 2010 IAU publication “Long-Term Evolution Of Sunspot Magnetic Fields” predicted that Solar Cycle 24 would peak at an International Sunspot number of 66 and Solar Cycle 25 at 7!!

Sunspotdiagram

Considering that NASA believes that the peak for Cycle 24 will be 67, their prediction looks pretty good.   So would you bet against their Cycle 25 prediction of 7?

Continue reading

Solar Cycle 24 September 13 Update


The International Sunspot number for September dropped to 37 from 66 in August.    The F10.7cm solar flux moved downward as well from 115 in August to 103 in September.   Both are measures of Solar activity.  Again, Solar Cycle 24 is decidedly less active than recent Solar Cycles. (Click on the charts to improve clarity.  All charts are  by “Solar Terrestrial Activity Report”).

ssncycle24=0ct13

This chart, from Solen etc, is interesting.  The black line labled Ri is the International Sunspot number. The Rnorth indicates the number of Sunspots that were counted in the Sun’s northern hemisphere and Rsouth those formed in the southern hemisphere. Rnorth plus Rsouth equal Ri.  Rnorth peaked in late 2011 at about 97 Sunspots.  Rsouth peaked at about 50  in the middle of  last year.  The smoothed number is the official count.  The smoothed number is calculated by doing a 13 month average from the numbers that lag 6 months behind the current month.  The maximum smoothed number for Cycle 24 so far is 66.9 which occurred in early 2012.  Most of the solar cycle experts believe that will be the maximum for Cycle 24.

Below is the solar polar field strength chart updated for September showing the south and north poles have both crossed the  Sun’s equator.  It is suggested that you read the discussion regarding solar polar fields by clicking on this Forecasting Solar Cycle 25 Using The Solar Polar Field Strength”.

solarpolarfields-oct13

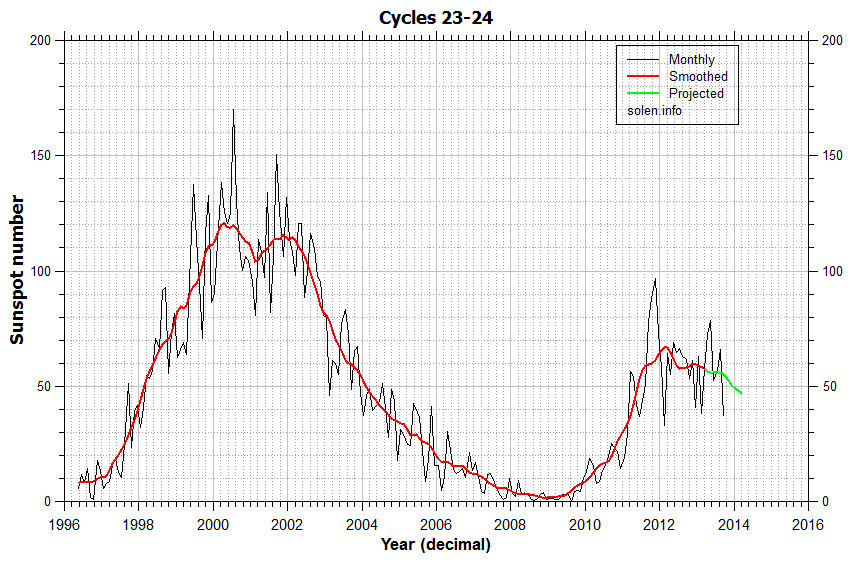
This chart puts Cycle 24 in perspective with Cycle 23.

ssncycles23_24-oct13

The projected Sunspot number, shown in green, is also a 13 month average but it has no six month delay built into the calculation.

cbdakota

Forecasting Solar Cycle 25 Using The Solar Polar Field Strength


Forecasting the strength of Solar Cycle 25 will not  be easy.  The expert’s track record for their Cycle 24 predictions show how hard it is.   For example, Doctor David Hathaway is quoted in December 2006 that cycle 24 would “be one of the most intense since record keeping began 400 years ago.”   He forecast 160+/- 25 as the peak Smoothed International Sunspot Number (SISN). His prediction as charted in 2006 below:

hathaway2billsunspot_med

Continue reading

Solar Cycle 24— August 2013 Update


Solar Cycle 24’s Sunspot number bounced up a little as did the F10.7cm radio flux.   However, Cycle 24 is still on track to be the least active Cycle since the first part of the last century.  The Sun’s North pole appears to have firmly switched its polarity but the South Pole may be months away from switching its polarity.  A cycle’s “maximum” is usually called when both poles have done the swap.

The August Sunspot and the F10.7cm radio flux are shown below (Click on Charts to enhance view):

Continue reading

Svensmark Theory—Cosmic Rays Contribute To Lower Global Temperatures


The previous posting closed with: Low Sunspot numbers and low F 10.7 indicate low solar activity.  How this activity translates to cooler weather is not clear.  The correlation between low activity and cooler weather has been know for several hundred year (or perhaps longer— recently read that the Chinese recorded Sunspot numbers many century’s ago and reported this correlation.)

One possible explanation is the Svensmark theory. This theory begins with high energy galactic cosmic rays (GCR) entering the Earth’s atmosphere where they collide with atmospheric molecules of oxygen. The collisions shatter the molecules and the resulting particles become nuclei for cloud droplets from which clouds are formed. Clouds reflect a significant amount of the Sun’s radiation back into space.  The weaker the Sun’s magnetic field (low solar activity),  the more GCR enter the atmosphere.  The more clouds, the more cooling.   This is opposed to the situation where the Sun’s activity is high, fewer GCR result in fewer clouds.

Continue reading

Solar Cycle 24 July Update


NASA predicts a solar magnetic field reversal in about 3 to 4 months.  When that happens, Solar Cycle 24 will have reached what is known as the cycle maximum.  After that the Sunspot numbers will decrease with time. There is a possibility that a  short period of none at all  will happen before Cycle 25 kicks in. NASA has produced a video that discusses the mechanism and the implications of the solar magnetic field reversal.  The video can be viewed by clicking here.

The July charts for Sunspots and F10.7 cm Radio flux are shown below.

sunspotjuly13

Continue reading

Solar Cycle 24 Update-June 2013


Solar Cycle 24 activity was low in June.  Sunspots took a sizable drop from about 77 in May to 52 in June.  Solar flux dropped as well.  (Click on charts to enhance clarity.)

sunspotjune13

solar24fluxjune13

The experts believe that Cycle 24 will match Cycle 14.  NASA is predicting Cycle 24 Sunspot peak at 67 whereas Cycle 14’s peak was 64.   Cycle 14 began February, 1902 and ended August, 1913.  Temperatures during that time were much colder than the average since that time.  My March 8, 2013 posting has some interesting statistics to make comparisons of Cycle 24 and other Solar Cycles.  There is a plot of temperature anomalies from 1880 to 2010 that you can compare to Solar Cycle size. You can access that data by clicking here.

cbdakota

SOLAR CYCLE 24 APRIL UPDATE// RUSSIAN TEAM SAYS COOLING MAY LAST FOR MORE THAN 200 YEARS.


There was an uptick in Sunspot numbers and F10.7cm radio flux.   Sunspots monthly average went up to 72  versus  55 in March.   Cycle 24’s  pattern seems somewhat reminiscent of Cycle 23 during its time at or near maximum. (Click on charts to enlarge.)
cycles23_24APRIL13Chart curtsey of Solen.com
Sunspots appear to be in sync with the predicted path shown as the green line in the chart.

Solar Cycle 24 March Update


There was a small upward spike in Sunspot numbers in March.   Dean Pesnell of NASA’s Goddard Space Flight Center thinks this will make Cycle 24 a double peak “maximum” event.  He says that the second peak may even last into 2014.
(Click on the Charts for more Clarity)
March13sunspots

Solar Cycle 24 Activity Compared To Previous Solar Cycles


Solar Cycle 24 activity dropped off in February.  Charts for sunspots and F10.7 cm radio flux follow:
sunspotmarch13