
The previous posting closed with: Low Sunspot numbers and low F 10.7 indicate low solar activity. How this activity translates to cooler weather is not clear. The correlation between low activity and cooler weather has been know for several hundred year (or perhaps longer— recently read that the Chinese recorded Sunspot numbers many century’s ago and reported this correlation.)
One possible explanation is the Svensmark theory. This theory begins with high energy galactic cosmic rays (GCR) entering the Earth’s atmosphere where they collide with atmospheric molecules of oxygen. The collisions shatter the molecules and the resulting particles become nuclei for cloud droplets from which clouds are formed. Clouds reflect a significant amount of the Sun’s radiation back into space. The weaker the Sun’s magnetic field (low solar activity), the more GCR enter the atmosphere. The more clouds, the more cooling. This is opposed to the situation where the Sun’s activity is high, fewer GCR result in fewer clouds.
(A note in passing—-the term “cosmic rays” originated under the mistaken belief that the rays were electromagnetic radiation. It was subsequently learned that they really are composed primarily of high-energy protons and atomic nuclei. High energy GCR are thought to be the product of supernovae of massive stars. )
CERN has been working to prove or disprove this theory since 2011. So far they have demonstrated that clouds are formed, but their results suggest that not enough to have a real impact on Global temperatures. They are still working on this program and a search failed to find any recent updates from the investigating team.
An interesting bit of research was undertaken by Dr Roy Spencer. He said:
While I have been skeptical of Svensmark’s cosmic ray theory up until now, it looks like the evidence is becoming too strong for me to ignore. The following results will surely be controversial, and the reader should remember that what follows is not peer reviewed, and is only a preliminary estimate.
What the above three plots (to see them, click here) show is that for a 1,000 count increase in GCR activity as measured at Moscow (which is somewhat less than the increase between Solar Max and Solar Min), there appears to be:
(1) an increase in reflected sunlight (SW) of 0.64 Watts per sq. meter, probably mostly due to an increase in low cloud cover;
(2) virtually no change in emitted infrared (LW) of +0.02 Watts per sq. meter;
(3) a Net (reflected sunlight plus emitted infrared) effect of 0.55 Watts per sq. meter loss in radiant energy by the global climate system.
That is pretty powerful support for the Svensmark Theory.
Perhaps if Dr Spencer would re-examine this issue, he might be more convinced. Here are a few observations.
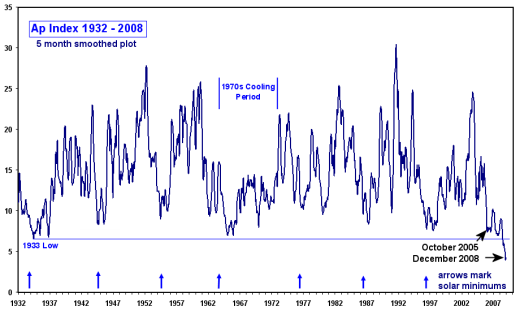
The chart below is the Solar Cycle Ap Progression. Ap is a proxy of the Sun’s activity.
Note how much lower the Ap index for Cycle 24 is compared to Cycle 23.
The following chart plots the Ap index for a longer period.
Now lets look at the neutron monitors that measure the cosmic rays that bombard Earth. This chart is a product of the North-West University in the Republic of South Africa.
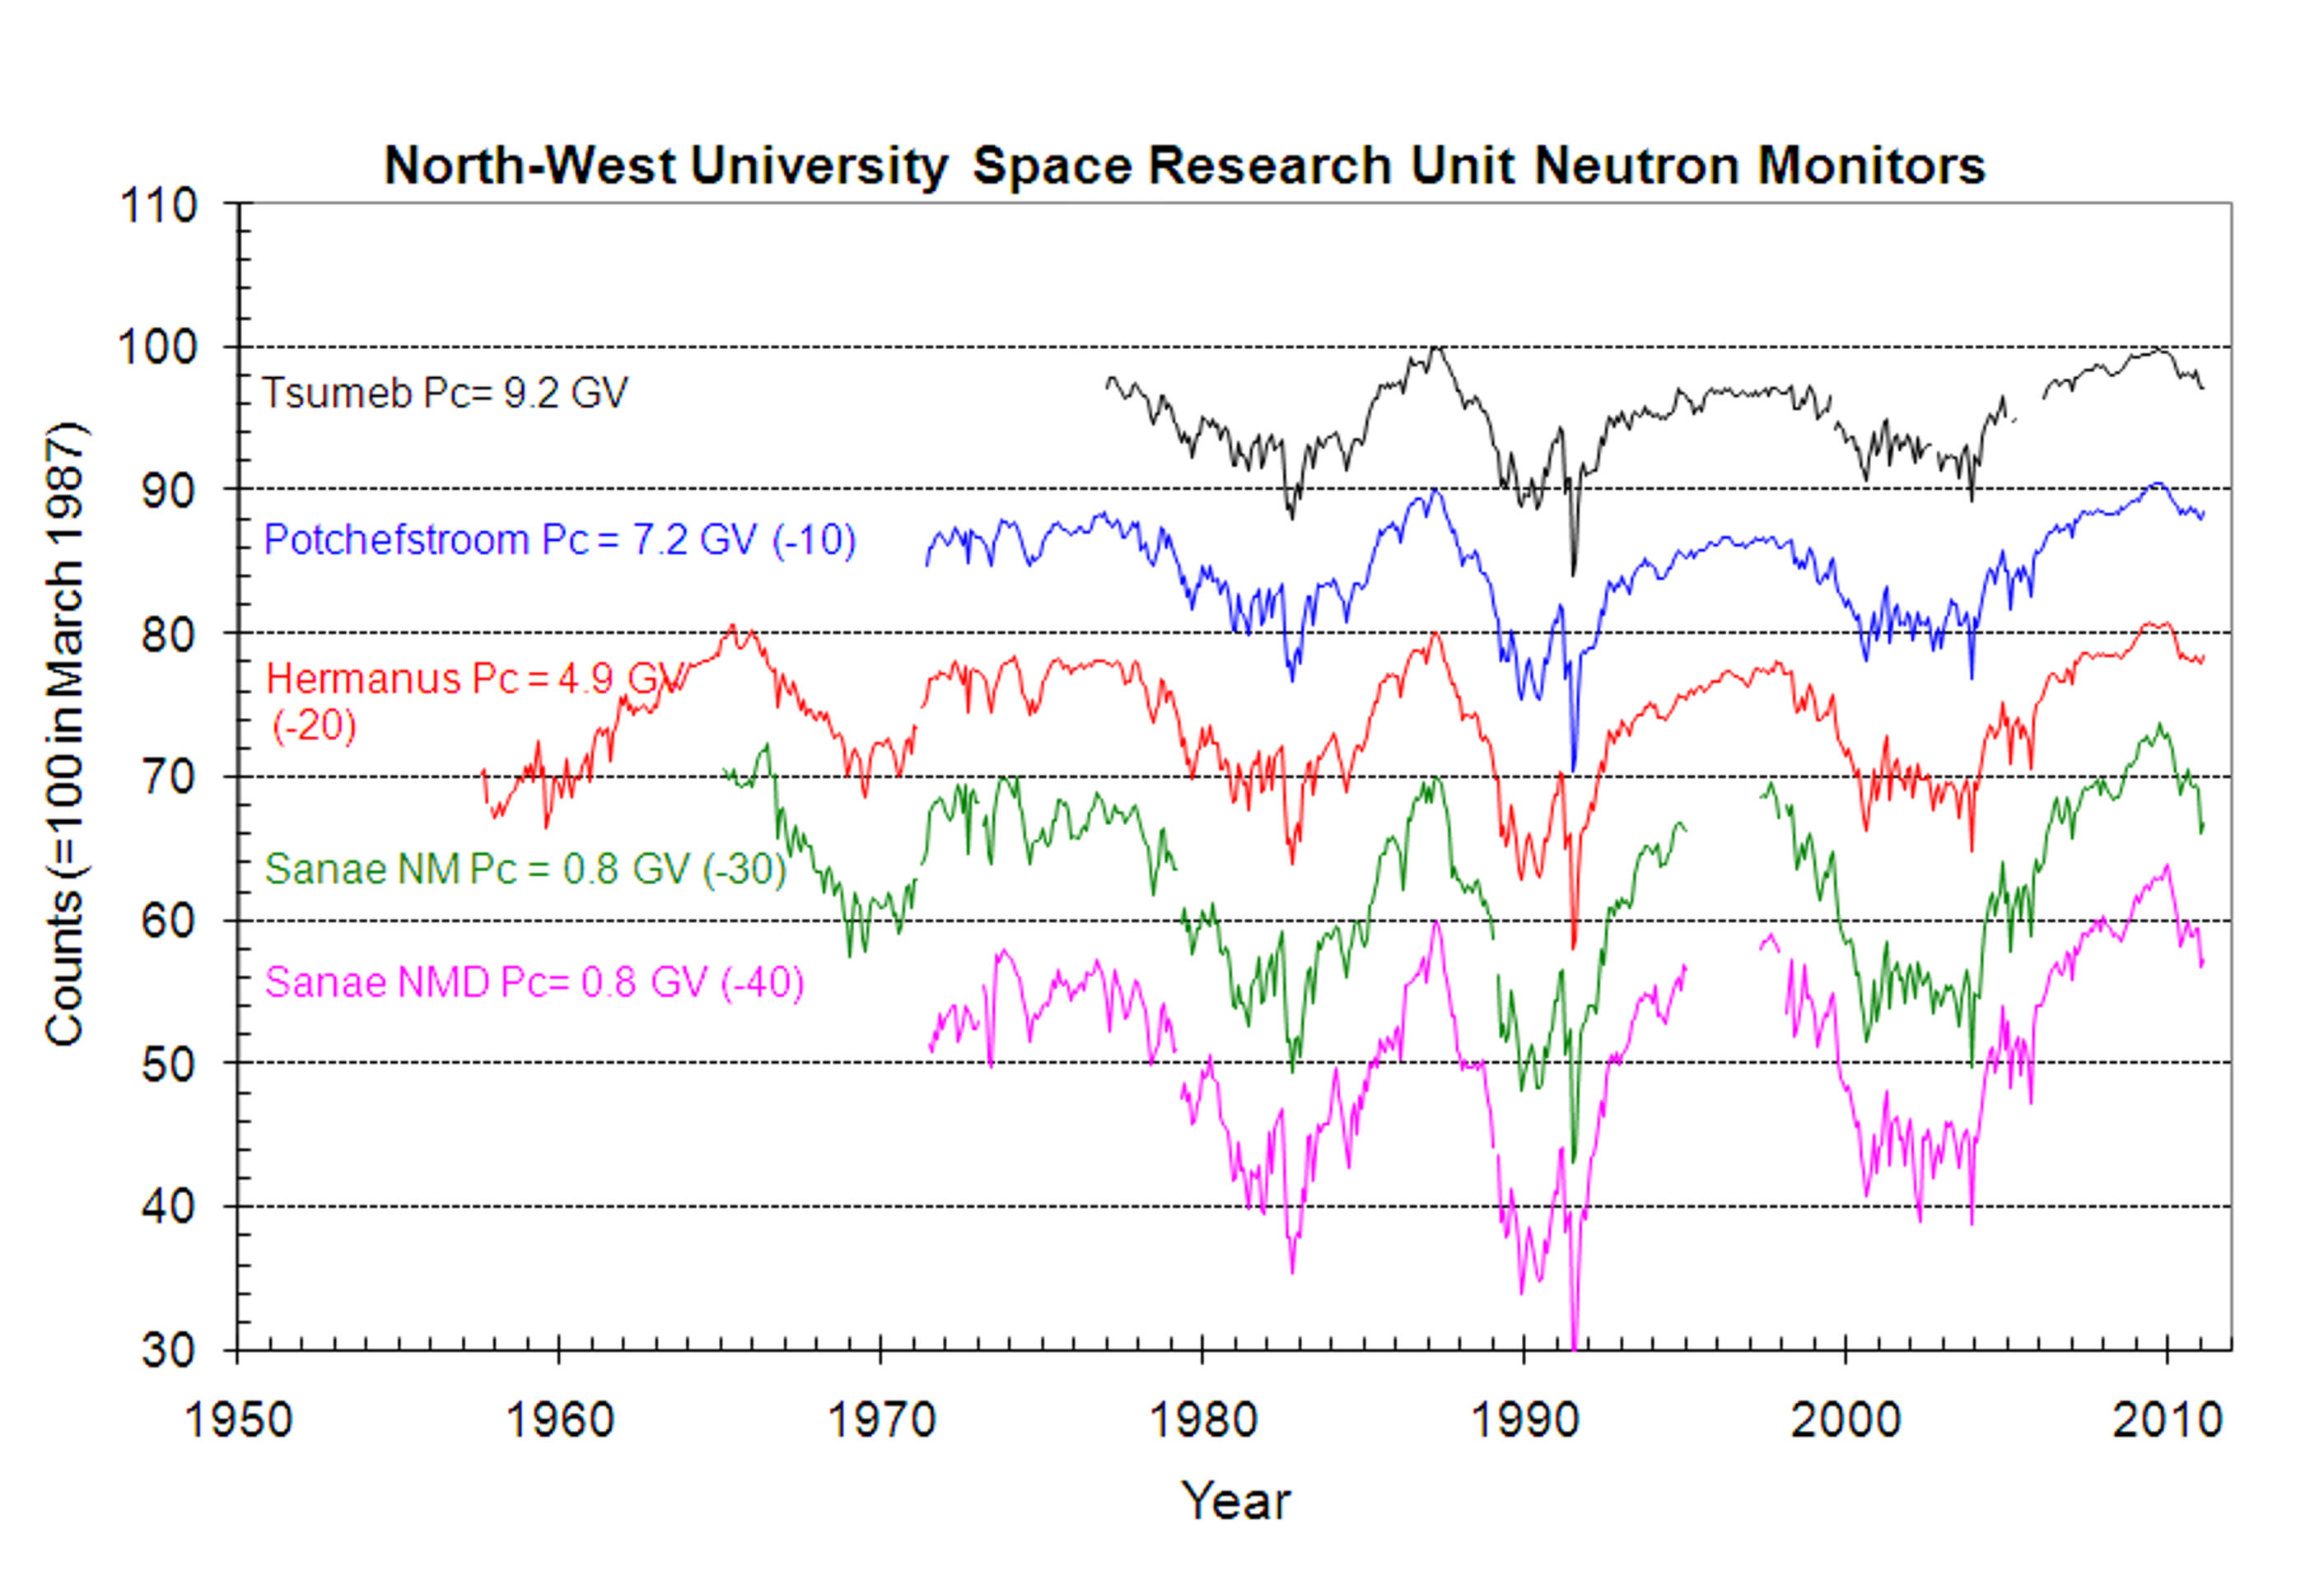
It is apparent that the neutron counts and solar active are in sync but of opposite signs.
There is a small reduction in count recently as the Sun’s activity has increased as it approaches a maximum. However, it is a reasonable to predict that the count will not go as low as it did in the previous, more active Solar Cycles.
Dr Spencer and others caution that there maybe a lag in the response of temperature and the Sun’s activity. We will have to wait and see of course.
Additional information on Ap index can be found by clicking here.
cbdakota
