Category Archives: Sunspots

Predicting Solar Cycle 25. Are We Heading For Another Maunder Minimum?


A study was published in 2012, Sudden transitions and grand variations in the solar dynamo, past and future” by Cornelis DeJager and Silvia Duhan . The authors attempt to predict whether Solar Cycle 25 will transition to a “Grand Minimum” or “Regular “ Episode. They believe the Sun is transitioning from a “Grand Maximum” to one or the other aforementioned Episodes. This study is being used because their prediction was based upon knowing the Solar Cycle 24’s maximum Sunspot number which we now have.

First a look at the “Episodes” that the authors have placed the Solar Cycles from 1620 to the present.

grandcyclesswsc120009-fig4
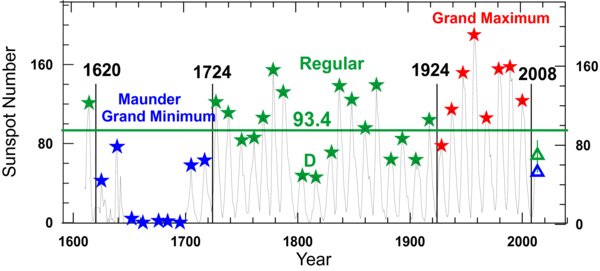
The diagram shows the sunspot numbers plotted against time. The three Grand Episodes are marked by their different colors. They are separated by vertical black lines.

Continue reading

Solar Cycle 24 January 2015 Update


Solar Cycle 24 surprised everyone with a second peak.   Now the maximum appears to have occurred, as mentioned in last months posting. The Cycle is still active and will continue to be for years to come; however, the monthly average of Sunspot numbers are in decline.  The Solen Info Chart  “Solar Cycle 24 Progress is shown below.  The South Polar Field (Rsouth) has been the source of most of the Sunspots since mid-year 2012.   Its  activity is declining. Solen Info projects that the smoothed International Sunspot number will continue its down-tend. As a reminder,  the smoothed number is a 12 month average six months behind the most recent reading.   The number (Ri smoothed) that Solen forecasts for January 2015 is 66.5.

SS#Jan15solarcycle24progress

Continue reading

Solar Cycle 24: 2014 Review


ancientsun6289386788_3f700efdbc_zSolar Cycle 24 maximum occurred in February of this year when the International sunspot number peaked at 102. An earlier  maximum call was made in late 2011 when the sunspot number reached about 96.  That was followed by several months of declining sunspot counts, then activity picked up and a “double peak” resulted. The smoothed¹ number for the peak is 82 (versus the actual monthly value of 102). December 2014 sunspot number was 78. So the smoothed number for December has not yet been calculated, but it is estimated that it will be about 68.

Continue reading

Cycle 24-November ’14—Sunspot Number Trend


Cycle 24 solar activity looked liked it had peaked somewhere around March of 2011 at about 68. But it hadn’t.   The smoothed International Sunspot (SS) number is currently around 82 around as shown by the dashed blue line on this chart:

cycle24-2More detail can be seen on the following chart where the activity in November is up from October. Both SS and solar flux (F10.7 cm) peaked at about 170 in November.

sssolarterestialnov2014

Solar Cycle 24 is still much less active than Solar Cycle 23 as can be seen in the chart below:

sunspotscycles23_24 nov14

The green line is the predicted path of the smoothed International SS number.  This time the turn down in solar activity  may actually be the “maximum” for Solar Cycle 24.

An El Nino is happening now. It should continue into next year. Early indications were that it would be very weak, but it has picked up some strength. This event is likely to have an effect and may even break the run of more than 18-year pause in global temperatures. Solar Cycle 24’s low solar activity might offset the El Nino with the “pause’ continuing. Nobody knows.

Probably the most comprehensive discussions of the what and where-fore of an El Nino are by Bob Tisdale postings. Clicking here will direct you to his postings.

cbdakota


Climate Cooling Predicted by New Solar Theory


Dr David Evans has proposed a new theory that he believes  demonstrates the link between the Sun’s total solar irradiance (TSI) and the Earth’s climate. The idea that TSI and the Earth’s Climate are linked is not a new or novel theory. Evan’s has built a computer program that provides a time delay between a change in TSI and the time that climate begins to respond. He believes the key to his program is the use of “notch filter” similar to those used in the communications industry to filter out “noise”.

He also is asking for peer review of this program via “crowd sourcing”.   Reading the comment sections of the sites where he has posted his theory and provided much of the coding, he certainly has been successful in getting comments.  At the time of my last survey,  the comments  he has received are mostly positive but some others are skeptical.

For this study, Evans derived a new transform that he calls the “optimal Fourier transform (OFT)” for this paper. This transform provides the “notch”.  One commenter suggested that the use of another type of Fourier transform would improve Evan’s program and appears that Evans agrees.   (I did take a course in Laplace Transforms, but not being an Electrical Engineer, I have forgotten what I learned. This comment is a way of letting the reader know that I am unable to intelligently comment on the math used in Evans’ program. )


WHY IT’S GOING TO COOL

“The reason for the cooling is the dramatic fall in solar radiation that started around 2004. Here is a graph of solar radiation since 1610, when sunspots were first recorded. The brown line is the solar radiation, and it peaks every 11 years or so because of the sunspot cycle. We put an 11-year smoother through it to give us the red line, which shows the trends in solar radiation.”    (Click on charts for improved clarity.)

EVANStotal-solar-irradiance-1.1

Figure 1

Evans says there have been three steep falls in TSI in the last 400 years and each of these falls have been accompanied by major global cooling.

That the global temperature has fallen in sync with the drop off of TSI appears to be an awfully good correlation. But many skeptics as well as warmers argue that it must have been for some other reason other than TSI because (look at the vertical axis) the total change in TSI is too little to be of consequence.

This blog has always proposed that the Sun is the major forcing agent in global climate. Perhaps the causation is not the TSI, but I continue to believe the something correlated to the Sun’s activity is the causation. Having said that, time to move back to Evans’ theory.

Continue reading

Early look at Solar Cycle 24 July Activity


Since late last year, Solar Cycle 24 has picked up activity as it goes through a double peak maximum.   I doubt that is an official term but it does describe what has been going on. It was generally though that the peak International Smoothed Sunspot number for Cycle 24 was going to be about 66.   But the recent activity will result in a smoothed peak number of 81 or there about.  (Click on charts for clarity.)

solensolarterrestialjuly26-14

This chart of approximately the last 12 months, shows that F-10.7cm solar flux and Sunspot numbers are closely aligned, both being good proxies for solar activity.

Continue reading

IS SOLAR CYCLE 24 GOING ROUGE?


What is going on with Solar Cycle 24?   It began with a whisper and until rougeSun threerecently,  it continued that way. It peaked at international sunspot number(ISN) of 66.9 in February 2012 and many thought that would be the high for Solar Cycle 24. But wait, a second peak formed and the question is, when will it stop growing?   Best guesses say that the peak will be somewhere around 80 (ISN). NASA says: “Many cycles are double peaked but this is the first in which the second peak in sunspot number was larger than the first.”

Continue reading

Solar Cycle24 Mid-November Update


Solar Cycle 24 at November mid-month still is showing relatively high activity. The Sunspots are up and the F10.7cm solar flux is as well.  The Solen Chart below was updated on 15 November.  (Click on Chart to enlarge.)

sunspotsmidnov13solarThe green line is not the official smoothed 6 month lagging number that is used to describe the Cycles.  But it currently is showing that the increase in solar activity in the month of October is still underway in November.  Even so, this activity is well below its recent predecessors.

cbdakota

Solar Cycle 24 October Update


The 30 day smoothed International Sunspot number for October 2013 was 78.9.  The Sun was more active as indicated by Sunspots and F10.7cm radio flux in October than any time since the middle of July this year.  The chart, by Solen, below shows this activity. (Click on chart to enlarge.)

sunspotoct13solar

The chart shows that the NOAA Sunspot number and the F10.7 cm flux are trending downward at month-end, indicating the likelihood that the 30-day smoothed Sunspot number will begin dropping.  A bit of prospective is that while the October solar activity was up, Cycle 24 is still much having much lower activity relative to the 3 preceding Solar Cycles.

cbdakota

Solar Cycle 24 October Sunspot Number Rising


It was beginning to look like the Sunspots were in freefall based on last month’s 30 day smoothed number of 36.9.  But the Sun continues to let us know that we don’t know a lot about it for certain.   It looks like the Cycle 24 Sunspot number may reach 70 for the month of October.  A jump in Sunspot activity began in second week of this month and has continued through the third week.  It will be interesting to see how high it will go.  This number is not the official smoothed 6 month lagging number* that will not move up a lot, unless this higher activity continues for several months.  See the Chart below that shows, in Green, the smoothed 30 day number at the last updating on 25 October 2013.   It is nearly 70 at this time. (Click on chart to enlarge.)

sunspotdatamidoct13

This chart is from http://www.solen.info/solar/.  This is an excellent site for monitoring solar data.

*The smoothed number is calculated by doing a 13 month average from the numbers that lag 6 months behind the current month.

cbdakota