
 Solar Cycle 24 maximum occurred in February of this year when the International sunspot number peaked at 102. An earlier maximum call was made in late 2011 when the sunspot number reached about 96. That was followed by several months of declining sunspot counts, then activity picked up and a “double peak” resulted. The smoothed¹ number for the peak is 82 (versus the actual monthly value of 102). December 2014 sunspot number was 78. So the smoothed number for December has not yet been calculated, but it is estimated that it will be about 68.
The following chart shows “raw” and the “smoothed” sunspot numbers.
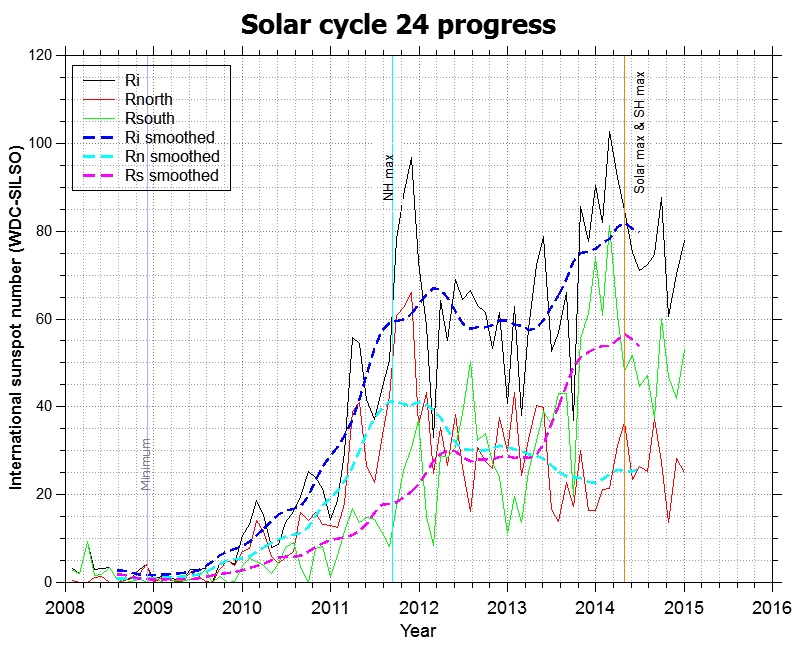 Chart courtesy of Solen.info
The chart also shows the southern and northern polar fields that are producing the sunspots. The southern polar field has been much stronger recently and has produced most of the 2014 sunspots. Below are two charts showing the polar field strength versus time.
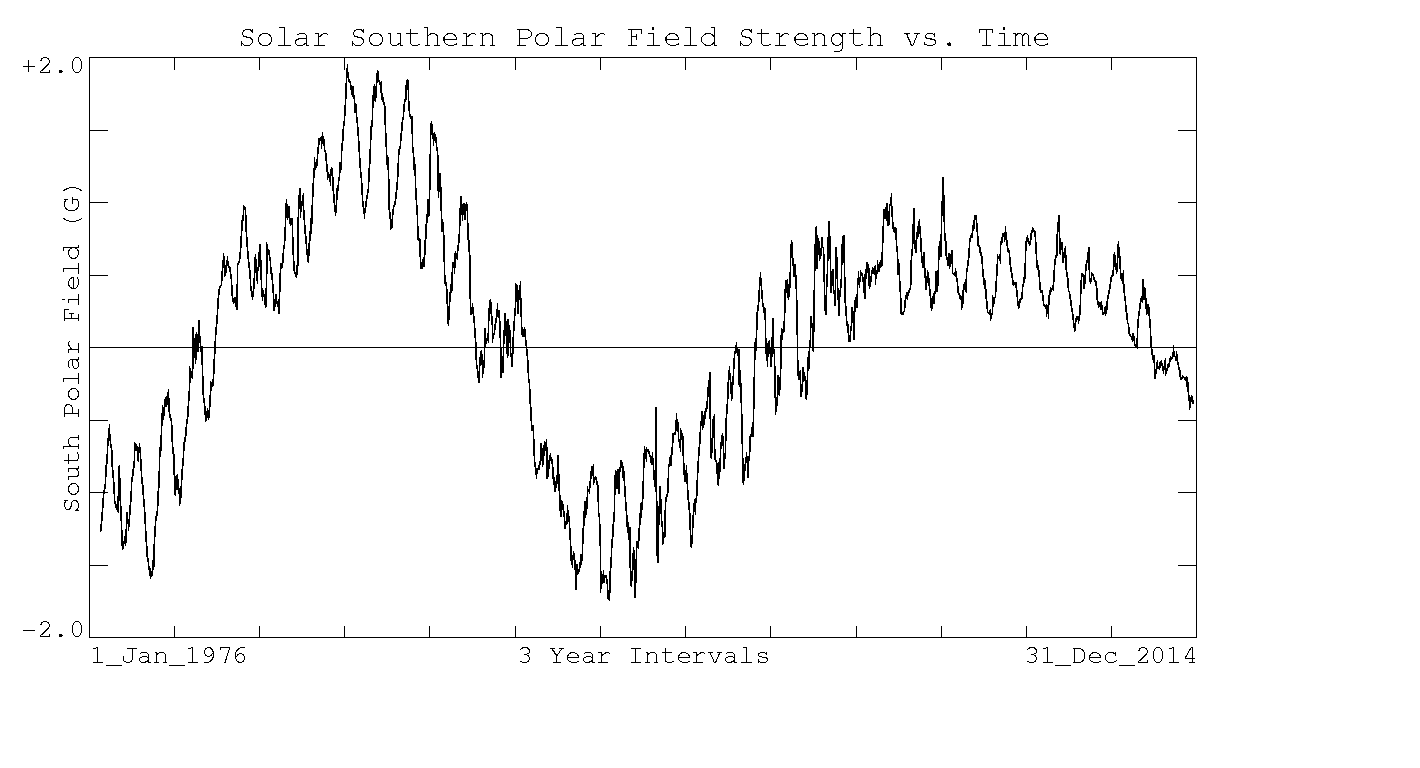
 Charts courtesy of Wilson solar Observatory
The smoothed International sunspot projection for the next 6 months is shown in green on the following chart which also provides a comparison of Solar Cycle 23 and 24. The second Solar Cycle 24 peak in sunspots, it is still much smaller than Solar Cycle 23.
 Chart Courtesy of Sola.info
How does 24 compare previous low activity Solar Cycles? The chart below compares 24 versus Solar Cycles 10, 12, 13, 14, and 16.
 Chart courtesy of Solen.info
When Solar Cycle 24 began, it looked like it might be least active in more than a hundred years. Even so, it probably will be less active than Solar Cycles 10 and 13.
It appears that the experts are holding on to the notion that Cycle 25 will be another low activity Solar Cycle, and probably less active than 24.
| Cycle | Peak SS# | Cycle History- | ||
| Began | Ended | Duration-Months | ||
| 10 | 98 | 3/1855 | 2/1867 | 136 |
| 12 | 75 | 12/1878 | 3/1890 | 136 |
| 13 | 88 | 3/1890 | 2/1902 | 143 |
| 14 | 65 | 2/1902 | 8/1913 | 128 |
| 15 | 105 | 8/1913 | 8/1923 | 120 |
| 16 | 78 | 8/1923 | 9/1933 | 121 |
| 17 | 120 | 9/1933 | 2/1944 | 125 |
| 18 | 152 | 2/1944 | 4/1954 | 122 |
| 19 | 202 | 4/1954 | 10/1976 | 126 |
| 20 | 110 | 10/1976 | 6/1976 | 140 |
| 21 | 165 | 6/1976 | 9/1986 | 123 |
| 22 | 158 | 9/1986 | 6/1996 | 117 |
| 23 | 121 | 6/1966 | 12/2008 | 149 |
| 24 | 82 | 12/2008 | ? | ? |
My take on this is that, in recent times, the Solar Cycles beginning with 18 through 22 were more active that the Cycles before or since. That would suggest that the rise in global temperatures during that period were probably a function of that activity rather than from CO2 accumulating in the atmosphere. However, if I am reading Lief Svalgaard correctly, he maintains there is no correlation between sunspots and global temperatures. But I am stubbornly sticking to my simple-minded engineer approach which says, the Sun is doing it, but perhaps we have not found the specific cause yet.
cbdakota
¹The smoothed sunspot number is the one used to plot the activity of a cycle. The smoothed monthly number results from an averaging of monthly mean values over the 13 months, from 6 months before to 6 months after a base month. The last smoothed number thus always lags by 6 month behind the latest monthly mean sunspot number. I used the term “raw” to denote the unsmoothed number.

The generally accepted sunspot maximum for any solar cycle is defined as the highest monthly smoothed International Sunspot Number. It’s maintained by the Royal Belgium Observatory (the current official record keeper of the 400-year sunspot record)
It’s correct that the highest monthly averaged sunspot number was 102.8 in February 2014.
However, the accepted solar maximum for Cycle 24 is the “smoothed count” of 81.8 that occurred in April of 2014.
The smoothed count is a 13-month averaged sunspot count using this Belgium’s formula:
Rs= (0.5 Rm-6 + Rm-5 + Rm-4 + Rm-3 + Rm-2 + Rm-1 + Rm + Rm+1 + Rm+2 + Rm+3 + Rm+4 + Rm+5 + 0.5 Rm+6 ) / 12
Rs = smoothed monthly sunspot count
Rm = One month’s actual sunspot count
The “-6” through “+6” appended to each Rm is the number of months before or after the month whose smoothed count is being calculated. The beginning and ending months in the formula are only given half the value of the others.
Not everyone is in total agreement that this is the way smoothed tallies and solar maximum should be determined, but it’s officially accepted by the scientific community.
Thanks Perhaps my nominal 82 for the peak was not exactly right. And yes you are right. months minus 6 and plus 6 are given only 1/2 value.
cbdakota