Category Archives: fossil fuels

James Hansen Misfires Again.


Robert Bradley Jr  has made a posting on the MasterResource web site and I am reposting it in its entirety.    Bradley takes on James Hansen,  the so-called  god father of man-made global warming as well as Hansen’s  neophytes.  Hansen has long believed he knows everything there is to know about this issue.  He doesn’t of course and Bradley begins the posting with one of Hansen’s many bad predictions.   It is a good read.

cbdakota

James Hansen: Time to Go CO2 Negative!

By Robert Bradley Jr. — October 5, 2016

“We have at most ten years—not ten years to decide upon action, but ten years to alter fundamentally the trajectory of global greenhouse emissions.”

– James Hansen, “The Threat to the Planet.” The New York Times Review of Books (2006).

“Contrary to the impression favored by governments, the corner has not been turned toward declining emissions and GHG amounts…. Negative CO2 emissions, i. e., extraction of CO2 from the air, is now required.”

– James Hansen, “Young People’s Burden.” October 4, 2016.

Ten years ago, James Hansen predicted doom if mankind did not “fundamentally” reduce global greenhouse gas emissions in ten years. This ultimatum to the world came due this summer.


But far from raising the white flag, the father of the modern climate alarm now demands via legal action that CO2 and other GHG emissions go negative “if climate is to be stabilized on the century time scale, as a result of past failure to reduce emissions.”

He continues: “If rapid phasedown of fossil fuel emissions begins soon, most of the necessary CO2 can take place via improved agricultural and forestry practices, including reforestation and steps to improve soil fertility and increase its carbon content.”

And:

‘All deliberate speed’ will be a dominant issue for climate.  Our governments have not accepted the reality dictated by the laws of physics and climate science: we must phase out fossil fuel emissions rapidly. Mother Nature will not wait for bumbling half-baked government schemes for reducing emissions. It will be essential that the Court not only demand all deliberate speed, but continually examine the reality of what the government is accomplishing, and that the government have both short-term and long-term plans of action.

Hansen states that a negative trajectory is possible. Don’t tell that to Americans or to the industrializing world. And don’t look to carbon capture and storage. Or politics.

The obvious question is: when will he throw in the towel and turn from government-directed mitigation to market-directed adaptation. Richer, freer societies adapt to change much better than command-and-control, CO2-rationed economies, after all.

Pretense of Knowledge

Dr. Hansen is dead certain that he understands the physics and economics of climate change to know the problem and the solution. He believes that climate models understand real climate, economic models understand real economies, and policymakers can implement ideals.

Hansen is the ultimate central planner, imaging not only that he has unique knowledge but that the real world will conform to his edicts. In short, Hansen is possessed by a fatal conceit.

It begins with computer models, which have over-predicted real world warming. “We do not know much about modeling climate,” climate scientist Gerald North of Texas A&M University once explained to me. “It is as though we are modeling a human being. Models are in position at last to tell us the creature has two arms and two legs, but we are being asked to cure cancer.” On another occasion, he added: “The problem is difficult, and there are pitifully few ways to test climate models.”

“Computer models just weren’t reliable,” James Lovelock recently stated in reference to his about-face on climate catastrophism. “I’m not sure the whole thing isn’t crazy, this climate change.” Which brings up the futile crusade of James Hansen, which is allowing a speculative, unsolvable problem to divert real resources from here-and-now human needs.

Continue reading

Pew Research Report Data Not Supported By The Interviews. Human Caused CO2 Claimed To Be 48% But In Reality Is 31%


Pew Research Center has just released a survey of American’s opinions about global warming. They interviewed about 1500 people over a period from 10 May to 6 June this year. There are many findings but the one I want to take issue with is their claim that about half of the American’s interviewed say Earth is warming due to human activity. From the Pew Research Center survey the chart displayed says that 48% believe Earth is warming because of human activity, 31% because of natural patterns and 20% say there is no solid evidence that Earth is getting warmer.

2016-10-05-3

The Pew document presents the results of the interviews. The above conclusion was made from the following interviews:

2016-10-05


Above is the first interview results. Only 26% said global warming is caused by human activity. Wow that would not do. I guess they were saying “how can we fix this. We can’t publish this.” So they came up with a plan.

Some of the interviewed said they were not sure or had no answer. So they decided to re-interview these people to see which of the three statements would be their second choice. Now there were 1534 interviewees in the beginning. Thus the “not sures” and the “no answers” would be 0.15X1534=230 people. In the next chart it appears that they only re-interviewed only 156 of the 230. Below are the results of the re-interview.

2016-10-05-1

The results of the re-interview is that 29% said their second choice would be human caused warming, 20% said the warming was natural and 41% there was no evidence that the world is getting warmer.

Now comes the magic. You can see it in the bottom part of the above chart where it says the “combined responses” gave a new set of percentages for each of the three possible answers. However the answer for one of the three changed. It now includes both human caused and natural caused warming even though there still is a natural caused warming category.

I have gone through the math. The “human caused” in the first interview was 26% or 398 people. The “natural” was 45% or 690 people. “No evidence” was 14% or 215 people. As noted above the number re interviewed was 156 although the percentage would have called for 230. Note also that the percentage listed in the chart is only 90% or 140 people. The bottom line for people actually giving an opinion looks to be 1443 rather than the 1534 they began with. But the discrepancies in total number make little difference to the outcome. The human caused would be 398 original people plus 45 of the re interviewed for a total of 443 representing the share of the total 31%. Natural 690 plus 31 for a total of 721 and 50%. No evidence came in with 215 plus 64 for 279 and 19%. So only 31% said warming was human caused.

Obviously the surveyors could not let the initial result stand—–only 26% thought warming in human caused. So they came up with a way to obscure the results.

I have plowed through the rest of the interview material. It is obvious that most of the people have little concept of the issues surrounding renewable fuels/renewable energy.

2016-10-05-6

Their level of the science knowledge is probably pretty well summed up by the interview question shown above where they were asked to name the major gas that makes up our atmosphere. Seventy-three per cent did not know the answer. I would hazard a guess that most of our politician would do no better on that question.

If you want to look in detail at the full report and the interviews click here and then click on “Complete Report PDf

cbdakota

Sales Of EV’s Are Not Impressive.


cartoonevforseptblogSales of electric vehicles (EV) jumped in the second quarter of this year. This was enough to convince Real Clear Energy to post “Surge in EV Sales Bucks Cheap Gasoline, Broader Auto Industry Trends”. The posting says that while President Obama’s goal of 1 million EV’s on US roads by 2015 was not met, it was only about half that number in 2015, the surge “gives reason for fresh optimism about the future…..” EV Sales in the first half of 2015 were 70,296 versus 2016 first half sales of 99,634—a 42% change. That looks pretty impressive in the abstract.

However,  EV sales need to be evaluated versus all US automobile sales

Detailed Data for sales in August are readily available but June 2016 detailed data are behind a pay wall.  In reality the exact numbers are not significantly going to change the fact that EV sales were about 1..2% of total sales.  YCharts forecast annual sales based upon  auto sales by using the current month’s actual sales.  In June , half of the year, the Y chart number for total sales was 17.09 million automobiles.  This number counts cars and light truck and it includes EV sales in this number.  The 2016 auto sales  for the year based upon August July sales was18.15 million. Because the biggest sales months are in the fall of the year,  the official forecast for 2016 sales is 18.75 million.

Anyway,  if the annual forecast at the end of June was 17.09  roughly the year to date sales for the first six months sales would have been about 8.5 million.

The math:        0.1 million EVsales /8.5 million total sales = 1.2% of the total sales were EVs.

Real Clear Energy really has to be reaching to say that this gives them “fresh optimism.”

A hat tip to David Middleton for this story line based upon his posting in WUWT titled “Green math must be a Common Core product“.  I have modified it because I believe his calculation was erroneous. He arrived at number of 0.6% rather than what I believe is the correct number. Middleton’s conclusion however  is unchanged by my calculation of 1.2%.

cbdakota


Make The Climate Change Radicals Walk The Walk, Not Just Talk The Talk


Glenn Reynolds, a Tennessee University Law Professor posted in USAToday, where he frequently contributes opinion columns, “ Ban AC for DC “ with the subtitle being “If our rulers think global warming is a crisis, let them be a good example for the rest of us”

goreandhairdryer


Reynolds says:

“In this, I’m inspired by Rep. Lamar Smith, R-Tex., who noticed something peculiar recently. It seems that EPA Administrator Gina McCarthy, who spends a lot of time telling Americans that they need to drive less, fly less, and in general reduce their consumption of fossil fuels, also flies home to see her family in Boston “almost every weekend“; the head of the Clean Air Division, Janet McCabe, does the same, but she heads to Indianapolis. In air mileage alone, the Daily Caller News Foundation estimates that McCarthy surpasses the carbon footprint of an ordinary American.

Smith has introduced a bill that wouldn’t target the EPA honchos’ personal travel, though: It provides, simply, that “None of the funds made available by this Act may be used to pay the cost of any officer or employee of the Environmental Protection Agency for official travel by airplane.”

This makes sense to me. We’re constantly told by the administration that “climate change” is a bigger threat than terrorism.  And as even President Obama has noted, there’s a great power in setting an example: “We can’t drive our SUVs and eat as much as we want and keep our homes on 72 degrees at all times … and then just expect that other countries are going to say OK.”

Reynolds thinks expanding Representative Smith’s proposed legislation would useful as he notes in the following:

  1. Extend Smith’s bill to cover the entire federal government. We have Skype now, and Facetime. There’s no reason to fly to meetings. I’d let the President keep Air Force One for official travel, but subject to a requirement that absolutely no campaign activity or fundraisers take place on any trips in which the president travels officially.
  2. Obama makes a great point about setting the thermostat at 72 degrees. We should ban air conditioning in federal buildings. We won two world wars without air conditioning our federal employees. Nothing in their performance over the last 50 or 60 years suggests that A/C has improved things. Besides, The Washington Post informs us that A/C is sexist, and that Europeans think it’s stupid.
  3. In fact, we should probably ban air conditioning in the entire District of Columbia, to ensure that members of Congress, etc. won’t congregate in lobbyists’ air-conditioned offices.
  4. Speaking of which, members of Congress shouldn’t be allowed to fly home on the weekends. Not only does this produce halfhearted attention to their jobs — the so-called “Tuesday to Thursday Club” — but, again, it produces too much of a carbon footprint. Even if they pay for the travel out of campaign funds, instead of their own budgets, they need to set an example for the rest of us — and for those skeptical foreigners that Obama mentioned.

Reynolds takes a swipe at Leonardo DiCapprio as well. And what about Michelle Obama’s vacations!!!

The full posting is a good read, ( somewhat tongue-in-cheek in some parts.)

Do you think the warmers really believe in this catastrophic global warming stuff? Does not look like it. I think it demonstrates that they are using this to increase the size of the government through regulations (and thus their power.) That was the motivation of the founders of this movement.

cbdakota

UK Scientist Doubts Decarbonization by 2050 Is Possible. Thinks Other Unfunded Threats Are More Compelling.


M J Kelly, Electrical Engineering Division Department of Engineering, Universtiy of Cambridge has written “Lessons from Technology Development for Energy and Sustainability” and posted on the  Cambridge Journals on Line.

The following is the Abstract from his posting where he sets up the quandary that faces the organizations wishing to decarbonize the planet by 2050.

There are lessons from recent history of technology introductions which should not be forgotten when considering alternative energy technologies for carbon dioxide emission reductions.

The growth of the ecological footprint of a human population about to increase from 7B now to 9B in 2050 raises serious concerns about how to live both more efficiently and with less permanent impacts on the finite world. One present focus is the future of our climate, where the level of concern has prompted actions across the world in mitigation of the emissions of CO2. An examination of successful and failed introductions of technology over the last 200 years generates several lessons that should be kept in mind as we proceed to 80% decarbonize the world economy by 2050. I will argue that all the actions taken together until now to reduce our emissions of carbon dioxide will not achieve a serious reduction, and in some cases, they will actually make matters worse. In practice, the scale and the different specific engineering challenges of the decarbonization project are without precedent in human history. This means that any new technology introductions need to be able to meet the huge implied capabilities. An altogether more sophisticated public debate is urgently needed on appropriate actions that (i) considers the full range of threats to humanity, and (ii) weighs more carefully both the upsides and downsides of taking any action, and of not taking that action.


M J Kelly discusses this issue at length in his posting and I suggest you read it in its entirety . This posting will look at conclusions and some suggestions Kelly derives when he examined the current  programs to reduce CO2. He’s not optimistic that decarbonization has much of a chance of accomplishing what the greens want. In fact he thinks the money could be spend better on addressing more immediate threats than those posed by the so-call catastrophic global warming. Here he summarizes his thoughts:

It is surely time to review the current direction of the decarbonization project which can be assumed to start in about 1990, the reference point from which carbon dioxide emission reductions are measured. No serious inroads have been made into the lion’s share of energy that is fossil fuel based. Some moves represent total madness. The closure of all but one of the aluminium smelters that used gas-fired electricity in the UK (because of rising electricity costs from the green tariffs that are over and above any global background fossil fuel energy costs) reduces our nation’s carbon dioxide emissions. 62 However, the aluminium is now imported from China where it is made with more primitive coal-based sources of energy, making the global problem of emissions worse! While the UK prides itself in reducing indigenous carbon dioxide emissions by 20% since 1990, the attribution of carbon emissions by end use shows a 20% increase over the same period.

Interestingly, he talks about the UK exporting manufacturing to other nations in order to reduce CO2 emissions.  Then the goods from these nations come back to the UK made in less efficient factories and the attributed CO2 result in an increase in the UK net emissions.     

It is also clear that we must de-risk all energy infrastructure projects over the  next two decades. While the level of uncertainty remains high, the ‘insurance policy’ justification of urgent large-scale intervention is untenable, and we do not pay premiums if we would go bankrupt as a consequence. Certain things we do not insure against, such as a potential future mega-tsunami, 64 or a supervolcano, 65 or indeed a meteor strike, even though there have been over 20 of these since 2000 with the local power of the Hiroshima bomb! 66 Using a significant fraction of the global GDP to possibly capture the benefits of a possibly less troublesome future climate leaves more urgent actions not undertaken.

Two important points remain. The first is that there is no alternative to business as usual carrying on, with one caveat expressed in the following paragraph. Since energy use has a cost, it is normal business practice to minimize energy use, by increasing energy efficiency (see especially the recent improvement in automobile performance), 67 using less resource material and more effective recycling. These drivers have become more intense in recent years, but they were always there for a business trying to remain competitive.

The second is that, over the next two decades, the single place where the greatest impact on carbon dioxide emissions can be achieved is in the area of personal behaviour. Its potential dwarfs that of new technology interventions. Within the EU over the last 40 years there has been a notable change in public attitudes and behaviour in such diverse arenas as drinking and driving, smoking in public confined spaces, and driving without a seatbelt. If society’s attitude to the profligate consumption of any materials and resources including any forms of fuel and electricity was to regard this as deeply antisocial, it has been estimated we could live something like our present standard of living on half the energy consumption we use today in the developed world. 68 This would mean fewer miles travelled, fewer material possessions, shorter supply chains, and less use of the internet. While there is no public appetite to follow this path, the short term technology fix path is no panacea.

Over the last 200 years, fossil fuels have provided the route out of grinding poverty for many people in the world (but still less than half of all people) and Fig. 1 shows that this trend is certain to continue for at least the next 20 years based on the technologies of scale that are available today. A rapid decarbonization is simply impossible over the next 20 years unless the trend of a growing number who succeed to improve their lot is stalled by rich and middle class people downgrading their own standard of living. The current backlash against subsidies for renewable energy systems in the UK, EU and USA is a sign that all is not well with current renewable energy systems in meeting the aspirations of humanity.

Figure 1. (a) The 40% growth of global energy consumption since 1995 and the projected 40% growth until 2035, with most of the growth between 1995 and 2035 being provided by fossil fuels, 21and (b) the cause of this growth is the rise in the number of people living in the middle class as described in the text. 22


Finally, humanity is owed a serious investigation of how we have gone so far with the decarbonization project without a serious challenge in terms of engineering reality. Have the engineers been supine and lacking in courage to challenge the orthodoxy? Or have their warnings been too gentle and dismissed or not heard? Science and politicians can take too much comfort from undoubted engineering successes over the last 200 years. When the sums at stake are on the scale of 1–10% of the world’s GDP, this is a serious business.

cbdakota

*M.J. Kelly (2016). Lessons from technology development for energy and sustainability. MRS Energy & Sustainability, 3, E3 doi:10.1557/mre.2016.3.


Making It Criminal To Be A Skeptic—The First Amendment Is Under Siege


Senator Whitehouse (D-RI) is calling for RICO investigations of skeptics and fossil fuel companies. California legislators writing a bill allowing for the prosecution of climate change dissent—fortunately it died this past  Thursday. Seventeen  State Attorney Generals investigating Exxon. Calls to silence skeptical views are becoming more frequent. A number of major US newspapers are prohibiting discussion of Skeptical views.  This theme parallels the Social Justice Warriors efforts to impose their view of politically correct and thus allowable speech. The First Amendment to the Constitution is under siege by the media and the government itself. The Amendment was designed to prevent the Government from squashing dissenting views and is often considered the medias first line of defense from the government crackdowns such as are common in socialist, communist and dictatorial governments (e.g. Venezuela, China and Iran.)

From an earlier Climate Change Sanity blog:

”Climate science acts like it is fighting a holy war. There are only those who are just and those who must be silenced and stopped at all costs. Anyone who mounts reasonable logical, empirical, or skeptical challenges to the orthodoxy must be ruined, not by counterfactual evidence, but by vicious attack”.

Obviously the warmers are not winning the hearts and minds of free people. One reason for this is that the disinformation primarily comes from the warmers. The predictions of catastrophe are many and they have not come true. And you do not need to be a climate scientist to understand how the warmers continue to get it wrong. The mainstream media is complicit in the distribution of this disinformation.


Look at these postings where you can get some idea of how poor their predictions are:

CAGW Predictions –Zombie And Others

Quotes from the Founders Of the Global Warming Movement

More Green Predictions Are Way Off Base

5 IPCC Assessments Don’t Show Correlation Of Temperature and Severe Weather

How Reliable Are Climate Models?

And some stories of manipulation of Data to get the results they want

Can We Trust the EPA Secrete Science

Doctor Brown and Temperature Tampering

Research Papers Show IPCC Climate Sensitivity Are Too High

And Bjon Lomborg shows how just a fraction of the money wasted on these erroneous green studies could really make a difference in people’s lives:

Bjorn Lomborg Say Global Warming Poor Place to Spend Money

These are just a few of postings on Climate Change Sanity that show you need to be a skeptic.

And please contact you legislators and tell them to protect the public from those who want to take away our First Amendment rights.

cbdakota

Nuclear Energy Is The Energy Source Of The Future–So Why Is It Dying Now?


A posting by Michael Shellenberger, “Clean Energy is on the Decline — Here’s Why, and What We Can Do About It”  discusses the demise of nuclear power plants. He notes that while low natural gas prices have undercut the economics of nuclear plants, the real problem they face is the bias against nukes. He notes than many State regulations refuse to class nukes as “renewable” energy thus not getting subsidized as do solar and wind energy. These same state regulations require a mix of solar and wind generated energy be part of the mix sold by utilities but specifically do not include nuclear power as part of the required mix. Why he asks does nuclear, an energy source that emits no carbon dioxide (CO2), get excluded. And further, nukes are base-load plants. Meaning when put on-line they produce power whether the sun shines or the wind blows.  And an added benefit, nukes produce enormous amounts of power while occupying very little space.

Shellenberger says:

“Consider that in the U.S., utilities have either closed or announced premature closures of seven plants in three years. At least eight more are at risk of early closure in the next two years. In 2011, Germany announced it would close all of its nuclear plants. Swedish utility Vattenfall announced late last year that it would be forced to close several reactors prematurely.”

The irony of this, for example in Germany, is that the nukes are being replaced by brown coal fueled power plants. Brown coal is probably the biggest emitter of CO2 per KWh of any normal power source.

“Everywhere the underlying reason is the same: anti-nuclear forces, in tandem with rent-seeking economic interests, have captured government policies. On one extreme lies Germany, which decided to speed up the closure of its nuclear plants following Fukushima. In Sweden the government imposed a special tax on nuclear. In the U.S., solar and wind receive 140 and 17 times higher levels of subsidy than nuclear. And states across the nation have enacted Renewable Portfolio Standards, RPS, that mandate rising wind and solar, and that exclude nuclear.”

Continue reading

Denying The Climate Catastrophe: 5A Argument For Attributing Past Warming To Man (Warren Meyers Essay)


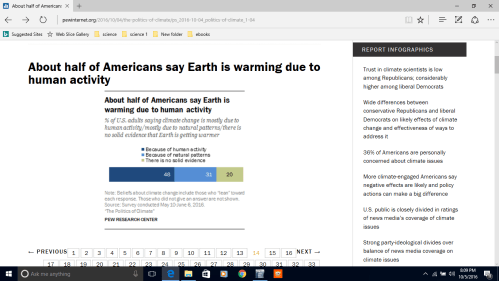
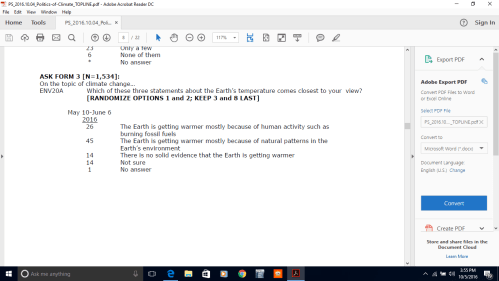
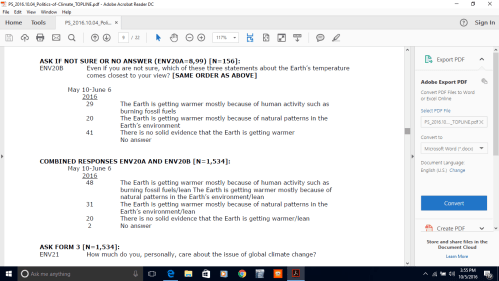
This posting is a continuation of  the Warren Meyers Essay debunking the Climate Catastrophe theory.   Here he takes the reader though the warmerist’s reasoning of why CO2 emitted from fossil fuels will result in a climate catastrophe.

cbdakota

Having established that the Earth has warmed over the past century or so (though with some dispute over how much), we turn to the more interesting — and certainly more difficult — question of finding causes for past warming.  Specifically, for the global warming debate, we would like to know how much of the warming was due to natural variations and how much was man-made.   Obviously this is hard to do, because no one has two thermometers that show the temperature with and without man’s influence.

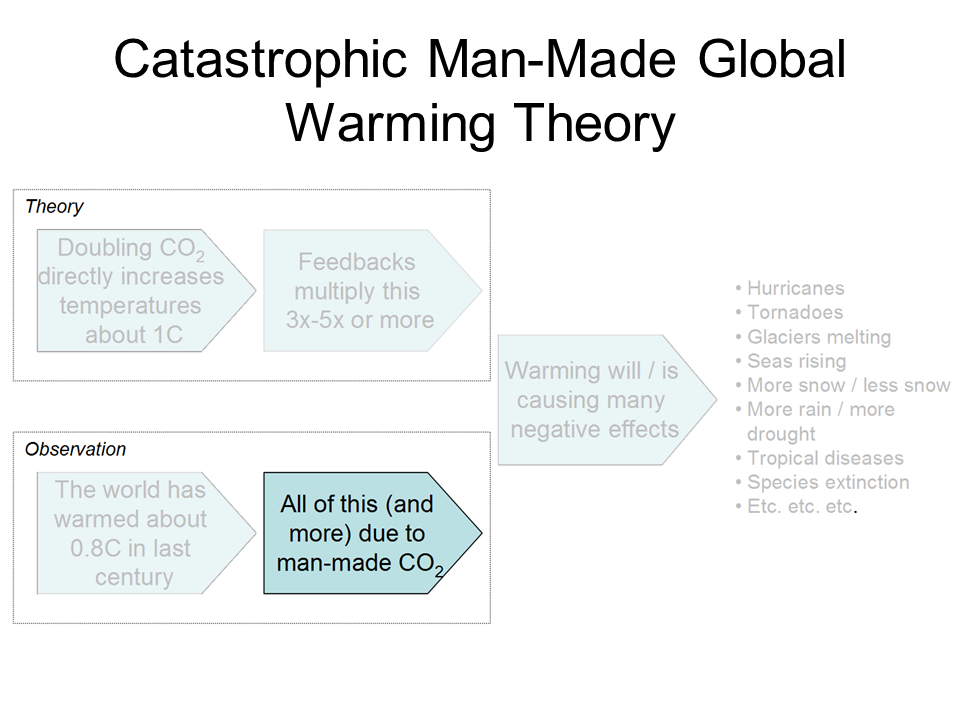
I like to begin each chapter with the IPCC’s official position, but this is a bit hard in this case because they use a lot of soft words rather than exact numbers.  They don’t say 0.5 of the 0.8C is due to man, or anything so specific.   They use phrases like “much of the warming” to describe man’s affect.  However, it is safe to say that most advocates of catastrophic man-made global warming theory will claim that most or all of the last century’s warming is due to man, and that is how we have put it in our framework below:


click to enlarge


By the way, the “and more” is not a typo — there are a number of folks who will argue that the world would have actually cooled without manmade CO2 and thus manmade CO2 has contributed more than the total measured warming.  This actually turns out to be an important argument, since the totality of past warming is not enough to be consistent with high sensitivity, high feedback warming forecasts.  But we will return to this in part C of this chapter

Past, Mostly Abandoned Arguments for Attribution to Man

There have been and still are many different approaches to the attributions problem.  In a moment, we will discuss the current preferred approach.  However, it is worth reviewing two other approaches that have mostly been abandoned but which had a lot of currency in the media for some time, in part because both were in Al Gore’s film An Inconvenient Truth.

Before we get into them, I want to take a step back and briefly discuss what is called paleo-climatology, which is essentially the study of past climate before the time when we had measurement instruments and systematic record-keeping for weather.   Because we don’t have direct measurements, say, of the temperature in the year 1352, scientists must look for some alternate measure, called a “proxy,”  that might be correlated with a certain climate variable and thus useful in estimating past climate metrics.   For example, one might look at the width of tree rings, and hypothesize that varying widths in different years might correlate to temperature or precipitation in those years.  Most proxies take advantage of such annual layering, as we have in tree rings.

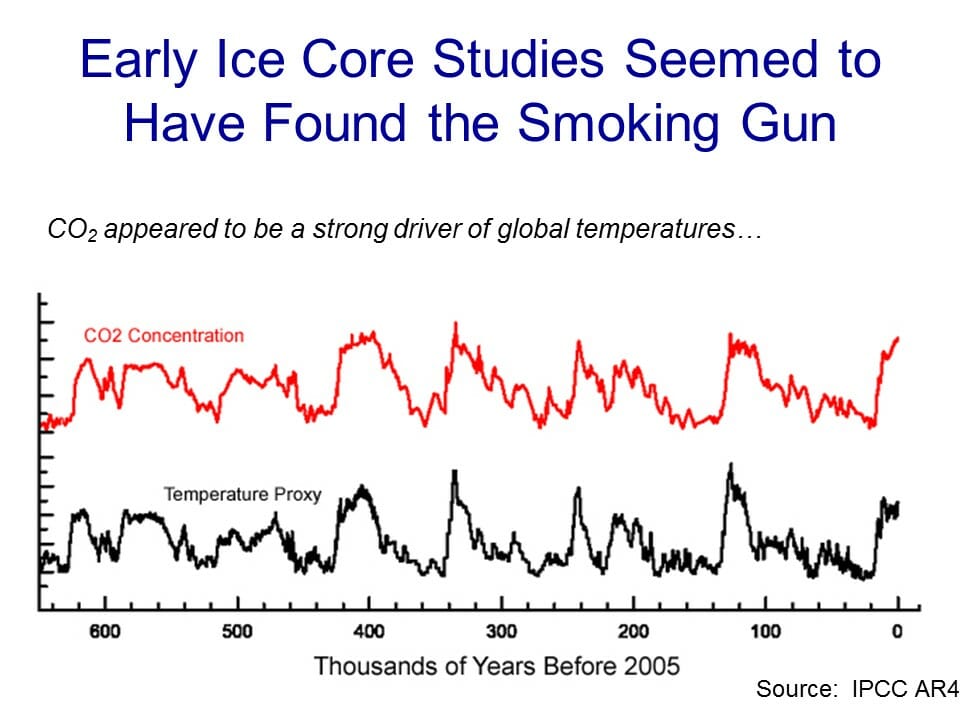
One such methodology uses ice cores.  Ice in certain places like Antarctica and Greenland is laid down in annual layers.  By taking a core sample, characteristics of the ice can be measured at different layers and matched to approximate years.  CO2 concentrations can actually be measured in air bubbles in the ice, and atmospheric temperatures at the time the ice was laid down can be estimated from certain oxygen isotope ratios in the ice.  The result is that one can plot a chart going back hundreds of thousands of years that estimates atmospheric CO2 and temperature.  Al Gore showed this chart in his movie, in a really cool presentation where the chart wrapped around three screens:

click to enlarge


As Gore points out, this looks to be a smoking gun for attribution of temperature changes to CO2.  From this chart, temperature and CO2 concentrations appear to be moving in lockstep.  From this, CO2 doesn’t seem to be a driver of temperatures, it seems to be THE driver, which is why Gore often called it the global thermostat.

But there turned out to be a problem, which is why this analysis no longer is treated as a smoking gun, at least for the attribution issue.  Over time, scientists got better at taking finer and finer cuts of the ice cores, and what they found is that when they looked on a tighter scale, the temperature was rising (in the black spikes of the chart) on average 800 years before the CO2 levels (in red) rose.

This obviously throws a monkey wrench in the causality argument.  Rising CO2 can hardly be the cause of rising temperatures if the CO2 levels are rising after temperatures.

It is now mostly thought that what this chart represents is the liberation of dissolved CO2 from oceans as temperatures rise.  Oceans have a lot of dissolved CO2, and as the oceans get hotter, they will give up some of this CO2 to the atmosphere.

The second outdated attribution analysis we will discuss is perhaps the most famous:  The Hockey Stick.  Based on a research paper by Michael Mann when he was still a grad student, it was made famous in Al Gore’s movie as well as numerous other press articles.  It became the poster child, for a few years, of the global warming movement.

So what is it?  Like the ice core chart, it is a proxy analysis attempting to reconstruct temperature history, in this case over the last 1000 years or so.  Mann originally used tree rings, though in later versions he has added other proxies, such as from organic matter laid down in sediment layers.

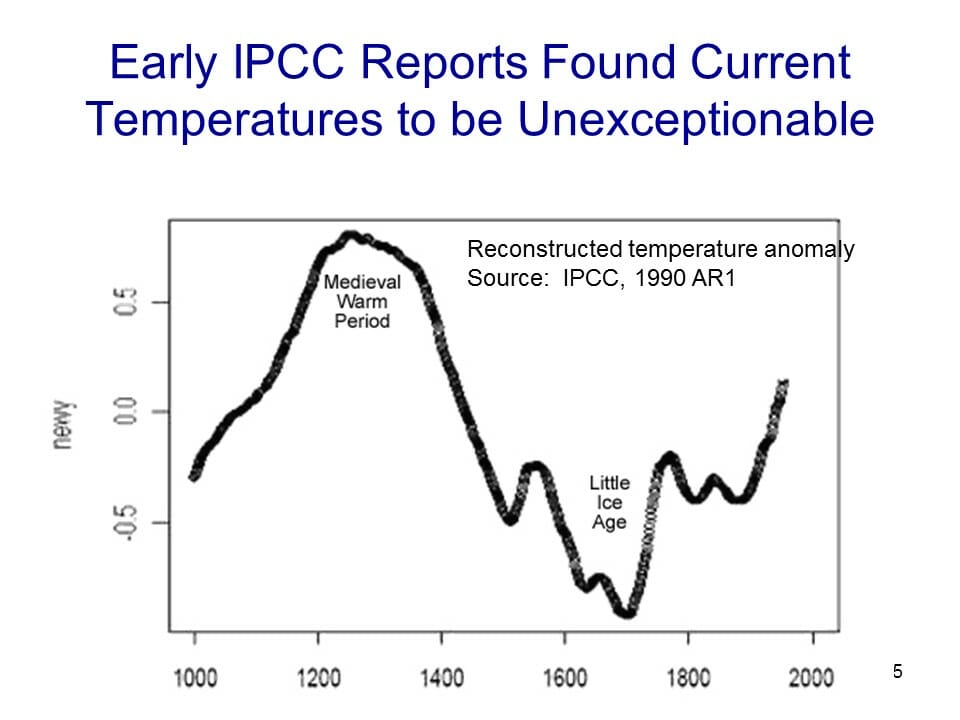
Before the Mann hockey stick, scientists (and the IPCC) believed the temperature history of the last 1000 years looked something like this


click to enlarge

Generally accepted history had a warm period from about 1100-1300 called the Medieval Warm Period which was warmer than it is today, with a cold period in the 17th and 18th centuries called the “Little Ice Age”.  Temperature increases since the little ice age could in part be thought of as a recovery from this colder period.  Strong anecdotal evidence existed from European sources supporting the existence of both the Medieval Warm Period and the Little Ice Age.  For example, I have taken several history courses on the high Middle Ages and every single professor has described the warm period from 1100-1300 as creating a demographic boom which defined the era (yes, warmth was a good thing back then).  In fact, many will point to the famines in the early 14th century that resulted from the end of this warm period as having weakened the population and set the stage for the Black Death.

However, this sort of natural variation before the age where man burned substantial amounts of fossil fuels created something of a problem for catastrophic man-made global warming theory.  How does one convince the population of catastrophe if current warming is within the limits of natural variation?  Doesn’t this push the default attribution of warming towards natural factors and away from man?

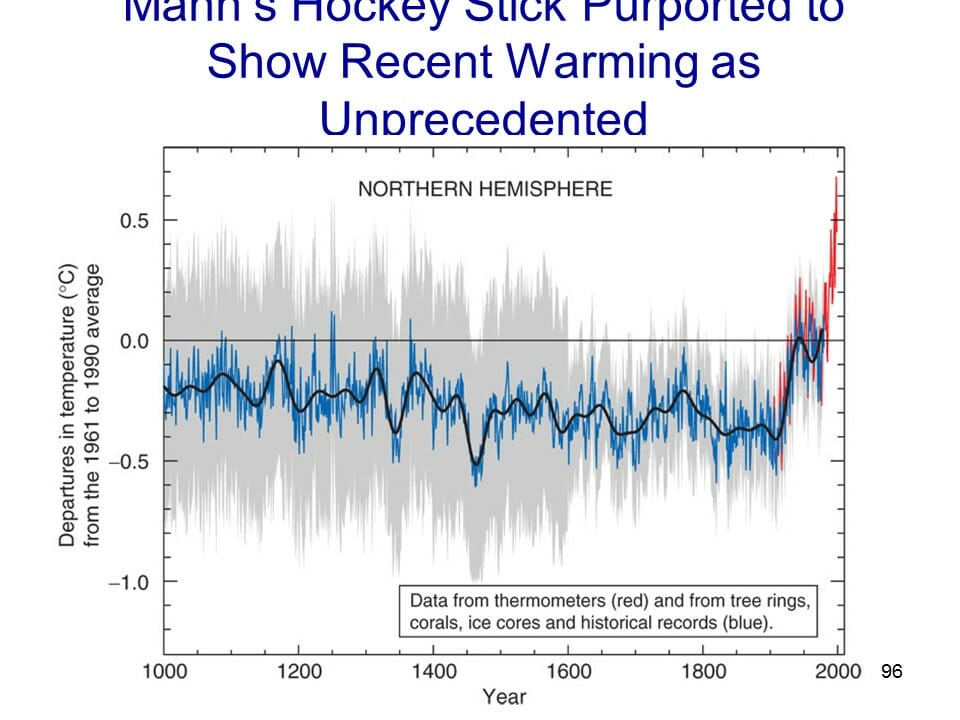
The answer came from Michael Mann (now Dr. Mann but actually produced originally before he finished grad school).  It has been dubbed the hockey stick for its shape:

click to enlarge

The reconstructed temperatures are shown in blue, and gone are the Medieval Warm Period and the Little Ice Age, which Mann argued were local to Europe and not global phenomena.  The story that emerged from this chart is that before industrialization, global temperatures were virtually flat, oscillating within a very narrow band of a few tenths of a degree.  However, since 1900, something entirely new seems to be happening, breaking the historical pattern.  From this chart, it looks like modern man has perhaps changed the climate.  This shape, with the long flat historical trend and the sharp uptick at the end, is why it gets the name “hockey stick.”

Oceans of ink and electrons have been spilled over the last 10+ years around the hockey stick, including a myriad of published books.  In general, except for a few hard core paleoclimatologists and perhaps Dr. Mann himself, most folks have moved on from the hockey stick as a useful argument in the attribution debate.  After all, even if the chart is correct, it provides only indirect evidence of the effect of man-made CO2.

Here are a few of the critiques:

  • Note that the real visual impact of the hockey stick comes from the orange data on the far right — the blue data alone doesn’t form much of a hockey stick.  But the orange data is from an entirely different source, in fact an entirely different measurement technology — the blue data is from tree rings, and the orange is form thermometers.  Dr. Mann bristles at the accusation that he “grafted” one data set onto the other, but by drawing the chart this way, that is exactly what he did, at least visually.  Why does this matter?  Well, we have to be very careful with inflections in data that occur exactly at the point that where we change measurement technologies — we are left with the suspicion that the change in slope is due to differences in the measurement technology, rather than in the underlying phenomenon being measured.
  • In fact, well after this chart was published, we discovered that Mann and other like Keith Briffa actually truncated the tree ring temperature reconstructions (the blue line) early.  Note that the blue data ends around 1950.  Why?  Well, it turns out that many tree ring reconstructions showed temperatures declining after 1950.  Does this mean that thermometers were wrong?  No, but it does provide good evidence that the trees are not accurately following current temperature increases, and so probably did not accurately portray temperatures in the past.
  • If one looks at the graphs of all of Mann’s individual proxy series that are averaged into this chart, astonishingly few actually look like hockey sticks.  So how do they average into one?  McIntyre and McKitrick in 2005 showed that Mann used some highly unusual and unprecedented-to-all-but-himself statistical methods that could create hockey sticks out of thin air.  The duo fed random data into Mann’s algorithm and got hockey sticks.
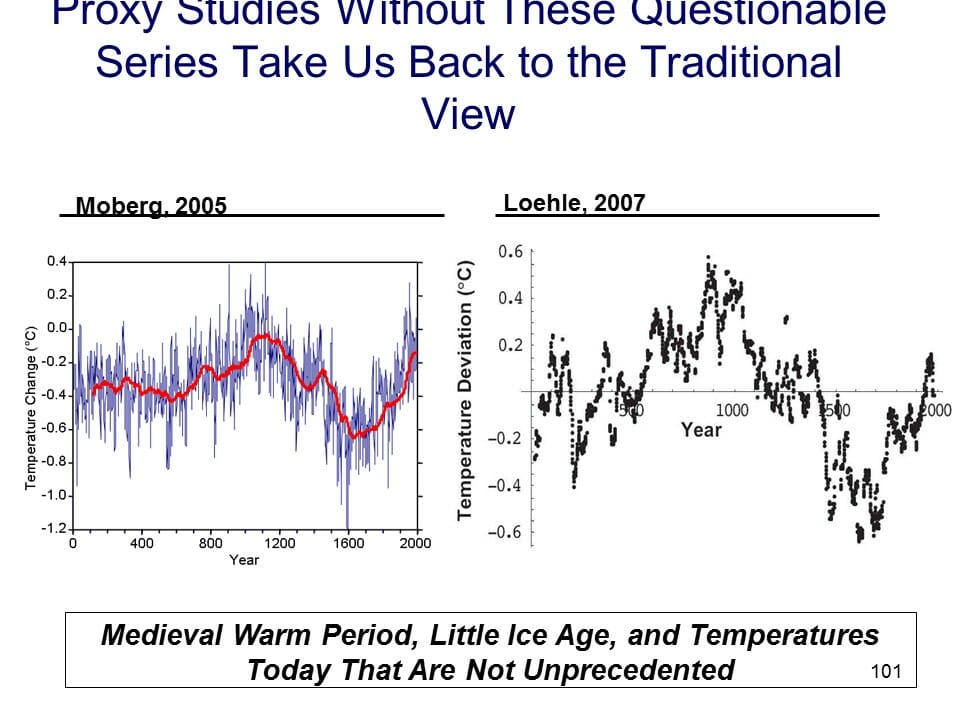
  • At the end of the day, most of the hockey stick (again due to Mann’s averaging methods) was due to samples from just a handful of bristle-cone pine trees in one spot in California, trees whose growth is likely driven by a number of non-temperature factors like precipitation levels and atmospheric CO2 fertilization.   Without these few trees, most of the hockey stick disappears.  In later years he added in non-tree-ring series, but the results still often relied on just a few series, including the Tiljander sediments where Mann essentially flipped the data upside down to get the results he wanted.  Taking out the bristlecone pines and the abused Tiljander series made the hockey stick go away again.There have been plenty of other efforts at proxy series that continue to show the Medieval Warm Period and Little Ice Age as we know them from the historical record:


click to enlarge

As an aside, Mann’s hockey stick was always problematic for supporters of catastrophic man-made global warming theory for another reason.  The hockey stick implies that the world’s temperatures are, in absence of man, almost dead-flat stable.   But this is hardly consistent with the basic hypothesis, discussed earlier, that the climate is dominated by strong positive feedbacks that take small temperature variations and multiply them many times.   If Mann’s hockey stick is correct, it could also be taken as evidence against high climate sensitivities that are demanded by the catastrophe theory.


The Current Lead Argument for Attribution of Past Warming to Man

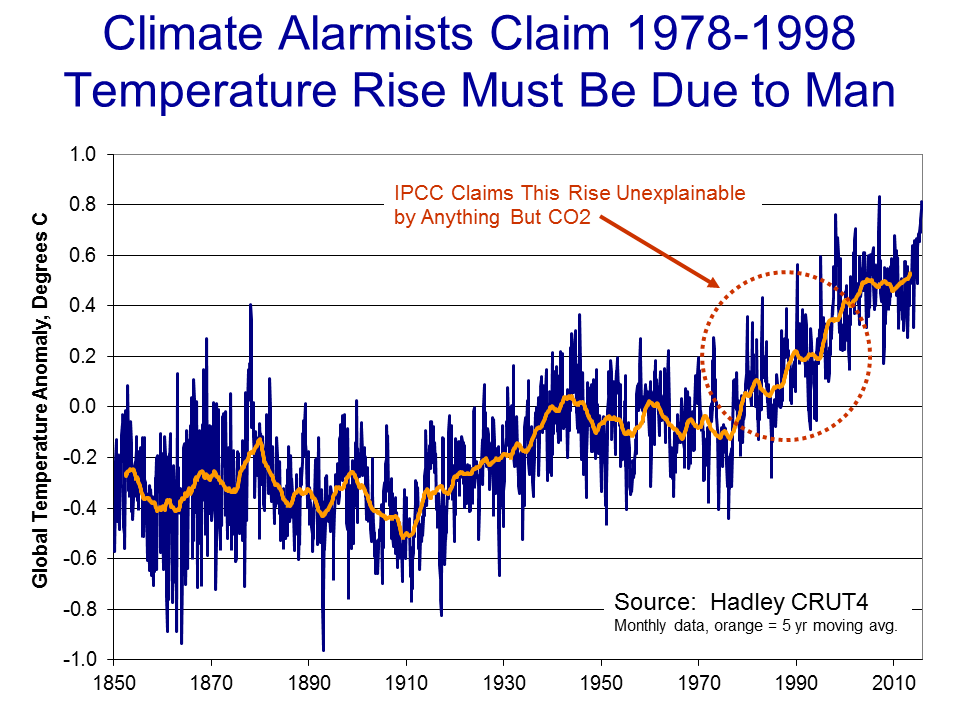
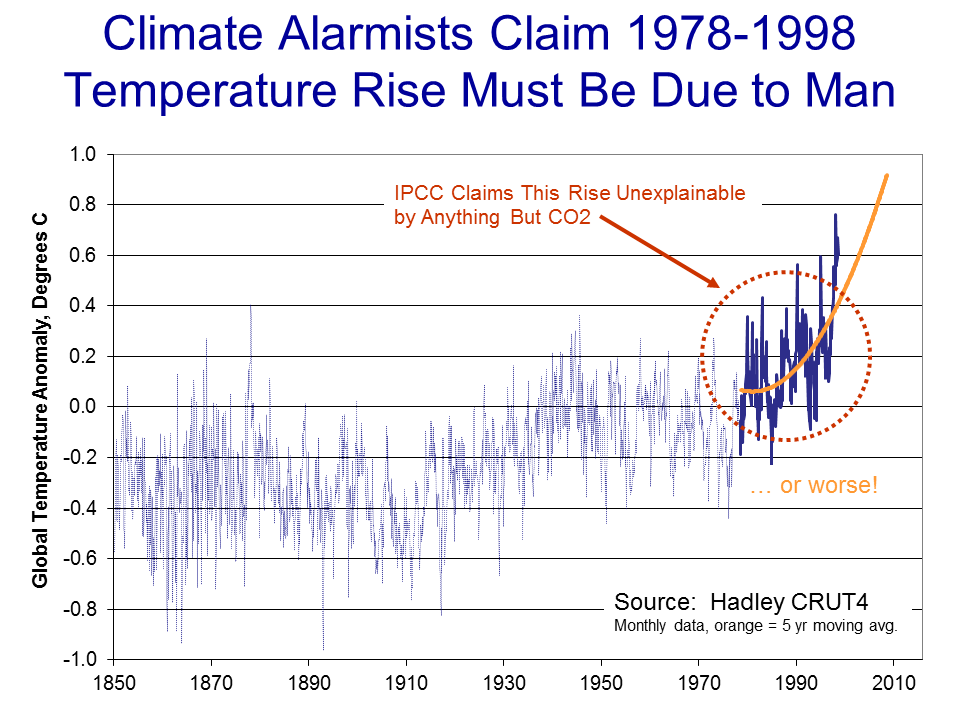
So we are still left wondering, how do climate scientists attribute past warming to man?  Well, to begin, in doing so they tend to focus on the period after 1940, when large-scale fossil fuel combustion really began in earnest.   Temperatures have risen since 1940, but in fact nearly all of this rise occurred in the 20 year period from 1978 to 1998:

click to enlarge

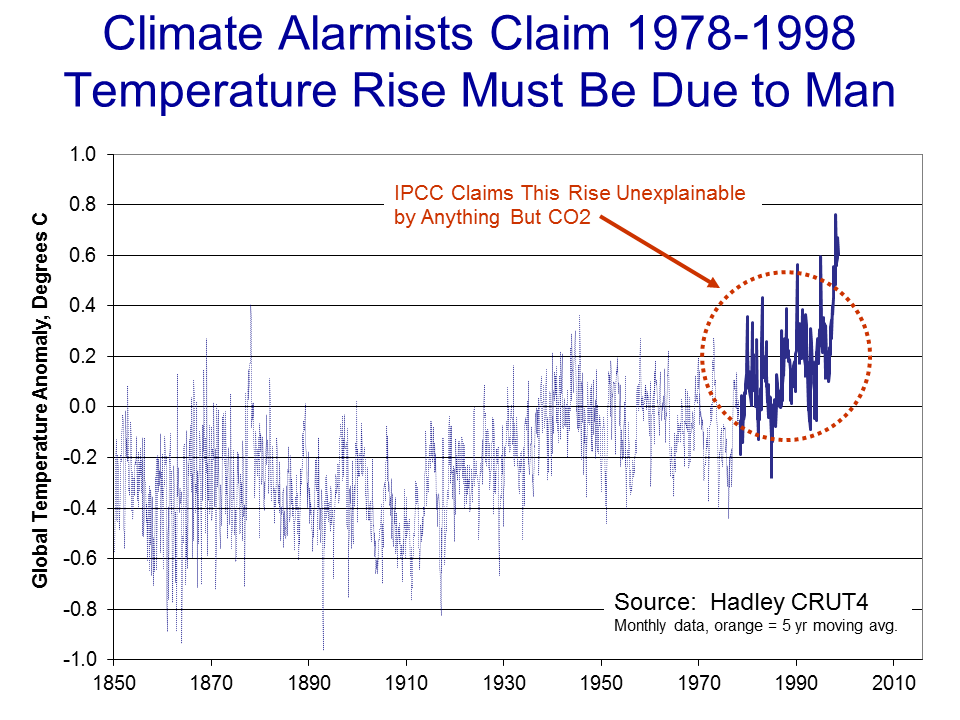
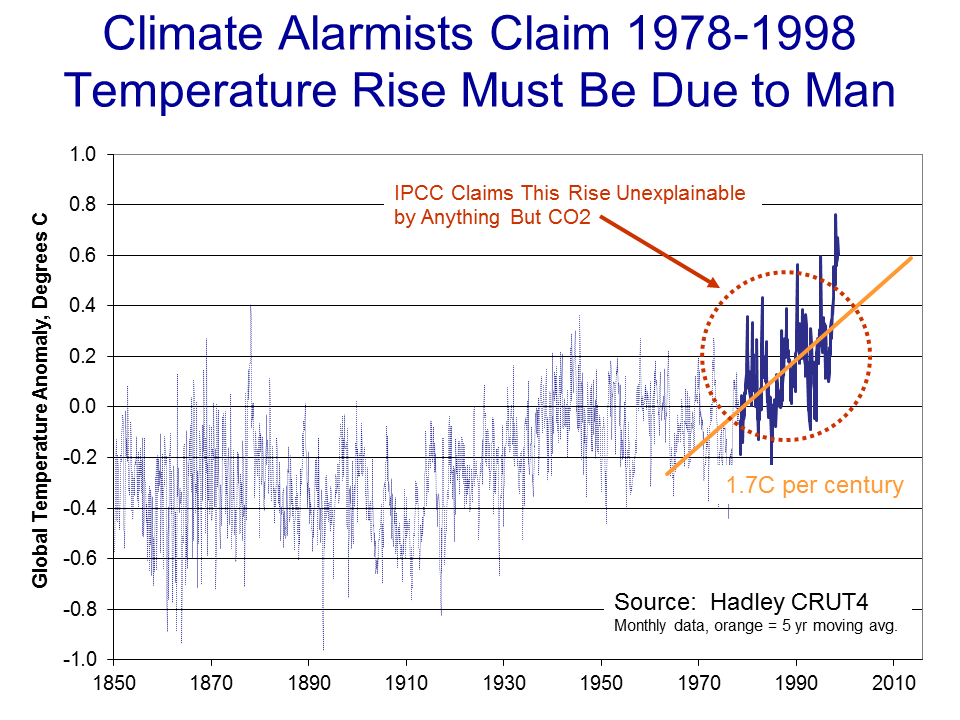
To be fair, and better understand the thinking at the time, let’s put ourselves in the shoes of scientists around the turn of the century and throw out what we know happened after that date.  Scientists then would have been looking at this picture:

click to enlarge

Sitting in the year 2000, the recent warming rate might have looked dire .. nearly 2C per century…

click to enlarge

Or possibly worse if we were on an accelerating course…

click to enlarge


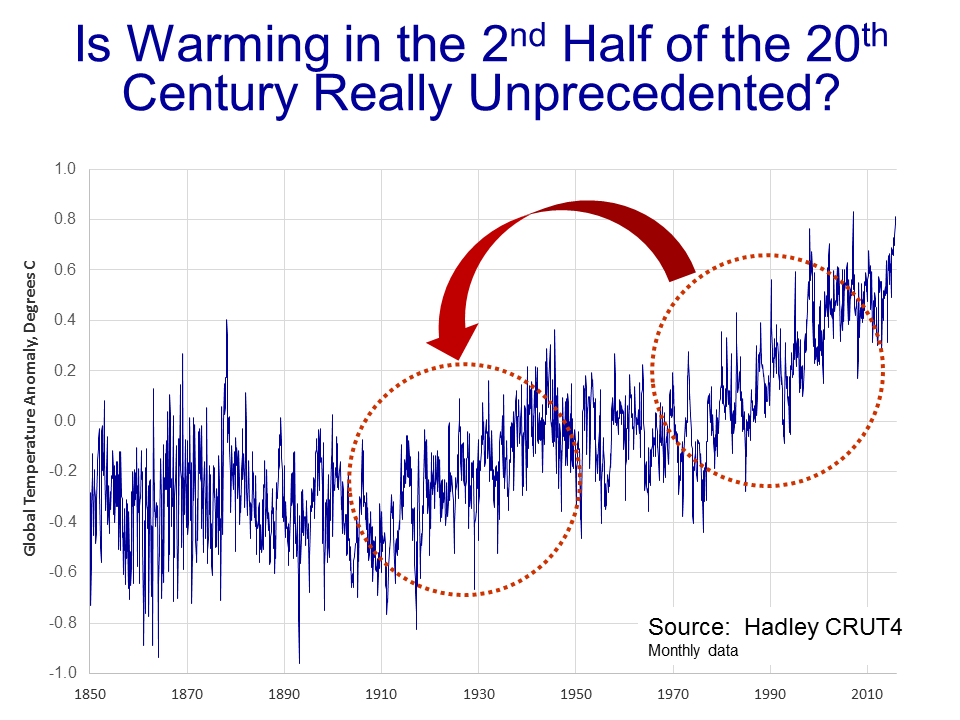
Scientists began to develop a hypothesis that this temperature rise was occurring too rapidly to be natural, that it had to be at least partially man-made.  I have always thought this a slightly odd conclusion, since the slope from this 20-year period looks almost identical to the slope centered around the 1930’s, which was very unlikely to have much human influence.

click to enlarge

But never-the-less, the hypothesis that the 1978-1998 temperature rise was too fast to be natural gained great currency.  But how does one prove it?

What scientists did was to build computer models to simulate the climate.  They then ran the computer models twice.  The first time they ran them with only natural factors, or at least only the natural factors they knew about or were able to model (they left a lot out, but we will get to that in time).  These models were not able to produce the 1978-1998 warming rates.  Then, they re-ran the models with manmade CO2, and particularly with a high climate sensitivity to CO2 based on the high feedback assumptions we discussed in an earlier chapter.   With these models, they were able to recreate the 1978-1998 temperature rise.   As Dr. Richard Lindzen of MIT described the process:

What was done, was to take a large number of models that could not reasonably simulate known patterns of natural behavior (such as ENSO, the Pacific Decadal Oscillation, the Atlantic Multidecadal Oscillation), claim that such models nonetheless accurately depicted natural internal climate variability, and use the fact that these models could not replicate the warming episode from the mid seventies through the mid nineties, to argue that forcing was necessary and that the forcing must have been due to man.

Another way to put this argument is “we can’t think of anything natural that could be causing this warming, so by default it must be man-made.  With various increases in sophistication, this remains the lead argument in favor of attribution of past warming to man.

In part B of this chapter, we will discuss what natural factors were left out of these models, and I will take my own shot at a simple attribution analysis.

Denying The Climate Catastrophe:4A Actual Temperature Data (Warren Meyers Essay)


I am rebloging Warren Meyers essay that says we should deny the climate catastrophe that the warmers predict.  This is a long chapter showing what the actual global temperature data really is.  There has been a lot of adjusting the data on the part of the warmers who, with the exception of the UAH satellite data, control the system.  This is the 4th chapter of his essay.   He titles this one as 4A and has a 4B which reviews the troubles with the surface temperature record.  He says the reader can skip 4B, so I may give just a reference to those who want read it can do so.

cbdakota


In our last chapter, we ended a discussion on theoretical future warming rates by saying that no amount of computer modelling was going to help us choose between various temperature sensitivities and thus warming rates.  Only observational data was going to help us determine how the Earth actually responds to increasing CO2 in the atmosphere.  So in this chapter we turn to the next part of our framework, which is our observations of Earth’s temperatures, which is among the data we might use to support or falsify the theory of catastrophic man-made global warming.

Continue reading

Climate Hustle – The Movie


The new movie produced by Marc Morano, “Climate Hustle” was in theaters on May 2 all over the country. The movie shows the skeptics side of the argument about CO2 and global warming,  aka Climate Change.  Many notable skeptics are in the cast.

The target audience, as I see it, was for the relatively low information people that get their global warming news from the main stream media.   If you are into this topic daily or often,  most of it will be review.   I think Morano did a very good job in assembling the topics and the players.  So I recommend it.    If there was something I would like to see expanded was the part where warmer predictions were examined.  About 10  predictions were discussed briefly. I would like to have seen more emphasis.

As part of the film and as an “extra” was a panel  that discussed current issues especially those of the current attempt to criminalize discussion of skeptic views. Bill Nye is feature in it and comes off looking pretty small minded.  The panel moderator was Brett Bozell and the panel consisted of Sarah Palin, David Legates and Marc Morano.   David Legates stood out.

Looking at Morano’s blog, “Climate Depot”,  the attendance was good, nation-wide.   I went over to  Delaware and my estimate was that about 50 people were in the theater.

This was a one night showing and I am not sure what the plans are for this movie.  It may see a general release or perhaps be available in places like Netflix.

cbdakota