Category Archives: fossil fuels

NASA Satellite:Highest Levels Of CO2 In Southern Hemisphere


A new NASA satellite finds the highest levels of atmospheric CO2 in the Southern Hemisphere. One would have expected the highest levels over the Northern Hemisphere where the highest concentration of fossil fuel use occurs. This result is the first publication of the satellite’s measurements so it may be an anomaly.

NASA provided the following “Average CO2 Concentration Oct 1 to Nov. 11, 2014” chart:

OCO-2image2Note the scale on the bottom of the chart, that ranges from 387 to 402.5 ppm atmospheric CO2. As you can see the more red the coloring on the chart the higher the CO2 level. Roughly the red begins about 400 ppm. The reddest areas are over South America, Africa, Indonesia, China, the Northern Pacific East of Japan and the Southern Pacific East of Australia.

Continue reading

Why Are Crude Oil Prices Falling? And Will We Regret It?


Saudi Arabia is a major producer and seller of crude oil as well as the unelected leader of the Organization of Petroleum Exporting Countries (OPEC). Saudi has, in the past, adjusted its production (and thus sale of crude oil) to keep the price OPECnetoilexportrevs2013chart2at a level that OPEC desired. For example, if global demand for crude softened, Saudi would cut back production to match demand thus stabilizing the price. The Department of Energy chart shows how Saudi dominates OPEC export sales.

This autumn the demand for OPEC crude fell—but, Saudi decided not to balance supply and demand.   Consequently the price of crude oil has dropped to about 50% of what it was at its high in June 2014.

Continue reading

Obama Agrees To Give China A 16-Year Advantage On Energy Costs.


onionpicofobamaandJinping700President Obama announced a “historic” (probably should have said “hysterical”) agreement with China regarding greenhouse gases.  The President says we will reduce CO2 emissions by an economy-wide targets by 26%-28% below its 2005 level in 2025.    This will require an equivalent reduction of the use of fossil fuels (oil, natural gas and coal).   China will continue to increase its CO2 emissions to sometime around 2030 and to make best efforts to peak early and intends to increase the share of non-fossil fuels in primary energy consumption to around 20% by 2030.   So, the US will incur sharp increases in the cost of energy over this period of time.  China gets the green light to use the cheapest form of energy production until at least 2030.

Continue reading

Chinese Reject Electric Cars


Henry Lee of the Harvard Kennedy School reports the Chinese chineseelectricsimagesgovernment cannot make their people buy electric cars. The American “Green” press insists that China is the leader in green technology and that they want to join in a pact to reduce CO2 emissions.   Well if you watch what the Chinese do rather than what they say, you would know they have no intention of cutting back on the use of fossil fuels.

Continue reading

Shutting Down U.S. Coal Based Power Plants Will Not Lower Global Temperatures


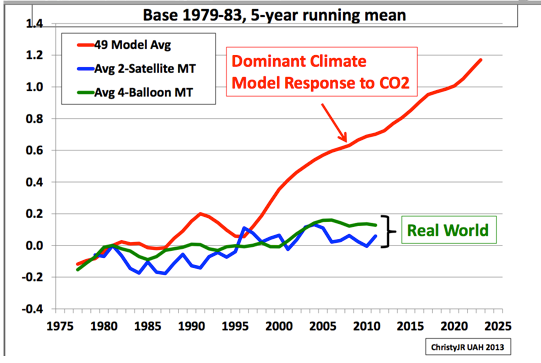
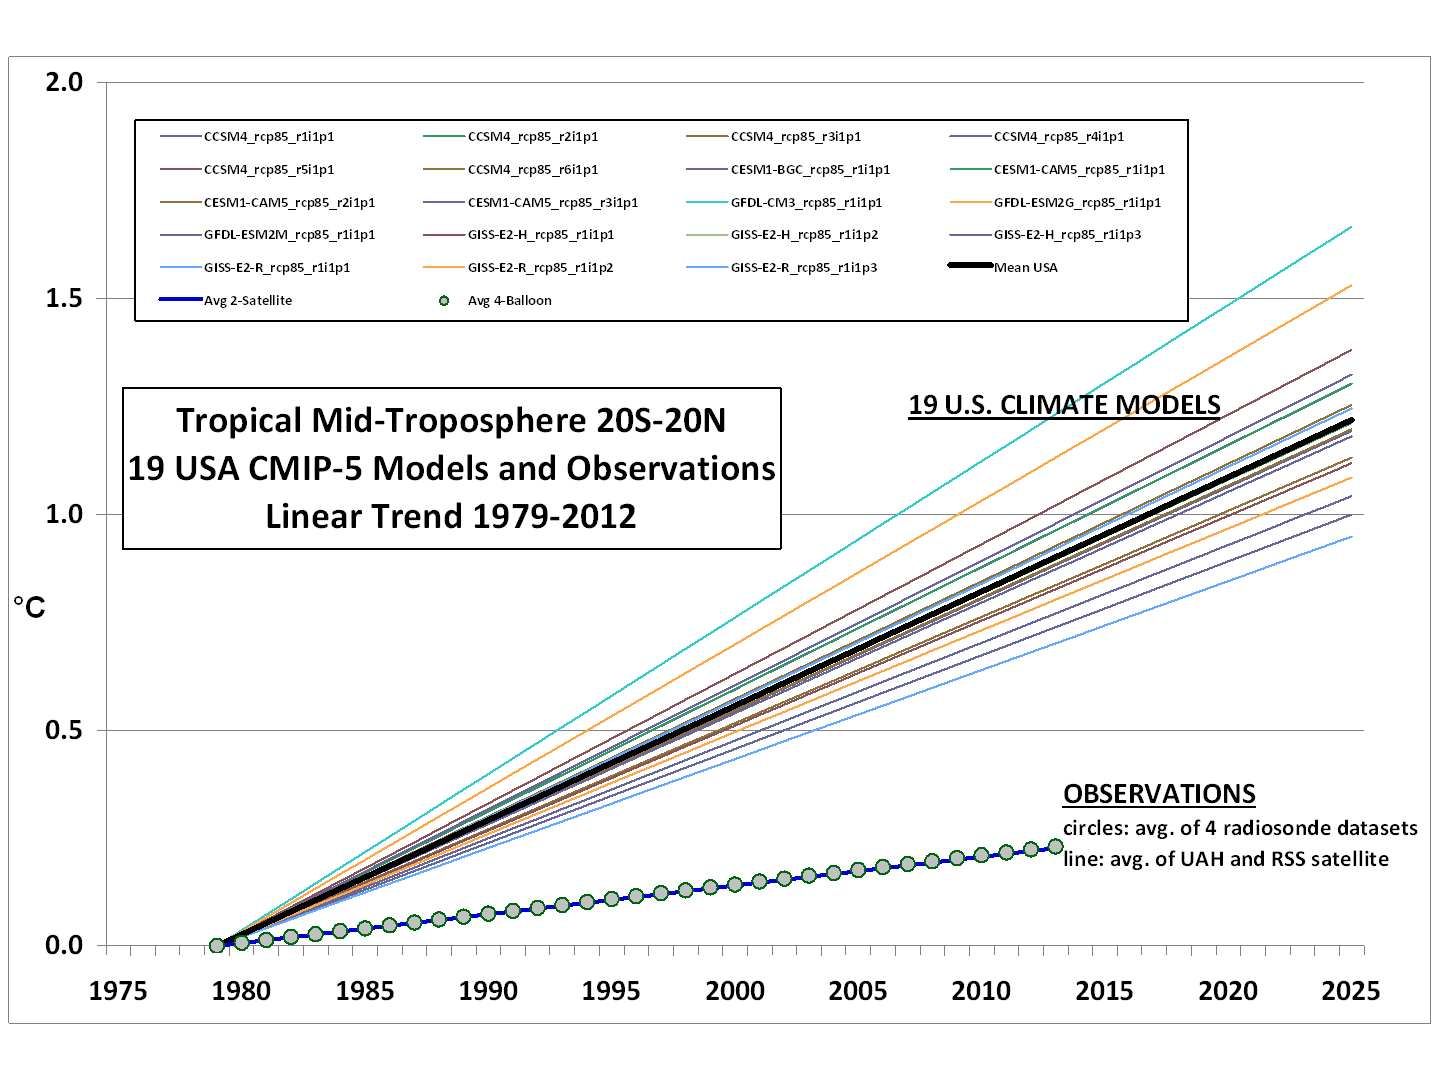
The U.S. Environmental Protection Agency (EPA) recently issued a new set of proposed regulations aimed at reducing carbon dioxide emissions from existing U. S. power plants. The premise for this EPA action is that unless CO2 emissions are reduce global temperatures would rise by the end of this century to levels that would cause catastrophic climate change damage. But the basis for such action is not science but rather politics. In our previous posting, it was shown that climate models that predict global temperature are not skilled and have not predicted actual measured global temperatures. Using these models to base legislation is playing Russian Roulette with the US economy.

Knappenberger and Michaels (K&M) posted on 12 June in WUWT “EPA leaves out the most vital number in their fact sheet”. They show that this initiative will not have any measureable effect on global temperatures. K&M summarize the “regulation”:

“The EPA’s regulations seek to limit carbon dioxide emissions from electricity production in the year 2030 to a level 30 percent below what they were in 2005. It is worth noting that power plant CO2 emissions already dropped by about 15% from 2005 to2012, largely, because of market forces which favor less-CO2-emitting natural gas over coal as the fuel of choice for producing electricity.”


“For some reason, they left off their Fact Sheet how much climate change would be averted by the plan. Seems like a strange omission since, after all, without the threat of climate change, there would be no one thinking about the forced abridgement of our primary source of power production in the first place, and the Administration’s new emissions restriction scheme wouldn’t even be a gleam in this or any other president’s eye.”

“But no worries.  What the EPA left out, we’ll fill in.

“Using a simple, publically-available, climate model emulator called MAGICC that was in part developed through support of the EPA, we ran the numbers as to how much future temperature rise would be averted by a complete adoption and adherence to the EPA’s new carbon dioxide restrictions*.”

The answer? Less than two one-hundredths of a degree Celsius by the year 2100.   0.018°C to be exact. 

Well how did they come up with that number?

  • They used the Model for the Assessment of Greenhouse-gas Induced Climate Change (MAGICC)— to examine the climate impact of proposed regulations.They used the three IPCC Representative Concentration Pathways (RCP). RCP4.5=low-end emissions, RCP6.0=middle of the road and RCP8.5=high emissions.
  • They estimated the US power plant CO2 emissions.

KMcarbonemissionscenariosgsr_061114_fig1Figure 1. Carbon dioxide emissions pathways defined in, or derived from, the original set of Representative Concentration pathways (RCPs), for the global total carbon dioxide emissions as well as for the carbon dioxide emissions attributable to U.S. electricity production.

“We then used MAGICC to calculate the rise in global temperature projected to occur between now and the year 2100 when with the original RCPs as well as with the RCPs modified to reflect the EPA proposed regulations (we used the MAGICC default value for the earth’s equilibrium climate sensitivity (3.0°C)).”

KMglobalavgsurfacetempgsr_061114_fig2Figure 2. Global average surface temperature anomalies, 2000-2100, as projected by MAGICC run with the original RCPs as well as with the set of RCPs modified to reflect the EPA 30% emissions reductions from U.S power plants.

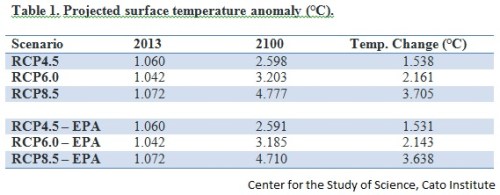
Because the difference between lines is so small, the authors added two tables for the data illustrated in figure 2.

KMtable1gsr_061114_fig3a

KMtable2gsr_061114_fig4a

Yes,  this posting says that the computer models are not suitable to make policy decisions and yet the K & M posting is predicated on a computer model. Two things here. First, in the course of making this new policy the EPA climate model must have been run by the EPA. They did not list a drop in global temperatures so they know it is devastating.   Second, the EPA is not likely to claim the K & M work is invalid because EPA must use this model in their other pronouncements about climate .


The K& M posting should be read in its entirety.

cbdakota


Obama Shutting Down Coal Based Power Plant Based Upon Computer Model Predictions.


Climate models have not demonstrated skill at making climate predictions. Yet, the proponents of man-made global warming cite the model outputs when telling us what the global temperature will be in 2100!!!!

From the Patriot Post, Joe Bastardi’s July 16 2013 posting “Evidence That Demands a Verdict:

Assumed validity of climate models

‘This is almost laughable. Anyone who works in the field every day – as we do in the private sector – knows how bad models can be.”

“But the point is that the models are a mathematical representation of a chaotic field and I can not even fathom that this could be one of their reasons. It shows the ignorance as to the nature of the climate. It also shows the willingness of those that truly don’t understand weather and climate to place trust in a model. It’s flabbergasting.

One picture destroys the whole premise. Dr. John Christy, who testified before congress on this matter, has put this graph together:”

ChristytempvsmodelScreenShot2013-07-16at101433AM_zpsfe6dc649

The chart shows how far off the climate models are from the actual global temperature measurements (Real World).

“The following graph from Dr. Roy Spencer is even more dramatic. While Dr. Christy shows the average, Dr. Spencer shows how the individual predictions of 19 US models are all well above actual observations. And the EPA is trying to base policy on this?”

spencer19usclimatemodelsCMIP5-19-USA-models-vs-obs-20N-20S-MTThis shotgun approach (19 models) points out that the alarmists modelers don’t have a clue. In MHO, if the climate model program was worth anything, you would only need one.

“Why anyone would think they could justify EPA’s regulatory plans or suggest a carbon tax as an alternative given the facts presented above is beyond me.

The facts clearly reveal that the EPA and the president do not have a leg to stand on as their policies assault the very energy lifeline of our economy at this critical time in our nation’s history. The EPA’s decisions are based on erroneous ideas.”

The politicians that want to manage our use of fossil fuels are ignoring the facts.   Why wont they look at actual data instead of relying on models that have no skill? Politics, of course, but what are the underlying motives?

The next posting will discuss the cost/benefit for the Obama plan to put coal out of business.

cbdakota


2020 UN Treaty: US And Europe’s Energy Use To Match The Philippines?


The target of 1 trillion tonnes of CO2 is part of the discussion underway in Poland at COP 19.  The delegates want to get a treaty in place by 2020 which all nations will sign when the Kyoto Treaty expires.  The new treaty will demand two things.  Reparations for the developing nations for the “damage” resulting from global warming that the developed nations are responsible for and an agreement by which CO2 emissions are dramatically reduced. (Click on charts to enlarge.)

Screen Shot 2013-11-14 at 12.38.03 PM

The developed nations had agreed to supply $30 billion in the period of 2010-2012.  Five nations–US, Germany, Norway, UK and Japan—gave a total of $27 billion. The desired treaty will include vast sums of money to be transferred between developed and less developed countries.  There was a study done of how much money would be needed to accomplish the objective of never letting the atmospheric CO2 exceed 1 trillion tonnes and the number was $5.7 trillion.  Not all of this is transfer money.  Much of it would go for changes to the global energy structure.

Continue reading

August Electric Vehicle Sales


This might be the right time to begin separating monthly sales of plug-in hybrids vehicles from battery vehicles.  So here goes.

Plug-in hybrids (PHV) August Sales.

The August PHV sales were up by 83% over July’s sales.  Volt led this category with 3,351 vehicle sales and a 52% share of this market. Volt year-to-date sales were 14, 994. The Prius PHV sales were 1,791 and with year-to-date sales of 6,822.   Others making a showing were Ford C-Max with sales of 621 and Ford Fusion Energi with 600.

pluginsalesaugust136a00d8341c4fbe53ef019aff36fe6e970d-800wi

(Click on chart for clarity)

The chart does show some reasonably good upward movement for PHEV sales. But not to get too excited just yet, Green Car Congress posts that: “With overall light-duty vehicles sales of 1,503,151 units in August (up 17% year-on-year), according to AutoData, plug-in hybrids had a 0.4% share of the August new vehicle market.”

Battery Electric Vehicles (BEV) August Sales

The Nissan LEAF August sales were 2,420 with year-to-date sales at 14,123.

Tesla is the elephant in the room.  The next report on sales will be at the end of the third quarter so it is a guess where they rank in the scheme of things.  Green Car Congress reports sales of Leafs plus a number of other models with sales in the 200 or below would add to August BEV sales of 3,206.  They estimate that upward of 1700 Teslas were probably sold in August increasing the total BEV August sales to about 4,900 units. BEV sales would be about 0.3% of the August new vehicle sales.

Still far from impressive.

cbdakota

It Is Better To Adapt Than Mitigate CO2 Emission-Mitigation Is 50X More Costly


Paraphrasing Hamlet, “Is it better to mitigate CO2 emissions from sources such as fossil fuels or adapt to global changes that might happen if emissions were not regulated?  Ah that’s the question.”

hamlet220px-Edwin_Booth_Hamlet_1870

Continue reading

Fuel Cell Vehicles


Like the tide, going in and out and so does the Fuel Cell Vehicle favorability.   Right now favorability is pretty well in the tank, but not completely.  The city of London is installing hydrogen (H2) fueling stations with the objective of encouraging their use.  California has a similar program, as does Germany.

Some of you may not be familiar with fuel cell cars because they have been  out of the spotlight recently.  The following is an overview of  the  fuel cell and the fuel cell car.   The cartoon below pictures most of the hardware needed.

Fuelcellcarforblog

Courtesy of http://www.imageproduction.nl

Continue reading