Category Archives: CO2 positive feedback

Skeptics Best Warmers In Global Warming Quiz


Dan Kahan, Yale law professor and communications researcher, posted a paper in June, 2014, that reported on his work to try to remove bias when testing a subject’s knowledge. That paper can be reviewed by clicking here.

globalwarming credibilityimagesFrom reports on Fox News, Kahan submitted the paper and it will be published by Advances in Political Psychology. The paper’s intention was to determine what the general population thinks they know about anthropogenic global warming (AGW). Kahan used a quiz containing 9 questions. Something in the range of 2000 people were randomly chosen to take the quiz. The numbers of skeptic and warmers were about equal in number. He computed each testee’s answers. He then compared the skeptics and warmers answers for each of the nine questions. The results according to a report found that the skeptics answered more questions correctly than did the warmers.   The difference was small, with the skeptics average scoring 4.5 correct versus the warmers that got “about 4” correct.

Continue reading

Part 4 CO2 Causes What? The Amplification That Wasn’t There


The warmers know that CO2 by its self is insufficient to get the predicted temperature rises that they need to scare you with future weather of catastrophic proportions.   So they decided that there is a positive feedback that occurs.   The theory goes like this— For every little temperature increase resulting from CO2 interrupting thermal IR headed back into space, that interruption will cause some small amount of temperature increase which in turn will force more water vapor into the atmosphere. So this increase in water vapor, the big green house gas, absorbs more thermal IR and the temperature goes up.

The following illustration (by Dr. David Evans) begins with the increase in global temperature from a doubling (say 400ppm to 800 ppm) from “established science—1.1C. Then the warmer’s inferred amplification, will increase the temperature by 3 fold resulting in a final temperature increase of 3.3C. That is what the climate models produce and that is where the warmers get their scary scenarios.

CO2doublingandfeedbackevans_figure1

Figure 1 Amplification:

Continue reading

CO2 Causes What? Part 2—The Carbon Cycle


The theory of catastrophic anthropogenic (man-made) global warming (CAGW) as interpreted by a certain group (the warmers) is predicated on the idea that carbon dioxide (CO2) in the atmosphere has the potential to do serious harm to the Earth. Their theory goes like this: Nature releases and then recaptures CO2, thus the atmospheric CO2 content is stable. They then add, largely, through the CO2 produced from burning fossil fuels , man has upset that balance and CO2 is accumulating in the atmosphere. The chart below by the National Oceanic and Atmospheric Administration (NOAA) is a representation of the “Carbon Cycle”.

CO2blogcarboncycleThe numbers on the chart are Giga tons of carbon on an annual basis. A giga ton is one billion tons, that is to say 1,000,000,000 tons.

According to this chart, every year the “gross global primary production and respiration” releases 119 giga tons and then takes in 120 giga for growing vegetation. The ocean’s emit 88 giga tons and absorb 90 giga tons. Fossil fuel combustion and other industrial processes emit 6.3 giga tons and have no returns. Land use changes are small at 1.7 emited and 1.9 returned. It also tells us that 730 giga tons of carbon are in the atmosphere.   In our last posting we related that the atmospheric CO2 is at 400ppm. That gives you some idea of how vast the Earth’s atmosphere is.

There are many drawings of the carbon cycle and they often have different numbers than the one shown above. But the idea is the same in all cases. The chart makers really are guessing at the numbers anyway. The fossil fuels number is the only one where data are largely available. So it is likely the best one. Another thing to know about this chart is that it is in tons of carbon. There are other sources of carbon such as methane, CH4. But because CO2 is the major carbon source you can read the chart as essentially a gross measure of CO2 for our purposes.

The net exchange by this chart results in an annual carbon accumulation of 4.1 giga tons into the atmosphere. The total from the chart of the emissions to the atmosphere are about 205 giga tons of which 8 giga tons are man-made or 4% of the total CO2 emissions. This raises the obvious question: if the big natural numbers (in blue) are no more than broad estimates, do we really know what is going on?

The next posting will examine a version of the Greenhouse Effect.

cbdakota


CO2 Causes What? Part 1– How Much CO2 Is In The Atmosphere?


When a discussion of “greenhouse gases” takes place, one sometimes wonders if the reader is aware of the make up of the Earth’s atmosphere.   Many of you, especially the engineers and scientists that read this blog, know about the elements that make up the atmosphere and what the carbon cycle is. But for those that don’t have this background,  this may help.

The measured atmospheric CO2 is about 400 parts per million (ppm) at present. That means that for every 1,000,000 gas molecules in our atmosphere, about 400 of the gas molecules are carbon dioxide.

Continue reading

Obama Shutting Down Coal Based Power Plant Based Upon Computer Model Predictions.


Climate models have not demonstrated skill at making climate predictions. Yet, the proponents of man-made global warming cite the model outputs when telling us what the global temperature will be in 2100!!!!

From the Patriot Post, Joe Bastardi’s July 16 2013 posting “Evidence That Demands a Verdict:

Assumed validity of climate models

‘This is almost laughable. Anyone who works in the field every day – as we do in the private sector – knows how bad models can be.”

“But the point is that the models are a mathematical representation of a chaotic field and I can not even fathom that this could be one of their reasons. It shows the ignorance as to the nature of the climate. It also shows the willingness of those that truly don’t understand weather and climate to place trust in a model. It’s flabbergasting.

One picture destroys the whole premise. Dr. John Christy, who testified before congress on this matter, has put this graph together:”

ChristytempvsmodelScreenShot2013-07-16at101433AM_zpsfe6dc649

The chart shows how far off the climate models are from the actual global temperature measurements (Real World).

“The following graph from Dr. Roy Spencer is even more dramatic. While Dr. Christy shows the average, Dr. Spencer shows how the individual predictions of 19 US models are all well above actual observations. And the EPA is trying to base policy on this?”

spencer19usclimatemodelsCMIP5-19-USA-models-vs-obs-20N-20S-MTThis shotgun approach (19 models) points out that the alarmists modelers don’t have a clue. In MHO, if the climate model program was worth anything, you would only need one.

“Why anyone would think they could justify EPA’s regulatory plans or suggest a carbon tax as an alternative given the facts presented above is beyond me.

The facts clearly reveal that the EPA and the president do not have a leg to stand on as their policies assault the very energy lifeline of our economy at this critical time in our nation’s history. The EPA’s decisions are based on erroneous ideas.”

The politicians that want to manage our use of fossil fuels are ignoring the facts.   Why wont they look at actual data instead of relying on models that have no skill? Politics, of course, but what are the underlying motives?

The next posting will discuss the cost/benefit for the Obama plan to put coal out of business.

cbdakota


2020 UN Treaty: US And Europe’s Energy Use To Match The Philippines?


The target of 1 trillion tonnes of CO2 is part of the discussion underway in Poland at COP 19.  The delegates want to get a treaty in place by 2020 which all nations will sign when the Kyoto Treaty expires.  The new treaty will demand two things.  Reparations for the developing nations for the “damage” resulting from global warming that the developed nations are responsible for and an agreement by which CO2 emissions are dramatically reduced. (Click on charts to enlarge.)

Screen Shot 2013-11-14 at 12.38.03 PM

The developed nations had agreed to supply $30 billion in the period of 2010-2012.  Five nations–US, Germany, Norway, UK and Japan—gave a total of $27 billion. The desired treaty will include vast sums of money to be transferred between developed and less developed countries.  There was a study done of how much money would be needed to accomplish the objective of never letting the atmospheric CO2 exceed 1 trillion tonnes and the number was $5.7 trillion.  Not all of this is transfer money.  Much of it would go for changes to the global energy structure.

Continue reading

Let’s Nominate National Geographic For The Hugo Award


The Hugo Awards are presented annually to the best science fiction. Science fiction is defined by Wiki as: a genre of fiction dealing with imaginative content such as futuristic settings, futuristic science and technology, space travel, time travel, parallel universes and extraterrestrial life. Their September 2013 issue featuring “Rising Seas” would probably qualify for the Hugo.

natgeo_statue_liberty_sea_level

The NG cover illustration of the Statue of Liberty waist deep in water resulting from sea level rise was a major, imaginative exaggeration. The statue’s waist is more than 200 feet above sea level at present. Using the actual rate of sea level rise at Battery, NY since 1850 to calculate how long it would take to match the waist water level, resulted in a figure of about 23,500 years or so. (See the calculation by clicking here.)

Continue reading

Skeptical Scientists Effectively Challenge IPCC Climate Change Report


The IPCC has issued the 2013 report on global Climate change.  The skeptic community has effectively challenged the IPCC primary positions.   This post will provide a broad selection of those challenges for the reader to examine.   Each of the 18  entries will give you the title, a brief synopsis, and the link to that document.

The IPCC failed on two major issues.  Their failed to explain why global temperatures have not increased in the past 16 years despite a continued growth of atmospheric carbon dioxide (CO2).   The second issue is that of climate sensitivity.  They did say that in the past, they had overestimated climate sensitivity but did not tell us what they now believe it to be. This posting will also cover climate model performance and should the IPCC be discontinued.

GLOBAL TEMPERATURES

Continue reading

GLOBAL WARMING AND CLIMATE CHANGE: SCIENCE AND POLITICS


A referred paper in Quaestiones Geographicae* written by Cliff Ollier titled “Global Warming and Climate Change: Science and Politics “ maintains the idea that global warming will bring on devastation is a dangerous belief.  Ollier challenges the belief that CO2 is a major force in defining the globe’s climate.   He also takes on the corollary issues such as sea level, the Sun and climate.  The abstract to the paper follows:
The threat of dangerous climate change from anthropogenic global warming has decreased.
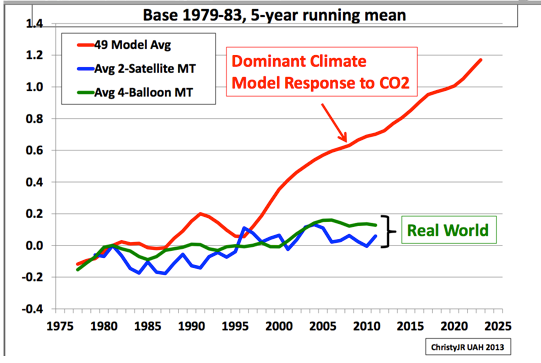
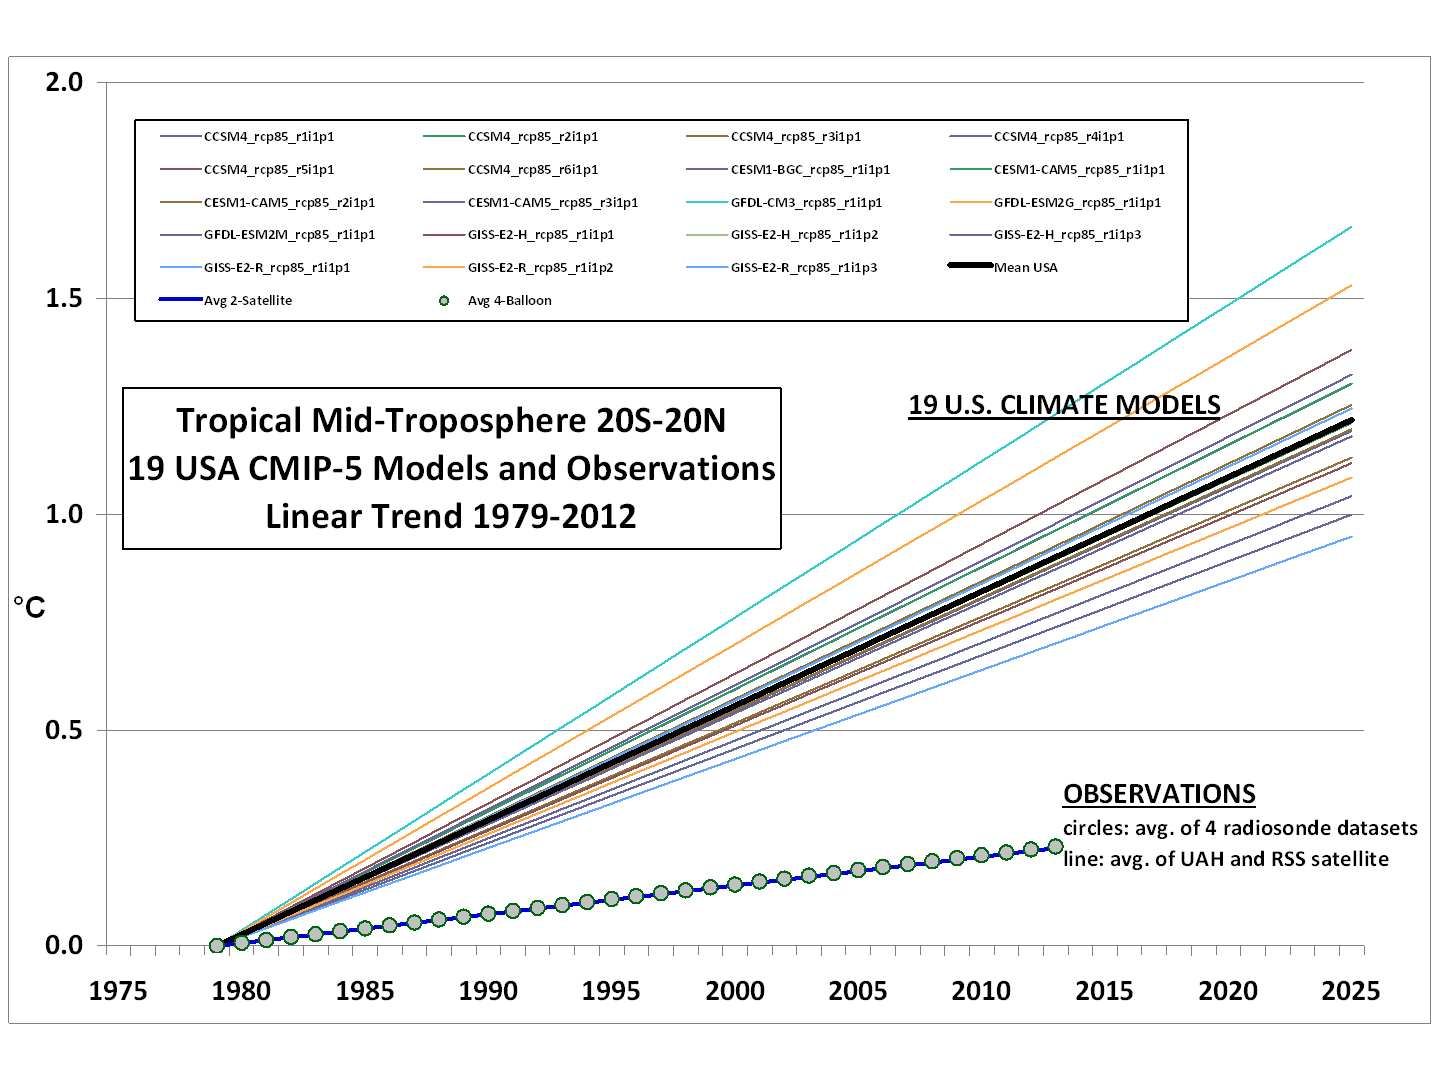
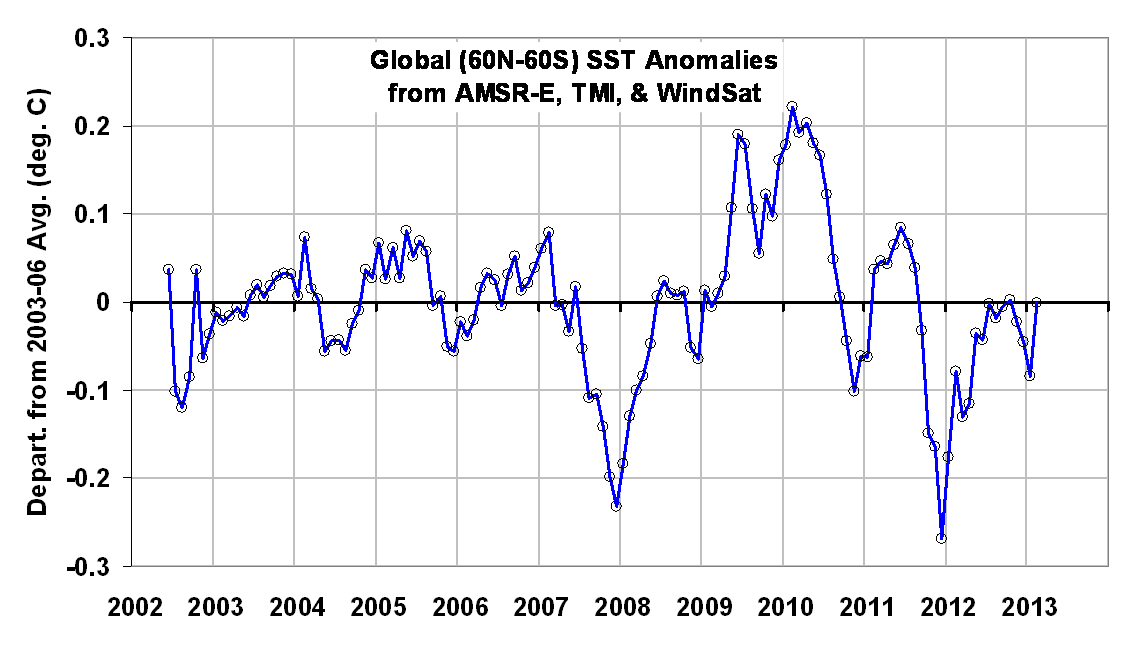
• Global temperature rose from 1975 to 1998, but since then has leveled off.
• Sea level is now rising at about 1.5mm per year based on tide gauges, and satellite data suggests it may even be falling.
o Coral islands once allegedly threatened by drowning have actually increased in area.
o Ice caps cannot possibly slide into the sea (the alarmist model) because they occupy kilometres-deep basins extending below sea level.
o Deep ice cores show a succession of annual layers of snow accumulation back to 760,000 years and in all that time never melted, despite times when the temperature was higher than it is today.
o Sea ice shows no change in 30 years in the Arctic.
• Emphasis on the greenhouse effect stresses radiation and usually leads to neglect of important factors like convection.
o Water is the main greenhouse gas.
o The CO2 in the ocean and the atmosphere are in equilibrium: if we could remove CO2 from the atmosphere the ocean would give out more to restore the balance. Increasing CO2 might make the ocean less alkaline but never acid.
• The sun is now seen as the major control of climate, but not through greenhouse gases.
o There is a very good correlation of sunspots and climate.
o Solar cycles provide a basis for prediction. Solar Cycle 24 has started and we can expect serious cooling.
• Many think that political decisions about climate are based on scientific predictions but what politicians get are projections based on computer models.
o The UN’s main adviser, the IPCC, uses adjusted data for the input, their models and codes remain secret, and they do not accept responsibility for their projections.
The issues listed in the Abstract are explored in some detail in the full paper that you can access by clicking here.
cbdakota

February 2013 Global Temperature Update


The global atmospheric temperature anomaly dropped by about 0.33° C to  +.18 degrees above from 30-year (1981-2010) average.

atmospherictempfeb2013UAH_LT_1979_thru_Feb_2013_v5.5

Dr Spencer also reports that the sea surface temperature anomaly for February was
-0.01 º C, relative to the 2003-2006 average.
 seasurfacetempfeb2013RSS_mwSST_2002_thru_Feb_2013
Additional discussion of these anomaly temperature charts can be access by clicking here.
cbdakota