
The warmers know that CO2 by its self is insufficient to get the predicted temperature rises that they need to scare you with future weather of catastrophic proportions. So they decided that there is a positive feedback that occurs. The theory goes like this— For every little temperature increase resulting from CO2 interrupting thermal IR headed back into space, that interruption will cause some small amount of temperature increase which in turn will force more water vapor into the atmosphere. So this increase in water vapor, the big green house gas, absorbs more thermal IR and the temperature goes up.
The following illustration (by Dr. David Evans) begins with the increase in global temperature from a doubling (say 400ppm to 800 ppm) from “established science—1.1C. Then the warmer’s inferred amplification, will increase the temperature by 3 fold resulting in a final temperature increase of 3.3C. That is what the climate models produce and that is where the warmers get their scary scenarios.

Figure 1 Amplification:
From a posting by Dr. David Evans titled “The Skeptics Case” we get the following in response to the alleged amplification:
“The climate models predict a particular pattern of atmospheric warming during periods of global warming; the most prominent change they predict is a warming in the tropics about 10 km up, the “hotspot”.
The hotspot is the sign of the amplification in their theory (see Figure 1). The theory says the hotspot is caused by extra evaporation, and by extra water vapor pushing the warmer wetter lower troposphere up into volume previously occupied by cool dry air. The presence of a hotspot would indicate amplification is occurring, and vice versa.
We have been measuring atmospheric temperatures with weather balloons since the 1960s. Millions of weather balloons have built up a good picture of atmospheric temperatures over the last few decades, including the warming period from the late 70’s to the late 90’s. This important and pivotal data was not released publicly by the climate establishment until 2006, and then in an obscure place. Here it is:”
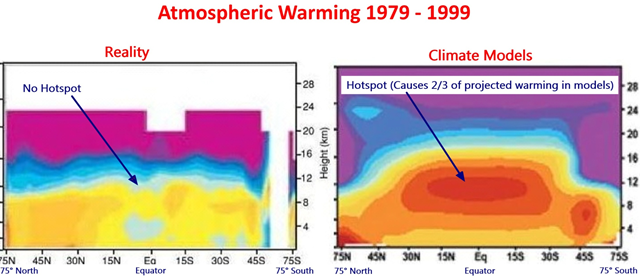
Figure 6: On the left is the data collected by millions of weather balloons. On the right is what the climate models say was happening. The theory (as per the climate models) is incompatible with the observations. In both diagrams the horizontal axis shows latitude, and the right vertical axis shows height in kilometers. (click on illustration to improve clarity.)
“In reality there was no hotspot, not even a small one. So in reality there is no amplification – the amplification shown in Figure 1 does not exist.”
Note that the period 1979-1999 was a time when Global temperatures increased. The CAGW theory was developed at this time as were the climate models that predicted the hotspot. The climate model’s predictions are trotted out to scare you to death about extremely high temperatures. The predictions are based upon an amplification which does not exist and thus they are WRONG. And all of the CAGW predictions, high sea level, severe weather, etc are based upon a false premise of extremely high global temperatures.
The most recently issued (version 5) UN Intergovernmental Panel on Climate Change (IPCC) report acknowledged that the three-fold amplification is too high and they are lowering it. I have not seen what their new multiplier is. While it is only a small, perhaps tentative step in the right direction, they are beginning to own up to the fact that actual measurements do not support their theory.
That CO2 can have an effect on global temperatures is acknowledged and perhaps the 1.1 C will happen with a doubling of atmospheric CO2. But the 18-year “pause” in Global temperature suggests that there are negative feedbacks (negative amplifications) that cancel out some part or all of the CO2 potential warming capability of 1.1C if atmospheric if CO2 is doubled to 800ppm. At the present rate of increase of atmospheric CO2 it will be a long, long time, if ever, for the 800ppm level to be reached. The scale is logarithmic so a doubling for the next increase of 1.1C would require that atmospheric CO2 reach 1600ppm.
cbdakota
