UN Says The US Is The Most Successful Major Country in Carbon Emissions Reduction


The UN released its global emissions and carbon report last month.  The U.S. is the most successful major country at mitigating its own pollution carbon dioxide (CO2).  So successful according to a Forbes posting written by Ellen Wald titled “The U.N. Says America Is Already Cutting So Much Carbon It Doesn’t Need the Paris Climate Accord”. 

“According to the report,

“The United States of America emits 13 per cent of global GHG emissions.” Comparatively, “China emits more than one-quarter of global GHG emissions.” The U.S. still contributes the most greenhouse gas emissions per capita in the world, but, over the last decade, the country’s GHG emissions have been in decline (0.4 per cent per year). “Greenhouse gas emissions per capita in the U.S. are dropping precipitously while those of China, India and Russia continue to rise. With the world’s most successful economy (over $21 trillion in 2019), it is not a surprise that the U.S. pollutes more per person, but the U.S. is making great strides in changing this.” 

The following chart is from the UN report showing total and per capita emissions:

President Trump withdrew from the Paris Agreement in 2017.

“In 2017, the White House said, that if it remained a part of that agreement, “compliance with the terms of the Paris Accord and the onerous energy restrictions it has placed on the United States could cost America as much as 2.7 million lost jobs by 2025 according to the National Economic Research Associates.” Instead, the U.S. continued decreasing its greenhouse gas emissions faster than any other major polluter, and it did so without the Paris agreement.”

Unfortunately, we know that the president elect, Joe Biden, wants to sign up again.  It may be too late to negate any signing even though the Paris Agreement appears to be a treaty which requires a 2/3 majority of the US Senate to approve it. The Senate is going to be controlled by the Democrats for the next two years.  Whether or not this is a treaty may not get resolved is a question.

The UN comment about the US not needing to join is frivolous. The Paris Agreement requires that the developed nations need to contribute $100billion every year to a fund for the under-developed nations to use to reduce CO2 emissions.  And you will not be surprised to know, that the biggest contributor to the fund is expected to be the US.  So far, I don’t believe the fund has  ever reached $100billion cumulatively, let alone annually.  The US has voluntarily contributed to the fund.  Why, I do not know.

So, the UN is desperate for the US to rejoin. 

cbdakota

More Pork For Renewable Energy


Hugh subsidies are lavished on wind and solar energy in a newly enacted Federal bill.  More pork for crony capitalism.  More high-priced electricity for the customers. 

The proponents of wind and solar energy say that subsides for fossil fuels and nuclear are bigger than those for these so-called renewable energy systems. Forbes posted “Why is solar energy getting 250 times more in Federal tax credits than nuclear “by Robert Bryce.  Bryce’s posting shows that this is not the case.

 “According to a December 21 estimate from the Joint Committee on Taxation, the extension of the solar sector’s investment tax credit (ITC) will cost the American treasury another $7 billion between now and 2030. (The ITC may also be used for offshore wind projects.) The extension of the wind industry’s production tax credit (PTC) — which like the ITC was supposed to be phased out — will cost another $1.7 billion. Those billions will be added to the $27 billion in ITC  credits that were already designated for the solar sector and $34 billion in PTC that will be collected by Big Wind between now and 2029. (Those last two numbers are from the Treasury Department.) “

“Given the tens of billions of dollars that are being lavished on solar, wind, and other politically popular energy programs — tax credits for fuel cells, carbon capture and sequestration, and “two-wheeled plug-in electric vehicles” also got extensions in the budget bill — I decided to seek an answer to a simple question: which energy technology gets the most in federal tax incentives? “

“The answer, by two country miles, is solar energy.

In 2018, the American solar industry got roughly 250 times as much in federal tax incentives as the nuclear sector, when compared by the amount of energy produced. Coming in a close second is the wind sector, which got about 160 times as much as nuclear. “

EJ = Exajoule   An exajoule is a measure of energy.  Exa is 10 to the 18th power. An exajoule is equal to 277.8 terawatt-hours

“In 2018, as shown in the graphic, America’s nuclear sector received about $13.1 million in tax incentives per EJ while the solar sector soaked up $3.3 billion per EJ – or 253 times the amount given to nuclear. The wind sector got $2 billion per EJ, or about 158 times as much as nuclear.

Congress is allocating yet more money for solar and wind even though America’s nuclear sector is producing about twice as much carbon-free electricity every year as wind and solar, combined. Despite its importance to America’s climate goals, the nuclear sector is foundering. Numerous reactors have closed over the past few years and more will be shuttered in the months and years ahead. In New York, the Unit Three reactor at Indian Point will be shuttered in April. In Illinois, Exelon EXC -1% is planning to shutter two nuclear plants. In California, the Diablo Canyon nuclear plant is slated for closure in 2025.” 

I recommend that you read Bryce’s full posting by clicking this link.

I am agnostic about carbon dioxide’s (CO2) role in climate change.  Theoretically it is a player but the positive feedback that is claimed for it, looks to be exaggerated. Especially when nature’s negative feedbacks are ignored. Moreover, nuclear energy appeals to me in that it satisfies my desire to have something that can be reliably making electricity for a long, long time into the future.  It will extend the availability of fossil fuels to make valuable products, not just heat—perhaps the Earth will make natural gas and oil at an equilibrium with the fossil fuels withdrawal. Who knows?

One would think that the Greens would welcome nuclear energy based upon their crusade to eliminate man-made CO2 emissions.  But they don’t.  And they say that their programs are science based?

cbdakota

The Paris Agreement Augments China’s Global Ambitions.


I am forwarding a posting by RealClear Energy titled “China’s Green NGO Climate Propaganda Enablers” with the following subtitle:
“Climate change is a national security threat – but not in the way the national security elite assumes.”

A quote from with in this posting sums up China’s objectives.
“China is a great power using global warming to advance its geopolitical interests. Unlike the Soviet Union’s sclerotic economy, China’s is far from a state of collapse. Indeed, China is likely to be the only major economy to emerge larger at the end of 2020 than at the beginning. For China, climate change offers a strategic opportunity. Decarbonizing the rest of the world makes China’s economy stronger – it weakens its rivals’ economies, reduces the cost of energy for its hydrocarbon-hungry economy, and sinks energy-poor India as a potential Indo-Pacific rival.”

By Rupert Darwall
December 21, 2020

Shortly before the Soviet Union collapsed, Greenpeace opened an office in Moscow. It enjoyed the patronage of a leading member of the Soviet Academy of Sciences and enjoyed Kremlin funding, laundered through a state-owned record company. The green activist group made clear that it would have nothing to do with environmental groups in the Baltic republics. Recycling standard Soviet propaganda, Greenpeace denounced them as little more than separatist organizations.

This was by no means a one-off. The inconvenient truth: the environmental movement fought on the wrong side of the Cold War. In the early 1980s, it used the “nuclear winter” scare to try to stop Ronald Reagan’s nuclear build-up and undermine the West’s ability to negotiate the arms agreement that effectively ended the Cold War. It turns out that nuclear winter had been concocted by the KGB and transmitted to America by executives of the Rockefeller Family Fund. A nuclear winter conference held in 1983 was supported by 31 environmental groups, including the Environmental Defense Fund, Friends of the Earth, and the Natural Resources Defense Council (NRDC).

This pattern, wherein the West’s enemies use the environmental movement – whether NGOs like Greenpeace, foundations, or “concerned scientists,” to undermine Western interests – is now being repeated, this time in respect to China. A report by Patricia Adams for the London-based Global Warming Policy Foundation released earlier this month lays bare the role of the green movement in acting as China’s propagandists.

Biden’s Energy Plans Are Setbacks For The US and Boosts For Our Enemies


If Biden does become President, he is likely to cause some serious setbacks for the USA and boosts for our enemies.  

Forbes posted “The Coming Energy Shocks Under A Biden Administration” that, based upon Biden’s campaign promises, are very disruptive.  I have selected parts of the posting, with some comments of my own, as follows:

“But don’t be lulled by soothing thoughts of policy continuity under a Biden-Harris administration. The contrast between Republican and Democratic world-views of fossil fuels and global energy geopolitics could not be more stark. And nowhere are the costs as extravagant as in the promises made regarding the Green New Deal. The adverse impacts on US domestic affairs will be as profound as they will be on the global stage. The policy discontinuity expected to take place in the oil and gas sectors under a Biden administration is about as radical as one can contemplate in US and global affairs.

The Biden Plan for a “100% clean energy economy [which] reaches net-zero emissions no later than 2050” will require his administration to sign in its own words “a series of new executive orders with unprecedented reach that go well beyond the Obama-Biden Administration platform and put us on the right track”. The 4-year, $1.7 trillion Biden plan – reflecting an even more aggressive “climate crisis” action plan set out by the House Democrats — includes banning fracking in federal lands and waters, denying federal permits for new fossil fuel infrastructure projects, and ensuring 100% clean renewable energy by 2035 in electricity generation, buildings, and transportation.”

Executive orders are band-aid measures that Presidents use to set policy for issues that can not gain Congress’ approval.  However, ambitious program such as net-zero and Green New Deal will require gun-shy Senators and Representatives to vote for the massive financing that those programs will require. Congress’ appetite for bravery has been in short supply in recent years.

Continue reading

Biden Green Plan Costs $1.7 trillion and Reduces Global Temp 0.1C


Let’s see how you answer this question—Yes,  No.

“It worth it for the American taxpayers to pay $1.7 trillion to lower the Earth’s temperature by 0.1C (0.18F) “

 If you answered YES, I dub you Captain “Gullible”.    Oh, by the way, maybe  you would like to buy some of my ocean front property in Arizona.

The $1.7 trillion is the cost estimate of Joe Biden’s planed phase out of fossil fuels in the US.  The Biden plan would lower the global temperature by 0.1C as calculated by the Alarmist’s Climate Action Tracker.

All of this comes from the pages of the UK Guardian newspaper. This newspaper is perhaps the world’s biggest media supporter of the climate change alarmism.  The stated cost and the results are Guardian’s bona fide.

My guess is that when 2050 arrives, there are three likely outcomes. 

Outcome A

The plan was dropped after it was clear that no apocalypse was going to happen.

The Alarmist’s computers that predict the future temperatures have been much higher than the actual temperature measurements.  The Alarmists are alarmists because they refuse to recognize the facts that their   computers are flawed.

See posting Michael Shellenberger Exposes Global Warming Alarmists”

Outcome B

The plan was dropped because it was too costly and that adaptation, if necessary, was deemed less costly.

Let’s assume that in 30 to 70 (2050 to 2100) years, sea levels rise several feet, mankind would have the capability to adapt to the change.  It would not happen overnight, but rather slowly over years.  And the odds are that equally good that it will not raise several feet. 

Outcome C

The plan was dropped when the West realized the Chinese were never planning to follow any carbon reduction program.  Consequently, China dominated the globes economy because their energy costs were vastly lower, and it was more reliable than the nations of the West’s energy.

Wind and Solar will be deemed failures.  They are unreliable and must be backed up. Currently, it is necessary to have fossil fuel-based production facilities that can supply the demand reliably.   During this time as more wind and solar are added, the price of electricity would “skyrocket” (as predicted by Former President Obama.)  China has world domination as their target.  The Biden plan will be a big help to the Chinese toward realization of their objective.   

Ultimately, nuclear energy-based electricity production will become the major source.  The alarmist does not want nuclear to succeed as they have seen it as a threat to imposition of wind and solar.

I see anyone of the three as likely to happen.  Maybe it will be all of them will be realized and that will cause the Biden plan to be dropped.   

And a commonsense addition—-  how many people are going to believe the stopping a global temperature rise of just 0.18F as worth S1.7trillion is worth it? Less that one fifth of one degree!  Or even necessary!

cbdakota

Solar Cells Are Not Able to Supply Daily Power Demand Alone


Our nation’s electricity is produced mainly by fossil fuels and nuclear energy.  The role played by renewables is relatively small, even though the public seems to believe it is greater.  This is probably because the media apparently wants the public to believe it is so.  The Chart 1 below is from the Energy Information Administration (eia), an arm of the Department of Energy:

                                                   CHART 1 

Wind and solar represent 9.1% of the sources of US electricity generation in 2019. 

The sources noted in the picture above feed their power output into systems called the grids.  These grids distribute the power to the users in their area. The grids do their utmost to be a source of uninterruptable electricity at a specific frequency.  This they do reliably. 

All of us have experienced a power loss at our home or business and you know how disruptive that is.  But most power losses we have experienced are almost always local disruptions, e.g.  wind, snow, lightning, power pole meets vehicle, transformer failure, etc. But not a grid failure.

The grids fine tunes their delivery of power, matching the increases and decreases of demand.  The grid operators dictate to the suppliers what is needed.  For example, the operators can use Nuclear and Coal based plants as a base load.  These two sources are predictable and steady suppliers but may not be able to quickly react to changes in demand.  The grid operator’s natural gas plants can adjust quickly to changes to prevent supply disruptions. Most businesses need electricity to be uninterrupted as downtime is costly.

Wind and solar are non-dispatchable because they are neither predictable nor steady suppliers of electricity. The wind driving the wind turbines can go from near gale force to calm very quickly.   Solar can do the same as cloud banks appear overhead.  The grid operator has no control over how much or how little the renewables are producing.  If renewables are supplying the grid, the operator must have backup capacity to prevent shutdown of the grid. By the way, grids are not capable of storage of electricity.

The following is from a posting by American Experiment titled “No State Imports More Electricity Than California” by Isaac Orr:

“The Chart 2 below is from Electricity Map, and it shows electricity generation by source on April 3, 2019 in California. The orange section represents solar, the blue hydroelectric, light blue, wind, green, nuclear, red natural gas, and the brown section is imported electricity.

                                                   Chart 2

As you can see, imports fall when it is sunny out, and increase again when the sun goes down. It just so happens that the sun was not shining when the demand for electricity in California was highest. California’s policies promoting renewables at the expense of dispatchable generation place it in an odd predicament, it must pay other states to take the excess electricity generated by renewables when their generation is high, and it must also pay other states for their power when renewable generation is low.”

From Chart 2, you can see solar cells negatives. 

 Solar cell production is not at its maximum at sunrise nor sunset.  It peaks around noon when the sun is directly overhead. The eia Chart 3 below shows typical electricity production in Los Angeles.   Using the gold curve, that assumes that the solar cell has tracking, at 3pm, the watts are about 550 Watts and at 7pm it is at zero.  At the peak demand midpoint, say 5 pm, it can only produce about 250 watts.  (This would be the output of a single solar cell.  However, it represents the rest of the solar cells.  The change in watts is equivalent to the percent reduction the entire solar cell farm would experience.)

                                             Chart 3

The energy production Chart3 would suggest that a solar cell is not a major contributor during peak demand.  That matches the illustrated Chart 2.

  • The greens imagine pairing solar cells and wind turbines producing energy for a grid.  In this case, regardless of the capacity of the solar cells, the wind must be able to produce all the power to satisfy the capacity rating of the location. Every day, after the sun sets, the wind turbines would have to match demand.  Solar cells can never support the daily capacity rating of the location. So why have them?

I am not a proponent of either wind turbines or solar cells.  Earlier in this posting I outlined the fact that they are not dispatchable.   Industry could not function with an unreliable energy supply.  Nor would the public accept it.  Brown outs and black outs are inevitable without a backup. 

Power Engineering posted “Study Says Renewable Power Still Reliant on Backup from Natural Gas” by Wayne Barber.   In this posting he covers a study by the Massachusetts-based National Bureau of Economic Research that stated:

“We show that a 1 percent increase in the share of fast-reacting fossil generation capacity is associated with a 0.88% percent increase in renewable in the long run,” the NBER authors say in the report.

cbdakota

Adding Renewables (wind and solar) Increase Energy Poverty


The Green New Deal requires that solar and wind electricity production replace electricity produced by fossil fuels and nuclear reactors. The challenges that face those two “renewable” energy sources seem to make this impractical if not impossible. 

There is another issue, beyond the improbability of wind and solar replacing fossil fuels.  That is energy poverty.  Families must decide between food or electricity because they have limited income.  I had never come across a study that attempts to quantify the numbers of families that are in energy poverty until recently.  Nature Research Journal posted a study titled “Recognition of and Response to energy poverty in the United States” by Dominic Bednar and Tony Reames.  (click on underline and then page up until you reach the study.)

It begins by saying:

“Stark disparities exist in US energy burdens, the percentage of household income spent on energy bills. Urban and rural low-income households (defined as 80% of area median income or 150% federal poverty level) spend roughly three times as much of their income on energy cost as compared to non-low-income households (7.2% and 9% versus 2.3% and 3.1%, respectively)1,2. Moreover, low-income, African American, Latinx, multifamily and renter households are disproportionately impacted by high energy burdens1. Out of a total of 118.2 million US households, in 2015, the US Energy Information Administration (EIA) estimated that 17 million households received an energy disconnect/delivery stop notice and 25 million households had to forgo food and medicine to pay energy bills3.” 

Further on, they report that:

“However, after nearly fifty years of federal energy assistance, one in three US households (37 million), still experience energy poverty3”.

The Obama Administrations aims were to make the cost of electricity “skyrocket”.

Former President Obama goes on to say that the increased costs of his plan will be passed on to the utility customers.  He wants the customers to understand this and to know it is being done because he thinks it is necessary. 

We agree that forcing out fossil fuels as the source of electrical energy and replacing fossil fuels using wind and solar renewable energy will cause the price of electricity to skyrocket.  The following chart shows what happens to the price of electricity in those nations that have begun replacing fossil fuels with renewables.   


Leading the EU nations in renewables is Germany and note that they have the highest cost of electricity.  There are already 37 million households suffering from energy poverty, the effect of doubling the price of electricity will be a calamity.

What is purposely unmentioned by the peddlers of wind and solar, is the fact that you really must keep the fossil fuel electrical producers running as back up. The wind does not always blow and the solar, on average, is never available for more than 12 hours and in fact cloudy or rainy or snowy days reduce the 12 hours sometimes to zero hours.

This often means that the fossil fuels facilities are never really replaced. They continue to operate to prevent loss (brownouts or blackouts) of electricity to the public, the hospitals, the schools, the manufacturing plants, etc.

cbdakota

Mayor’s, Governor’s, and Corporate Exe’s Green Virtue Signaling is Exposed.


When President Trump walked away from the Paris Agreement in 2017, Democrats, principally, around the US, were enraged.  They decided they would show the world that even without the support of the Trump Administration they were “woke” and would do the job without him.  Mayors, Governors and Corporate Executives rallied one another and began setting carbon dioxide reductions goals. Most of these goals contained the CO2 amounts and timelines.   I am reasonably confident that most of this crowd does not understand the real-world consequences of their actions.  I think they were motivated by politics.

The Brookings Institute, a liberal think tank, surveyed the top 100 cites to see how they were doing. On 22 October 2020, E&E News posted their take on the Brookings Institute survey titledU.S. cities struggling to meet lofty climate goals”.  They began by saying:

Most major U.S. cities that have signed on to the climate fight with pledges to cut greenhouse gas emissions are failing to meet their goals or haven’t even started to track local progress, according to a survey by the Brookings Institution.

The report, “Pledges and Progress,” looked for climate policy and actions in the nation’s 100 most populous cities, finding that two-thirds have made commitments to address citywide emissions.”

 The E&E News continues:

But the Brookings analysis found that actions taken by cities aren’t matching up with their pledges to address climate change.

Among the 100 largest cities, only 45 set specific targets for cutting greenhouse gas emissions during the past decade and inventoried emissions levels within city boundaries as baselines for measuring progress.

Twenty-two more cities have made general pledges to address emissions. But the Brookings analysis found they haven’t set emissions targets or inventoried current emissions levels.

“Half the cities aren’t doing anything,” said David Victor, co-chair of the Brookings Initiative on Energy and Climate.

Ok, you may be thinking that the corona virus is the reason.   E&E reports that Brookings does not think that is the major reason: 

“But roadblocks facing mayors in the climate campaign were obvious even before the coronavirus pushed the nation’s economy into a dramatic downturn.

The Brookings results point to the challenges faced by cities whose climate commitments diverge from policies at the state level. Another challenge for cities is the limits within which they operate. City governments can’t control everything that happens within their borders.

For example, when Pittsburgh inventoried greenhouse gas emissions in 2013, it estimated an annual citywide total of 4.8 million metric tons. Emissions from operations directly under City Hall control came to just 115,069 metric tons. The city government plans more reductions in part by buying refuse trucks that run on lower emission compressed natural gas. Its Parking Authority is teaming with Duquesne Light Co. to bring 16 new electric vehicle chargers to city parking lots.

These are marginal changes in a city and county with nearly 694,000 registered passenger vehicles. Most of them run on gasoline engines that pump out carbon emissions.”

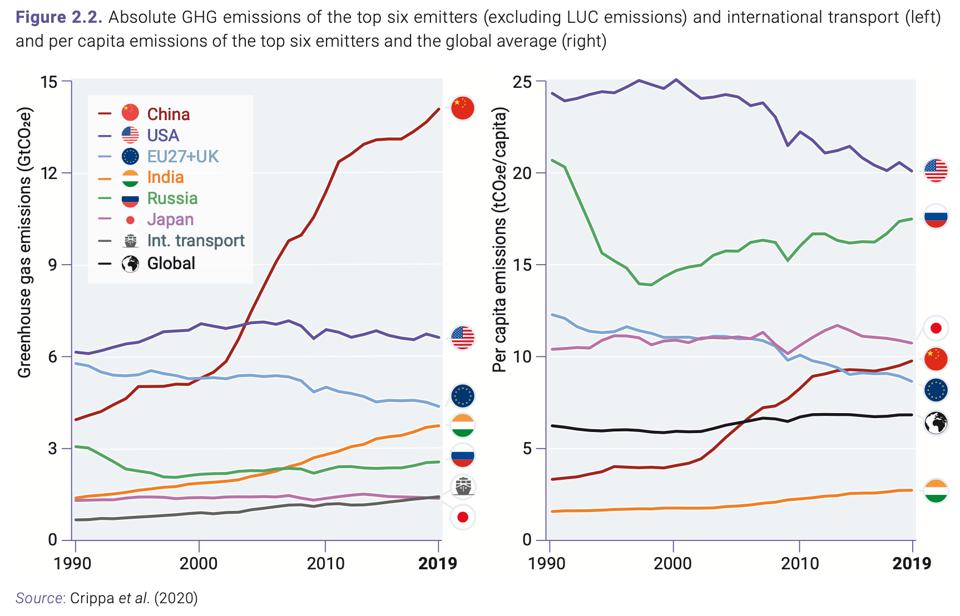
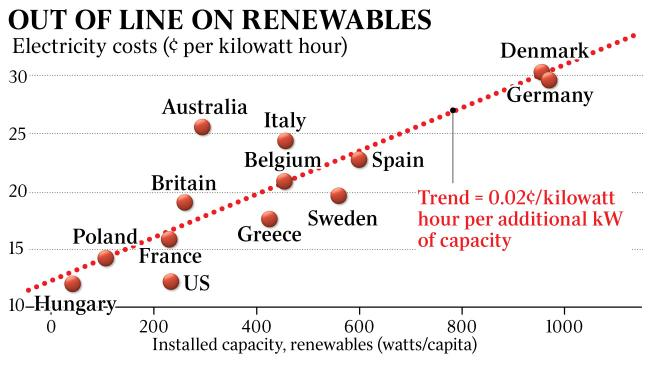
The Paris Agreement is the Green’s framework for reducing CO2 and the timeline for reaching their goal of preventing the global temperature from ever rising more than 0.5C over the current global temperature,  I sure you have heard that the world is all in step with this goal, except for the US, of course. Well they are not.  First of all, the nation that leads in emissions of CO2 is China.  And by agreement with then President Obama, they do not need to start to reduce their emissions before 2030.  By then they will probably be emitting twice as much CO2 as the US.  Further, India, the number 3 CO2 emitter has no plans to stop increasing their emissions.

China has a political move going called the Belt and Road Initiative.  The less developed nations in south east Asia, for example want to improve their citizens lives by providing electricity.   The World Bank bans making loans to these countries as the Bank, taking guidance from the UN does not want them to put in coal plants.  But China is loaning them the money.  This raises China’s political standing in these nations.  More than 1,600 coal plants are scheduled to be built by Chinese corporations in over 62 countries and that will make China the world’s primary provider of high-efficiency, low-emission technology.

And quoting from a posting by the Global Warming Policy Forum, titled “New Coal War: China and Japan Compete For Hundreds Of New Coal Plants in Southeast Asia” we get this:

But Japan is not exactly twiddling its thumbs, either. Since the 2011 Fukushima disaster, Tokyo has ramped up coal use and has raced ahead in clean coal technology development. Japan now boasts the world’s most efficient coal-fired plant, which uses less coal to produce more electricity. Seizing on this competitive advantage, Japanese Prime Minister Shinzo Abe has tried to capitalize on these capabilities in a bid to increase Japan’s reach across Southeast Asia – and in China’s backyard. Through the Japan-led Asian Development Bank, Tokyo has pledged US$6.1 billion for projects throughout the Mekong as well as for various other projects from Vietnam to Myanmar, providing an alternative to China’s regional designs.

A coal plant can be made more efficient, but don’t kid yourself into thinking that this makes them close to the much lower CO2 emissions created by a natural gas-based facility.

And do not think the European Nations are still on board with the Paris Agreement.  The EU leadership in Brussels are deeply into this the Paris Agreement, but most of the Nations have not even met their meager 2020 commitments. Each year the required commitments become much greater, too.   And the nominal leader of the EU, German politicos are not getting much support from their industries. They see themselves becoming non-competitive with China and all these developing nations.  Their auto industry sees themselves even becoming non-competitive in the US market.

Former President Obama also committed to be the big sugar-daddy for the Paris Agreement fund to give money to the underdeveloped nations to hold down production of CO2  Each year the developed nations are to pay $100 billion to the fund.  This as I have noted is not a once and done fund, it is to be refunded each year.  So, assuming that the Trump administration are not playing nice with the Paris Agreement, those Mayors and Governors and Corporate Exes are going to have pay at least $5 billion every year.  And get this, China is not obligation to put money into this fund because they are said to be a developing nation.  Meaning China can draw money from the fund for their own use.

cbdakota

Are Our Political Leadership Ignorant Of Global Warming Science?


Is the inherent ignorance of global warming science in our political leadership leading us over the cliff?  A posting on WattsUpWithThat by Dr Tim Ball tells us that, with the exception of President Trump, these leaders are weak, ignorant, and pandering  .  Ball’s views are as follows:

World Leaders’ Ignorance About Climate Change Continues Despite Simple, Obvious Evidence.

 Guest Blogger / May 18, 2019 Guest opinion Dr. Tim Ball “

To be able to fill leisure intelligently is the last product of civilization.” Arnold Toynbee

Until Trump, and very obviously with his exception, weak, ignorant, pandering, people lead the western nations. They want leadership positions but with no intention of doing the job, or, for that matter, any talent to do it. We are a long way from Toynbee’s “last product of civilization.” Worse, we are moving further away every day. What can you say about America, supposedly the most advanced civilization in the world, with a regular TV program about 600-pound people in prime time? Is that filling leisure intelligently? What can you conclude about western leaders listening to and, worse, heeding Swedish teenager, Greta Thuneberg about climate change who claims she can see carbon dioxide in the air? This skill may be because she is a 16- year old child who, regrettably, has Obsessive Compulsive Disorder (OCD) and Asperger’s Syndrome. We know this because her mother, who needs for child abuse, told us so in the family book ‘Scenes from the heart. Our life for the climate.’ Historically, it was a child who pointed out that the emperor had no clothes. Now the ill-informed, used and abused, children are pointing out the emperor is wearing a cloak of green.

None of this is surprising as the world moves past madness into insanity. A US Senator, Elizabeth Warren, is running for President. This after admitting she claimed a nonexistent native heritage to jump the line at Harvard Law School and to get called to the Bar. There is another Senator also a lawyer, Richard Blumenthal, sitting on the Judiciary Committee where he cynically sits in judgment of other people’s truth and credibility. He claimed involvement in live combat in Vietnam when he was never even in the country. How can such exposed and admitted liars continue to retain positions of power?

Sadly, it is easy, have you watched debates and proceedings in any legislative body from the US Congress, through the British Parliament and beyond. It is a zoo of childish one-upmanship and petty name-calling, but what makes it worse is they think it is clever. No wonder the ratings of all such bodies are so low.

The major reason for the problem of poor leadership is that natural leaders, who are born, not nurtured, know the populace is not ready to be led. They also know that anybody who steps forward to lead immediately becomes the target of a media who believes its divine function is to destroy anybody and everybody. Understandably, they are not prepared to put their heads on the media chopping block. The impact on society is more than the loss leadership. This creates a vacuum that is almost immediately filled by people who want to lead but have nothing but ambition. These people want the job but lack the skills. They say whatever you want to hear or what they think you want to hear. The sincerity is as thin as the ability. Most of these are the people that Daniel Boorstin identified as being famous for being famous. They are so shallow that they are more vulnerable than most to misinformation and false stories that can become the basis of a political campaign. The biggest of these is the human-caused climate change issue. They, along with everybody else, didn’t understand it, but they deliberately exploited it. Everybody thought climate change was a problem, they didn’t care because it was a superb political opportunity.

A Yale University test on climate titled “American’s Knowledge of Climate Change” proved it. The test was designed to find out

from a national study of what Americans understand about how the climate system works, and the causes, impacts, and potential solutions to global warming.

The test given to 2030 American adults resulted in catastrophic results. A full 77% of them achieved a grade of only D or F (52%). I know from 50 years of talking to and dealing with politicians at all levels that their knowledge is as bad. In one way it is worse because politicians take stronger, more definitive positions that preclude an open mind.

Continue reading

Solar Cycle 24 Ends-Solar Cycle 25 Begins


The government science agencies, NOAA and NASA determined that Solar Cycle 24 ended November 17, 2019 and Solar Cycle 25 began.  Solar Cycle 24 was the least active cycle in 100 years. There are several ways to express solar activity, but sunspot counting is the most frequently used method.  Solar Cycle 24 smoothed maximum count was 116.4 in April 2014.  The highest unsmoothed count was 146.1 in February 2014.  The smoothed count is the official number.  It is smoothed over 13 months. Six months before and six months after.  The smoothed count method is detailed at the end of this posting if you are curious.

The consensus of the experts regarding the predicted count of Cycle 25, at maximum, will be 115.  This prediction came from the Solar Cycle 25 Prediction  Panel made up international experts  according to PhysOrg posting .  In my May 2020 posting of a summary of expert’s predictions, NASA predicted that Cycle 25 would be the least active Cycle for 200 years.  NOAA however, predicted it would be more active than Solar Cycle 24.

The following chart compares Cycles 23, 24 and the predicted Cycle 25:

Some say that you can tell how active a cycle will be by the early formation of sunspots.  Lots of sunspots right away would mean an active cycle.  And conversely, slow development of sunspots would likely be the opposite. If that is true, perhaps you can make a prediction from the following chart courtesy of Solen info solar :


Virtually everything on this chart is Cycle 24.  This chart’s info box is probably very hard to read.  So let me describe the lines to you.  The dashed lines are the smoothed sunspot numbers.  The blue dashed line is the sum of the smoothed sunspots in the Northern and Southern solar polar fields. You can probably see that the blue dashed line crosses the solar max (the vertical red line) where the smoothed sunspots are at about 116.  But to make our predictions, we need to actually unsmoothed monthly sunspot reading.  That is the brown line. Here again this line is the sum of the Northern and Southern solar polar field sunspots.  In February, 2014, the monthly max of 146 was registered. Those numbers, 116 and 146, are the ones noted in the opening of this posting.

Comparing the brown line peak at 9 months after Solar Cycle 24 began, it looks like it is about a monthly 7 sunspots.  Doing the same for Cycle 25, at 9 months it looks like a monthly sunspot count of 7.  That would suggest to me that perhaps those that say 24 and 25 are going to be the same, may be right. But I would not make a bet on that.

As Yogi Berra, the Hall of Fame Baseball player, was alleged to have said, “It’s tough to make predictions, especially about the future.

cbdakota

Smoothed Count Method.

The smoothed count is a 13-month averaged sunspot count using this Belgium’s formula:
Rs= (0.5 Rm-6 + Rm-5 + Rm-4 + Rm-3 + Rm-2 + Rm-1 + Rm + Rm+1 + Rm+2 + Rm+3 + Rm+4 + Rm+5 + 0.5 Rm+6 ) / 12
Rs = smoothed monthly sunspot count
Rm = One month’s actual sunspot count
The “-6” through “+6” appended to each Rm is the number of months before or after the month whose smoothed count is being calculated. The beginning and ending months in the formula are only given half the value of the others.*