Forbes.com posting “Sun Flatlining Into Grand Minimum, Says Solar Physicist on JANUARY 20, 2014. Yes, the posting is nearly two years old. But the  discordance about the Sun’s influence in the Earth’s climate could not be more evident in the posting.
From the posting:
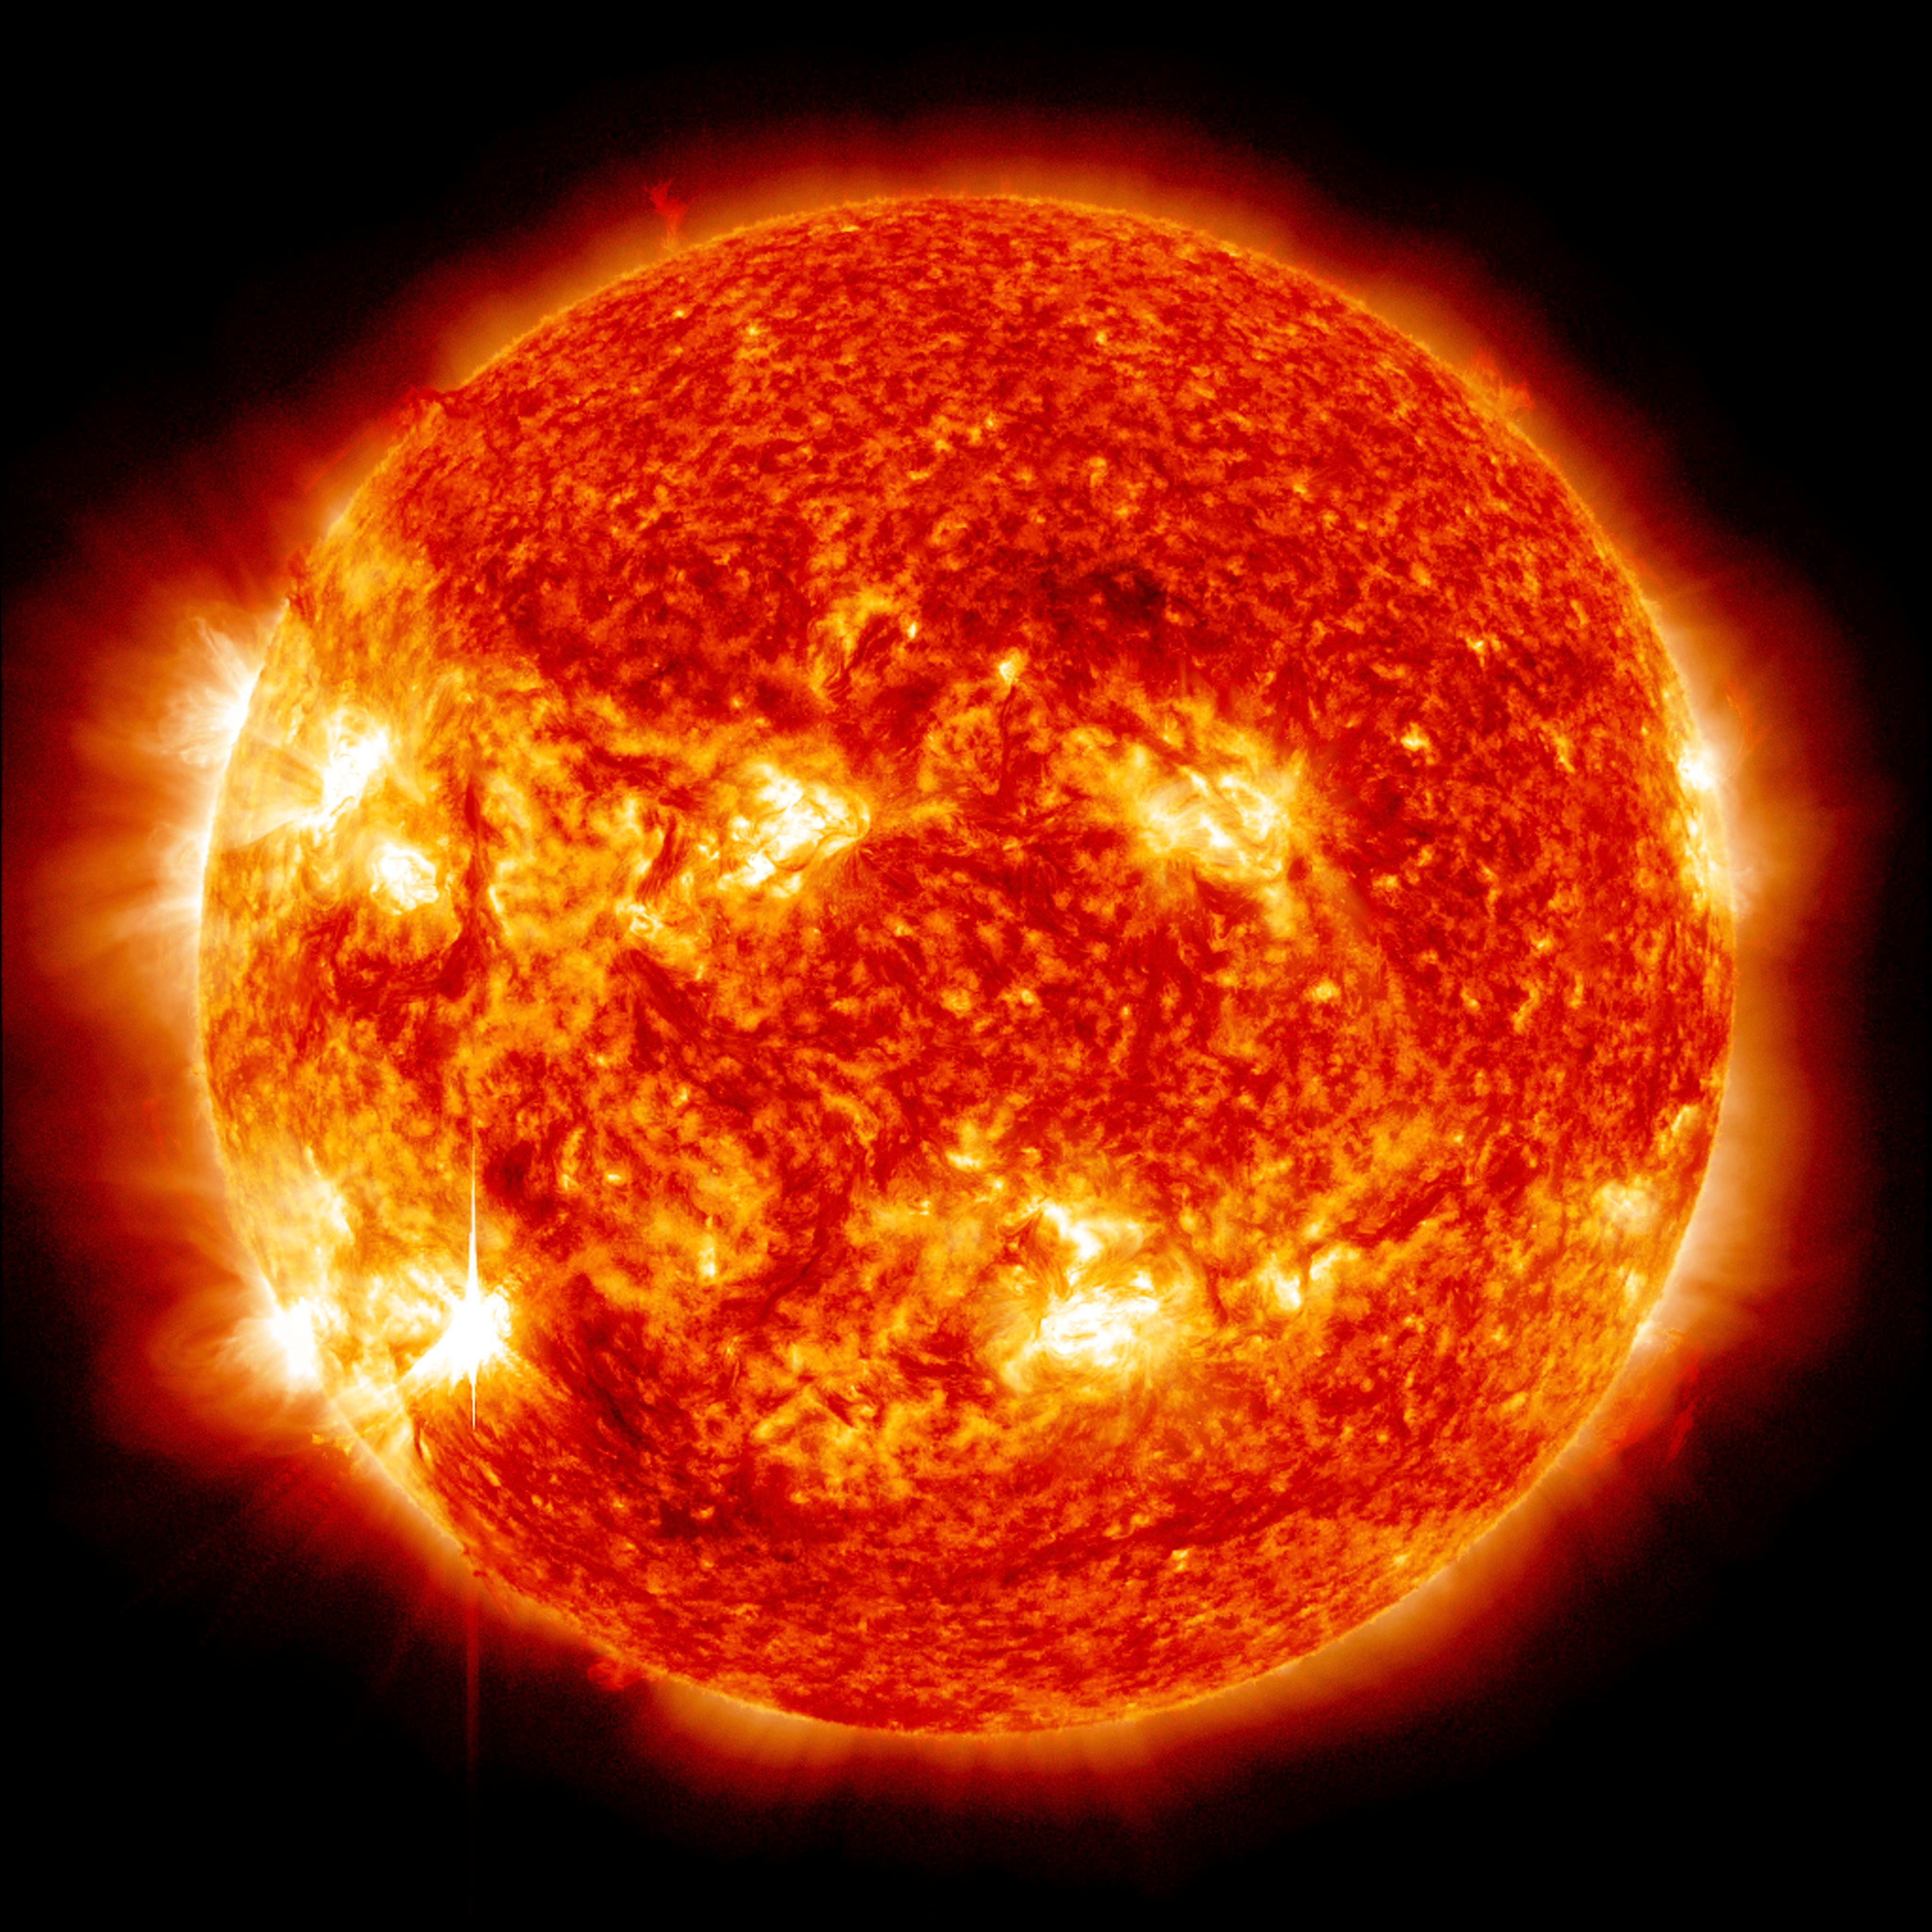
““My opinion is that we are heading into a Maunder Minimum,” said Mark Giampapa, a solar physicist at the National Solar Observatory (NSO) in Tucson, Arizona. “I’m seeing a continuation in the decline of the sunspots’ mean magnetic field strengths and a weakening of the polar magnetic fields and subsurface flows.”