
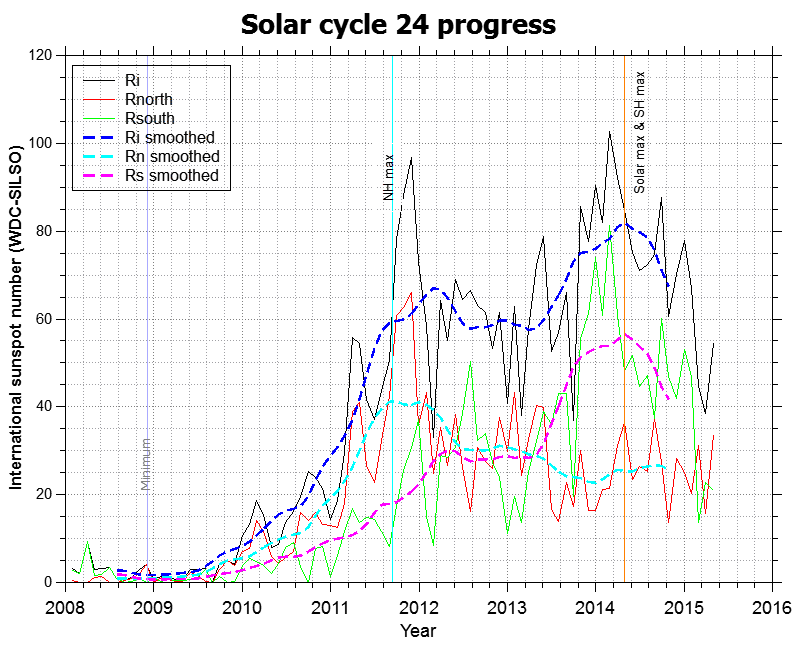
The April 2015 Solar Cycle 24 Sunspot number rose somewhat in April, but the forecast is for a continued decline in activity. The 2015 monthly Sunspot counts were: January = 67.0, February=44.8, March=38.4 and April=54.4. The daily Sunspot counts seesawed, but definitely with a downward trend, Ri(black). This can be seen be examining Rsouth (green). While Rnorth has been reasonably quiet for a year or so, Rsouth has been the major contributor to the total number since late 2013.
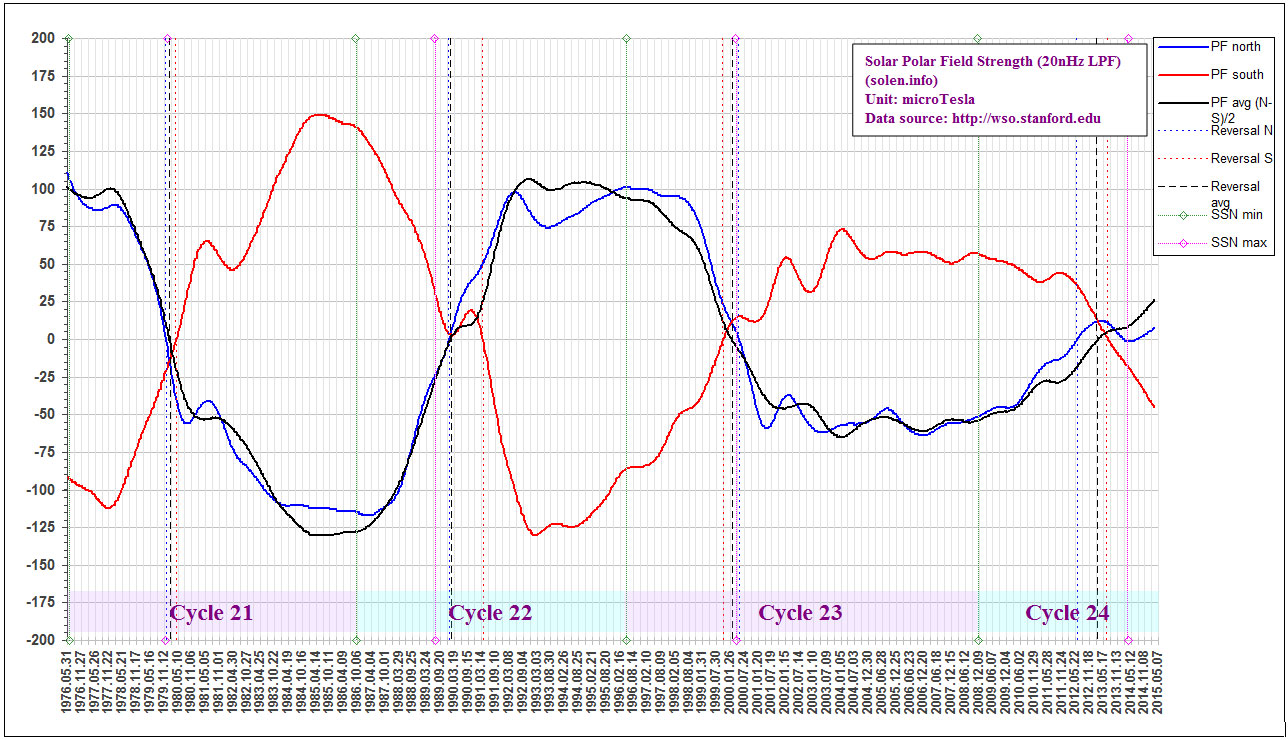
The maximum Sunspot activity occurs as the north and the south solar polar fields cross the 0 line. The solar scientists call the “maximum” for each Solar Cycle based on the solar field swap. The lower activity of Cycle 24 before the crossing the 0 line in apparent in the graph below:
A comparison of Solar Cycles 23 and 24 is shown below.
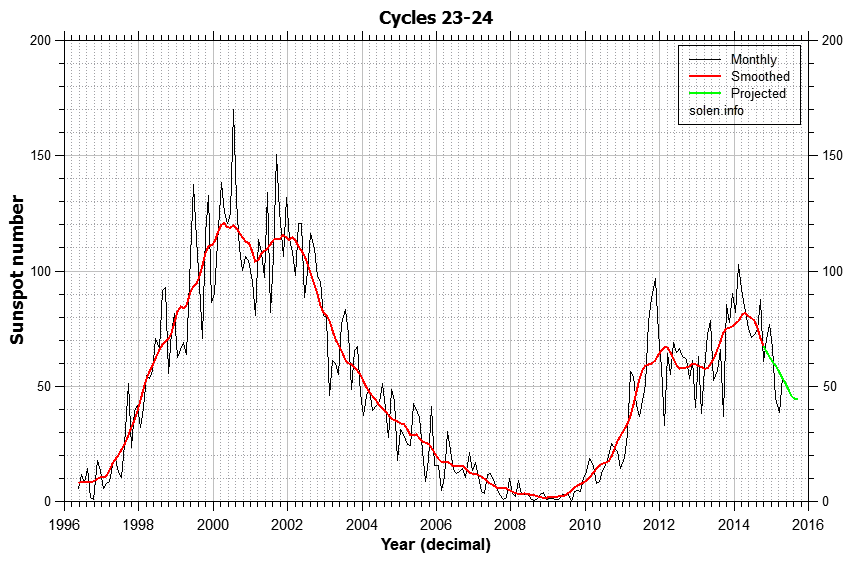
The green line is the projection for the smoothed International Sunspot Number.
All charts are by Solen.info.
cbdakota
