
Joe Bastardi, Chief Forecaster at WeatherBell Analytics LLC says that the EPA has based the Administration’s energy policy on three easily disproven assumptions. In Bastardi’s posting “Evidence That Demands A Verdict” he list the following:
There are three lines of evidence the EPA uses to back their environmental policies.
- Greenhouse Gas Trapping Hot Spot Theory.
- The so-called unusual rise in GAST (Globally Averaged Surface Temperatures).
- Assumed validity of climate models, used for policy analysis purposes. (See, for example, SOUTHEASTERN LEGAL FOUNDATION, INC., ET AL., Petitioners, v. ENVIRONMENTAL PROTECTION AGENCY, ET AL. Nos. 12-1268, 12-1269, 12-1272.)
In prior postings, I have discussed these points but Bastardi provides a nice summary of the three in one place.
Greenhouse Gas Trapping
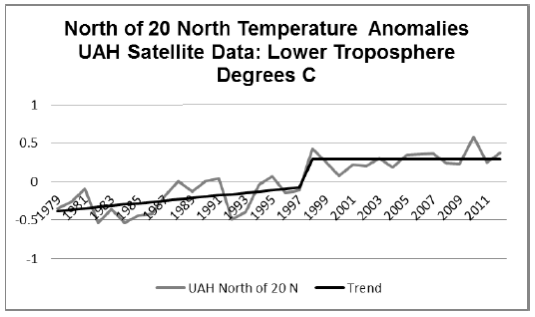
The first of the three comes from the warmers contention that a hot spot would occur in the tropical atmosphere. This has been proven to not exist time and again based on weather balloons and satellite temperature measurements. Bastardi provides the following charts to illustrate the lack of a hot spot.
In fact, temperature trends in the middle and upper troposphere are flat. For example, a look at the 200 mb level from the Hadley Center Balloon Data shows no rise at all.
 The entire layer — the surface to 18km — shows no rise.

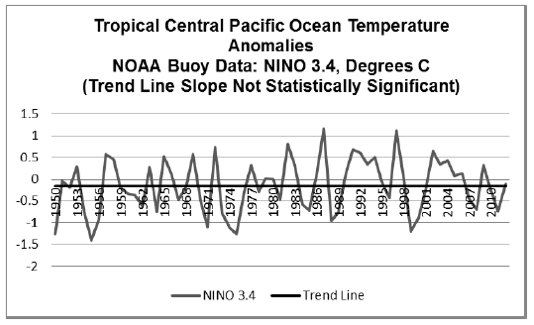
The figure below shows the Tropical Central Pacific Temperatures. Similarly, it shows no statistically significant slope. There is simply no evidence of EPA’s assumed Tropical Hot Spot.
Unusual rise in GAST
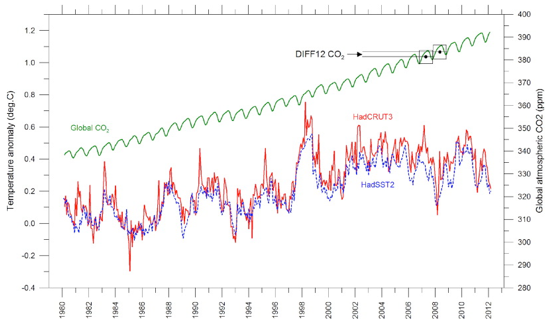
Their second line of evidence of a catastrophic rise in Globally Averaged Surface Temperatures (GAST) in the last 50 years due to CO2 concentrations is easily debunked when one looks at reality.
The disconnect with CO2 can be seen here:
Assumed validity of climate models
This is almost laughable. Anyone who works in the field every day — as we do in the private sector — knows how bad models can be.
One picture destroys the whole premise. Dr. John Christy, who testified before Congress on this matter, has put this graph together: (The Y axis is the temperature anomaly in degrees C.)
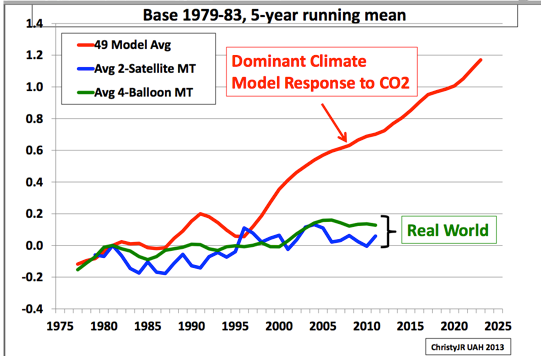
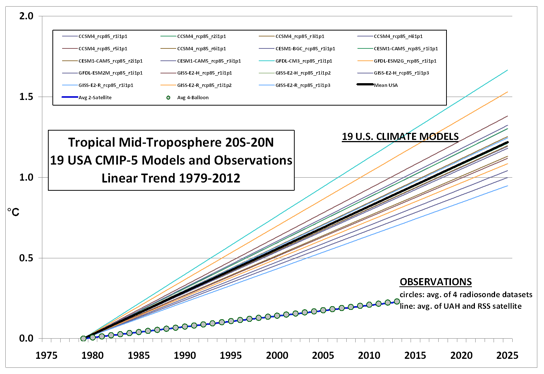
The following graph from Dr. Roy Spencer is even more dramatic. While Dr. Christy shows the average, Dr. Spencer shows how the individual predictions of 19 US models are all well above actual observations. And the EPA is trying to base policy on this?
Why anyone would think they could justify EPA’s regulatory plans or suggest a carbon tax as an alternative given the facts presented above is beyond me.
The facts clearly reveal that the EPA and the president do not have a leg to stand on as their policies assault the very energy lifeline of our economy at this critical time in our nation’s history. The EPA’s decisions are based on erroneous ideas. Quite sinister is the fact that the foundational core values of this country — the encouragement of liberal free thinking, competition and tolerance — are all opposite of what the EPA and this president are doing in regards to climate change. Their policy is to shut down exposure to the facts, destroy the chance to compete in a free and vibrant market, and not tolerate any dissent.
cbdakota

Pingback: These items caught my eye – 25 July 2013 | grumpydenier
Good stuff
Pingback: GISS Directors (Hansen and Schmidt) Are Marvelous Communicators? | Climate Change Sanity