
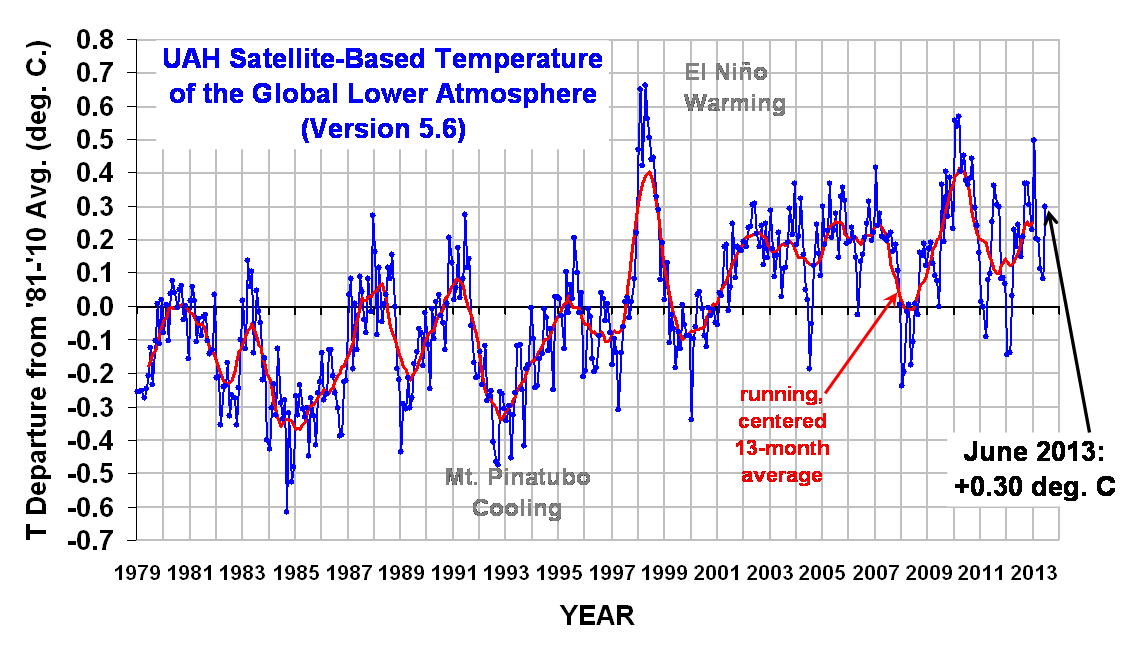
The UAH satellite June 2013 global temperature anomaly increased 0.2°C over the May anomaly. The Northern Hemisphere anomaly was up as would be expected as summer is underway and it is similar to the anomaly 12 months ago. The big jump was in the Southern Hemisphere that seems odd in that it is winter there. Remember, what is significant is the long term trend.
YR MON GLOBAL NH SH TROPICS
2012 1 -0.145 -0.088 -0.203 -0.245
2012 2 -0.140 -0.016 -0.263 -0.326
2012 3 +0.033 +0.064 +0.002 -0.238
2012 4 +0.230 +0.346 +0.114 -0.251
2012 5 +0.178 +0.338 +0.018 -0.102
2012 6 +0.244 +0.378 +0.111 -0.016
2012 7 +0.149 +0.263 +0.035 +0.146
2012 8 +0.210 +0.195 +0.225 +0.069
2012 9 +0.369 +0.376 +0.361 +0.174
2012 10 +0.367 +0.326 +0.409 +0.155
2012 11 +0.305 +0.319 +0.292 +0.209
012 12 +0.229 +0.153 +0.305 +0.199
2013 1 +0.497 +0.512 +0.481 +0.387
2013 2 +0.203 +0.372 +0.034 +0.195
2013 3 +0.200 +0.333 +0.068 +0.243
2013 4 +0.114 +0.128 +0.101 +0.165
2013 5 +0.083 +0.180 -0.015 +0.112
2013 6 +0.298 +0.337 +0.259 +0.221
Satellite Temperature Anomalies, °C
cbdakota
