
Science” magazine published the Marcott,et al, paper that purported to show a look at 11,300 years of global temperatures. The temperature curve drawn for the data shows temperatures rising and reaching a peak about 10,000 years ago. The temperature remained steady for some 6000 years after which it began dropping. About 100 years ago, it reached a low point that was lower than the temperature at the beginning of the period illustrated. Then it hockey sticked, going about straight up, exceeding any temperature on the chart through its entire 11,300 years. This, many took to be conclusive proof that we were experiencing something that had never been seen before and it was all caused by CO2 that resulted from the burning of fossil fuels. On March 7, the Associated Press said:
“Rapid” head spike unlike anything in 11,000 years. Research released Thursday in the journal Science uses fossils of tiny marine organisms to reconstruct global temperatures …. It shows how the globe for several thousands of years was cooling until an unprecedented reversal in the 20th century.
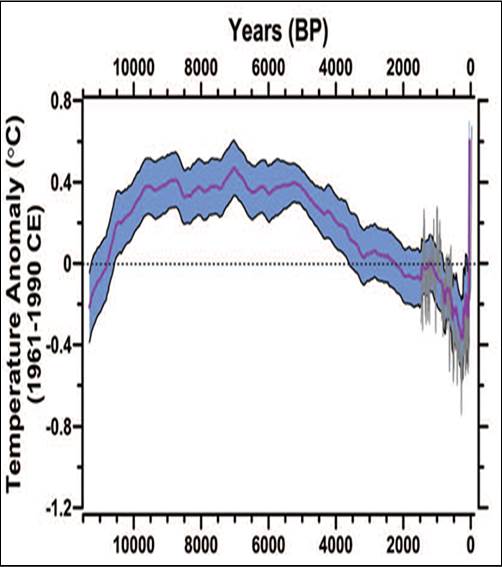
“Wow”, the Alarmist said, then they said it shows that our theory is correct and it also shows that Michael Mann’s hockey stick was correct. The Marcott, et al chart is shown below.
It was all going well for the Alarmists until that dastardly guy (sarc), Steve McIntyre, at Climate Audit and others began to dig into the data. Then it seems things began to unravel.
Ross McKitrick, in his posting in the Financial Post “We are not screwed”, explains that the U shape of the chart is pretty typical of many other charts that have attempted to describe global temperatures over periods as lengthly as the Marcott chart. McKitrick say that many other such reconstructions had shown the Roman warm period 2000 years ago and the medieval warm period about a thousand years ago. But here comes an important point where McKitrick says:
“But the Marcott et al. graph didn’t have these wiggles, instead it showed only a modest mid-Holocene warming and a smooth decline to the late 1800s. This was odd, but probably unimportant, since they also acknowledged using so-called “low frequency” proxies that do not pick up fluctuations on time scales shorter than 300 years. The differences between the scale of their graph and that of others could probably be chalked up to different methods.” (My highlighting of the original text.)
The proxys being “low frequency” don’t show fluctuations over periods less than 300 years, so where did the vertical line come from in the chart above? The solving of this riddle is summarized in McKitrick’s posting. Now the Marcott, et al , faced with trying to prove the unprovable, comes clean. A Q&A in “Real Climate”they said in answer to the question:
What do paleotemperature reconstructions show about the temperature of the last 100 years?”
the Authors reply:
“However, in the paper we make the point that this particular feature is of shorter duration than the inherent smoothing in our statistical averaging procedure, and that it is based on only a few available paleo-reconstructions of the type we used. Thus, the 20th century portion of our paleotemperature stack is not statistically robust, cannot be considered representative of global temperature changes, and therefore is not the basis of any of our conclusions.“
That should take the wind out of the sails of those who had believed they had the proof. But those with the most to lose if their gravy train is derailed, will continue to try to show that it is the “real deal”. Many of them are still trying to convince people the the Mann Hockey Stick of the last century is valid.
cbdakota

Nice Blog, thanks for sharing this kind of information.
Pingback: Sixty Narcissists Declare Themselves Above Debating the World’s Top Climate Scientists – barbaramckenzie