Category Archives: Energy Development

Pew Research Report Data Not Supported By The Interviews. Human Caused CO2 Claimed To Be 48% But In Reality Is 31%


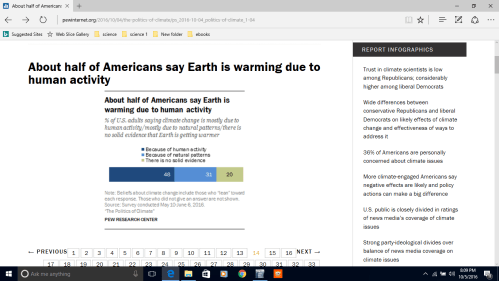
Pew Research Center has just released a survey of American’s opinions about global warming. They interviewed about 1500 people over a period from 10 May to 6 June this year. There are many findings but the one I want to take issue with is their claim that about half of the American’s interviewed say Earth is warming due to human activity. From the Pew Research Center survey the chart displayed says that 48% believe Earth is warming because of human activity, 31% because of natural patterns and 20% say there is no solid evidence that Earth is getting warmer.

2016-10-05-3

The Pew document presents the results of the interviews. The above conclusion was made from the following interviews:

2016-10-05


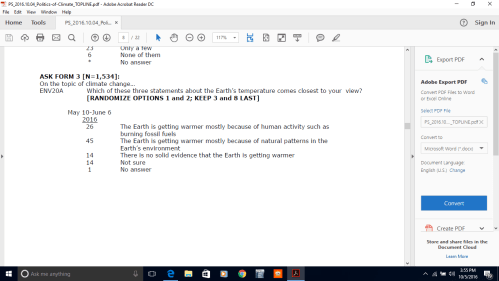
Above is the first interview results. Only 26% said global warming is caused by human activity. Wow that would not do. I guess they were saying “how can we fix this. We can’t publish this.” So they came up with a plan.

Some of the interviewed said they were not sure or had no answer. So they decided to re-interview these people to see which of the three statements would be their second choice. Now there were 1534 interviewees in the beginning. Thus the “not sures” and the “no answers” would be 0.15X1534=230 people. In the next chart it appears that they only re-interviewed only 156 of the 230. Below are the results of the re-interview.

2016-10-05-1

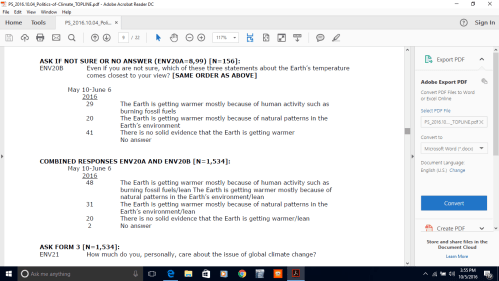
The results of the re-interview is that 29% said their second choice would be human caused warming, 20% said the warming was natural and 41% there was no evidence that the world is getting warmer.

Now comes the magic. You can see it in the bottom part of the above chart where it says the “combined responses” gave a new set of percentages for each of the three possible answers. However the answer for one of the three changed. It now includes both human caused and natural caused warming even though there still is a natural caused warming category.

I have gone through the math. The “human caused” in the first interview was 26% or 398 people. The “natural” was 45% or 690 people. “No evidence” was 14% or 215 people. As noted above the number re interviewed was 156 although the percentage would have called for 230. Note also that the percentage listed in the chart is only 90% or 140 people. The bottom line for people actually giving an opinion looks to be 1443 rather than the 1534 they began with. But the discrepancies in total number make little difference to the outcome. The human caused would be 398 original people plus 45 of the re interviewed for a total of 443 representing the share of the total 31%. Natural 690 plus 31 for a total of 721 and 50%. No evidence came in with 215 plus 64 for 279 and 19%. So only 31% said warming was human caused.

Obviously the surveyors could not let the initial result stand—–only 26% thought warming in human caused. So they came up with a way to obscure the results.

I have plowed through the rest of the interview material. It is obvious that most of the people have little concept of the issues surrounding renewable fuels/renewable energy.

2016-10-05-6

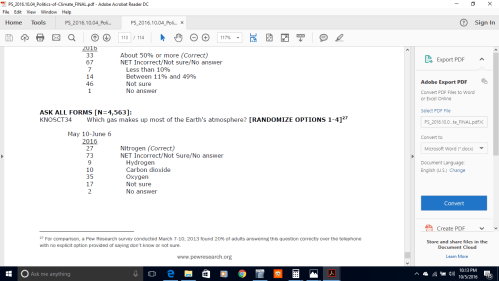
Their level of the science knowledge is probably pretty well summed up by the interview question shown above where they were asked to name the major gas that makes up our atmosphere. Seventy-three per cent did not know the answer. I would hazard a guess that most of our politician would do no better on that question.

If you want to look in detail at the full report and the interviews click here and then click on “Complete Report PDf

cbdakota

UK Scientist Doubts Decarbonization by 2050 Is Possible. Thinks Other Unfunded Threats Are More Compelling.


M J Kelly, Electrical Engineering Division Department of Engineering, Universtiy of Cambridge has written “Lessons from Technology Development for Energy and Sustainability” and posted on the  Cambridge Journals on Line.

The following is the Abstract from his posting where he sets up the quandary that faces the organizations wishing to decarbonize the planet by 2050.

There are lessons from recent history of technology introductions which should not be forgotten when considering alternative energy technologies for carbon dioxide emission reductions.

The growth of the ecological footprint of a human population about to increase from 7B now to 9B in 2050 raises serious concerns about how to live both more efficiently and with less permanent impacts on the finite world. One present focus is the future of our climate, where the level of concern has prompted actions across the world in mitigation of the emissions of CO2. An examination of successful and failed introductions of technology over the last 200 years generates several lessons that should be kept in mind as we proceed to 80% decarbonize the world economy by 2050. I will argue that all the actions taken together until now to reduce our emissions of carbon dioxide will not achieve a serious reduction, and in some cases, they will actually make matters worse. In practice, the scale and the different specific engineering challenges of the decarbonization project are without precedent in human history. This means that any new technology introductions need to be able to meet the huge implied capabilities. An altogether more sophisticated public debate is urgently needed on appropriate actions that (i) considers the full range of threats to humanity, and (ii) weighs more carefully both the upsides and downsides of taking any action, and of not taking that action.


M J Kelly discusses this issue at length in his posting and I suggest you read it in its entirety . This posting will look at conclusions and some suggestions Kelly derives when he examined the current  programs to reduce CO2. He’s not optimistic that decarbonization has much of a chance of accomplishing what the greens want. In fact he thinks the money could be spend better on addressing more immediate threats than those posed by the so-call catastrophic global warming. Here he summarizes his thoughts:

It is surely time to review the current direction of the decarbonization project which can be assumed to start in about 1990, the reference point from which carbon dioxide emission reductions are measured. No serious inroads have been made into the lion’s share of energy that is fossil fuel based. Some moves represent total madness. The closure of all but one of the aluminium smelters that used gas-fired electricity in the UK (because of rising electricity costs from the green tariffs that are over and above any global background fossil fuel energy costs) reduces our nation’s carbon dioxide emissions. 62 However, the aluminium is now imported from China where it is made with more primitive coal-based sources of energy, making the global problem of emissions worse! While the UK prides itself in reducing indigenous carbon dioxide emissions by 20% since 1990, the attribution of carbon emissions by end use shows a 20% increase over the same period.

Interestingly, he talks about the UK exporting manufacturing to other nations in order to reduce CO2 emissions.  Then the goods from these nations come back to the UK made in less efficient factories and the attributed CO2 result in an increase in the UK net emissions.     

It is also clear that we must de-risk all energy infrastructure projects over the  next two decades. While the level of uncertainty remains high, the ‘insurance policy’ justification of urgent large-scale intervention is untenable, and we do not pay premiums if we would go bankrupt as a consequence. Certain things we do not insure against, such as a potential future mega-tsunami, 64 or a supervolcano, 65 or indeed a meteor strike, even though there have been over 20 of these since 2000 with the local power of the Hiroshima bomb! 66 Using a significant fraction of the global GDP to possibly capture the benefits of a possibly less troublesome future climate leaves more urgent actions not undertaken.

Two important points remain. The first is that there is no alternative to business as usual carrying on, with one caveat expressed in the following paragraph. Since energy use has a cost, it is normal business practice to minimize energy use, by increasing energy efficiency (see especially the recent improvement in automobile performance), 67 using less resource material and more effective recycling. These drivers have become more intense in recent years, but they were always there for a business trying to remain competitive.

The second is that, over the next two decades, the single place where the greatest impact on carbon dioxide emissions can be achieved is in the area of personal behaviour. Its potential dwarfs that of new technology interventions. Within the EU over the last 40 years there has been a notable change in public attitudes and behaviour in such diverse arenas as drinking and driving, smoking in public confined spaces, and driving without a seatbelt. If society’s attitude to the profligate consumption of any materials and resources including any forms of fuel and electricity was to regard this as deeply antisocial, it has been estimated we could live something like our present standard of living on half the energy consumption we use today in the developed world. 68 This would mean fewer miles travelled, fewer material possessions, shorter supply chains, and less use of the internet. While there is no public appetite to follow this path, the short term technology fix path is no panacea.

Over the last 200 years, fossil fuels have provided the route out of grinding poverty for many people in the world (but still less than half of all people) and Fig. 1 shows that this trend is certain to continue for at least the next 20 years based on the technologies of scale that are available today. A rapid decarbonization is simply impossible over the next 20 years unless the trend of a growing number who succeed to improve their lot is stalled by rich and middle class people downgrading their own standard of living. The current backlash against subsidies for renewable energy systems in the UK, EU and USA is a sign that all is not well with current renewable energy systems in meeting the aspirations of humanity.

Figure 1. (a) The 40% growth of global energy consumption since 1995 and the projected 40% growth until 2035, with most of the growth between 1995 and 2035 being provided by fossil fuels, 21and (b) the cause of this growth is the rise in the number of people living in the middle class as described in the text. 22


Finally, humanity is owed a serious investigation of how we have gone so far with the decarbonization project without a serious challenge in terms of engineering reality. Have the engineers been supine and lacking in courage to challenge the orthodoxy? Or have their warnings been too gentle and dismissed or not heard? Science and politicians can take too much comfort from undoubted engineering successes over the last 200 years. When the sums at stake are on the scale of 1–10% of the world’s GDP, this is a serious business.

cbdakota

*M.J. Kelly (2016). Lessons from technology development for energy and sustainability. MRS Energy & Sustainability, 3, E3 doi:10.1557/mre.2016.3.


Does Fracking Cause Earthquakes?


Sixty Minutes sent a reporter to Oklahoma to find out if the significant upswing of earthquakes being experienced there is the result of fracking. He interviewed a number of home owners and a visiting geologist, and they convinced him that, yes, fracking is the cause.

Steven Hayward of “Powerlineblog.com” located a video from Stanford University’s Department of Earth Science that says their study finds that fracking is not the cause.

Before you view the 4 minute video, it probably will be helpful to have a little background on “produced water” which is central to the topic.

When wells are drilled they often encounter water which comes up with the oil or natural gas. This water is usually salty and/or has other contaminates so it can not be used for agriculture. This water is typically reinjected into the well for disposal. But sometimes the quantity is too great and other means of disposal must be found. Underground disposal in sites drilled deeply into the Earth is often used for this purpose. Produced water has long disposed of in this manner.

Other details about produced water will be provided after you see the video. Please note the speaker is very clear that the fracking is not the problem.

More background:

John Veil at the Ground Water Protection Council—Underground Injection Control Conference in February 2015 presented “New Information On Produced Water Volumes and Management Practices”.

There are nearly 1 million oil and gas wells in the US that generate large volumes of Produced Water.

He reported the estimated volume of produce water in 2007 21 billion bbl for the year.

Ninety-eight percent goes into injection wells.

His summary for the period from 2007 to 2012

US oil production increased by 29%.

US gas production increased by 22%

US produced water decreased by 2.4%

Viel notes:

Here is my hypothesis

  • Conventional production generates a small initial volume of water that gradually increases over time. The total lifetime water production from each well can be high
  • Unconventional production from shales and coal seams generates a large amount of produced water initially but the volume drops off, leading to a low lifetime water production from each well
  • Between 2007 and 2012, many new unconventional wells were placed into service and many old conventional wells (with high water cuts) were taken out of service
  • The new wells generated more hydrocarbon for each unit of water than the older wells they replaced.

So the conventional wells with hig levels of produced water were replace by fracked wells that generate less produced water per unit of production.

So, yes oil production, if ceased,  would probably make a big reduction in Oklahoma eartthquates. But fracking per se has not caused the problem. The  energy that is being released little by little will probably benefit someone  in the future.  I suspect if I lived there it would not be a big selling point. But of course,  oil and gas production are  the  big selling points to the people in the “oil patch.”

cbdakota

Small-Scale Renewables Program Failure.


Operation of a small-scale wind farm was undertaken at Lake Land College** about 4 years ago. Now the College is planing to tear down the two wind turbines because of high maintenance cost and the wind farm’s inability to provide the College’s power requirements.

According to a Daily Caller posting, the turbines returned a negative 99.6% return on investment. The posting tells us the  College got  $987,697.20 in taxpayer support for the wind power. The turbines were funded from a $2.5 million grant from the US Department of Labor.

two wind mills

The college has spent $240,000 in parts and labor attempting to keep the wind turbines in operation. But they are now inoperable with an  estimated cost of $100,000 to get them back online.

From the Daily Callers posting:

“School officials’ original estimates found the turbine would save it $44,000 in electricity annually, far more than the $8,500 they actually generated. Under the original optimistic scenario, the turbines would have to last for 22.5 years just to recoup the costs, not accounting for inflation. If viewed as an investment, the turbines had a return of negative 99.14 percent.”

“Even though the college wants to tear down one of the turbines, they are federal assets and “there is a process that has to be followed” according to Allee. (Allee is the Director of Public Relations)

“The turbines became operational in 2012 after a 5-year long building campaign intended to reduce the college’s carbon dioxide (CO2) emissions to fight global warming. Even though the turbines cost almost $1 million, but the college repeatedly claimed they’d save money in the long run.”

But the College nor the US Government are not through with renewable power despite this lesson. According to the Daily Caller posting we learn that they are going solar:

“Lake Land plans to replace the two failed turbines with a solar power system paid for by a government grant. “[T]he photovoltaic panels are expected to save the college between $50,000 and $60,000 this year,”Allee told the DCNF.”

Because the wind farm was planned to be a teaching tool for the College students. It could be that some of maintenance was done be the students. However, maintenance must have been lead by professionals.

Third world countries have vast and legitimate needs for electricity for their people. But the greens tell the third world countries that they do not want to provide them with fossil fuel powered plants. And the World Bank says it will not provide them funding for fossil fuel plant. A study done in a remote part of India found that spreading solar cells around did not work because they needed many trained people distributed through out the area the solar cells were being placed and they just did not have that kind of talent. Enough talent can be concentrated in a power plant. Someday these countries, as they advance, will develop these people but they do not exist now. The people in this part of India, of course did not like loosing power every night, either.

You also wonder who in the Department of Labor determines the appropriateness of these awards. Already having put $2.2million in renewables, they are going for more.

I hope the College knows that they wont have power in the evening. (sarc)

cbdakota.

**Lake Land College, located in Mattoon, Illinois, is a two year community college.

ExxonMobil’s— “The Outlook For Energy-View to 2040″


The ExxonMobil Report contains a wealth of information. This posting will look at the status of renewable energy in the context of the world forecasts. While there are a number of postings that contend that renewables will be a dominate player, logic says that will not be true. One recent posting declares that within ten years the world could be supplied exclusively by renewable. I would take that bet on the other side.

First some background from the ExxonMobil Report.

The world population will grow from 7.2 billion in 2014 to 9 billion in 2040. India will replace China as the world’s most populated nation at 1.6 billion people. The globes energy demand will increase by 25% from 2014 to 2040. The report believes without their forecasted improvements in energy use, demand would be double their 2040 forecast shown in the report’s 2040 forecast.

The chart below is their forecast of world energy demand 2014 to 2040:  (click on charts to enlarge)


global fundamentals energy demand_full
The dashed line is the demand without the efficiency improvement forecast in the Report.

Continue reading

Greens Want To Kill Fracking By Slashing, Already Minor, Methane Emissions


Paul Driessen’s posting covers a lot of territory. He talks about the new “big” issue, methane (CH4) in the atmosphere and the future of (or perhaps the non-future of)  solar and wind “renewable energy”. The CH4 fraud that Driessen discusses is reminiscent of what EPA has done to the country with their mercury rules. Mercury emissions are primarily from natural sources and the man-made emission sources from the US are a very small part of the whole.

Click here to read about mercury. Read Driessen’s posting below.

cbdakota

Guest essay by Paul Driessen posted on WattsUpWithThat

Quick: What is 17 cents out of $100,000? If you said 0.00017 percent, you win the jackpot.

That number, by sheer coincidence, is also the percentage of methane in Earth’s atmosphere. That’s a trivial amount, you say: 1.7 parts per million. There’s three times more helium and 230 times more carbon dioxide in the atmosphere. You’re absolutely right, again.

Equally relevant, only 19% of that global methane comes from oil, natural gas and coal production and use. Fully 33% comes from agriculture: 12% from rice growing and 21% from meat production. Still more comes from landfills and sewage treatment (11%) and burning wood and animal dung (8%). The remaining 29% comes from natural sources: oceans, wetlands, termites, forest fires and volcanoes.

The manmade portions are different for the USA: 39% energy use, 36% livestock, 18% landfills, and 8% sewage treatment and other sources. But it’s still a piddling contribution to a trivial amount in the air.

Continue reading

Lomborg Says Wind And Solar Will Still Not Be Competitive By 2040


Bjorn Lomborg asks in his posting “Are wind and solar energy already competitive with fossil fuels?” He says no they are not and probably will not be competitive even by 2040.

“We constantly hear how solar and wind energy is already cheaper than fossil fuels. A few months ago, Bloomberg Business ”wind power is now the cheapest electricity to produce in both Germany and the U.K., even without government subsidies.” If renewable energy is cheaper than dirty fossil fuels, why isn’t everyone adopting them? Are we so irrationally addicted to polluting energy sources that we won’t even embrace cheaper and cleaner alternatives?

Well, as you might have guessed, it turns out that wind and solar energy isn’t cheaper than fossil fuels in the real world. A new report by the same Bloomberg now warns that if subsidies are phased out by 2020 in the U.K, the renewable industry will dry up and drop off a cliff. ”

Continue reading

Why Not Make North America, the New Middle East?


Several years ago, a study done by the Manhattan Institute titled “ Unleashing the North American Energy Colossus: Hydrocarbons Can Fuel Growth and Prosperity”, by Mark P Mills pointed out that we have the capability to replace the Middle East as the major source of crude oil.  This, he says, would be of shaleoilhuge economic benefit to the US, Canada and Mexico. Something like $7 trillion dollars of value over the next 15 or 20 years.

Mills argues that the problems with becoming the New Middle East are political, not geological nor technological. One of the political roadblocks was resolved when the latest Federal budget bill was enacted. The bill included the removal of the prohibition against selling US crude oil on the world market. That prohibition had stood since the Nixon Administration.

While the Executive Summary that follows is probably enough for most readers,  Mill’s full report, some twenty pages in length, can be read by clicking here.

EXECUTIVE SUMMARY

The United States, Canada, and Mexico are awash in hydrocarbon resources: oil, natural gas, and coal. The total North American hydrocarbon resource base is more than four times greater than all the resources extant in the Middle East. And the United States alone is now the fastest-growing producer of oil and natural gas in the world.

The recent growth in hydrocarbons production has already generated hundreds of thousands of jobs and billions in local tax receipts by unlocking billions of barrels of oil and natural gas in the hydrocarbon-dense shales of North Dakota, Ohio, Pennsylvania, Texas, and several other states, as well as the vast resources of Canada’s oil sands.

It is time to appreciate the staggering potential economic and geopolitical benefits that facilitating the development of these resources can bring to the United States. It is no overstatement to say that jobs related to extraction, transport, and trade of hydrocarbons can awaken the United States from its economic doldrums and produce revenue such that key national needs can be met—including renewal of infrastructure and investment in scientific research.

An affirmative policy to expand extraction and export capabilities for all hydrocarbons over the next two decades could yield as much as $7 trillion of value to the North American economy, with $5 trillion of that accruing to the United States, including generating $1–$2 trillion in tax receipts to federal and local governments. Such a policy would also create millions of jobs rippling throughout the economy. While it would require substantial capital investment, essentially all of that would come from the private sector.

The underlying paradigms embedded in American energy policy and regulatory structures are anchored in the idea of shortages and import dependence. A complete reversal in thinking is needed to orient North America around hydrocarbon abundance—and exports.

In collaboration with Canada and Mexico, the United States could—and should—forge a broad pro-development, pro-export policy to realize the benefits of our hydrocarbon resources. Such a policy could lead to North America becoming the largest supplier of fuel to the world by 2030. For the U.S., the single most effective policy change would be to emulate Canada’s solution for permitting major energy projects: create a one-portal, one-permit federal policy for all permits.

The recent preoccupation with technologies directed at creating alternatives to hydrocarbons misses how technology also unleashes alternative sources of hydrocarbons themselves. A number of detailed analyses of the new hydro- carbon realities have emerged, not least of which are excellent ones from Citi, Wood Mackenzie, IHS, and the U.S. Chamber of Commerce.

The authors of Citi’s detailed report “Energy 2020: North America, the New Middle East?” note that “[t]he main obstacles to developing a North American oil surplus are political rather than geological or technological.”

The projected growth in total world energy demand through 2030 is equal to an additional two Americas’ worth of consumption. Every credible forecast shows hydrocarbons fueling the major share of that growth, as they have in the past. While alternative energy has grown rapidly, the overall contribution to U.S. and world supply remains de minimus and stays that way in every credible future scenario.

There will doubtless be objections to the idea of a radical shift in policies and attitudes toward hydrocarbons. But the benefits to the U.S., to the rest of North America, and to the rest of the world are so dramatic and important that abandoning them without serious policy deliberations would be unconscionable.

cbdakota


COP21: Renewables Will Not Be Able To Replace Fossil Fuels


A posting on WUWT by Willis Eschenbach titled “Thirty-Eight Years Of Subsidiesdemonstrates the failure of solar and wind energy to become  viable replacements for fossil fuels. Noting this failure is important because the COP 21 envisions reducing fossil fuel to only 20% of the globe’s energy supply by 2050. In some quarters, there are demands for completely eliminating fossil fuel use by that date. Could this really happen?

Continue reading

Has OPEC Been Successful In Closing Down The US Shale Oil Business?


In the fall of 2014, Saudi Arabia began increasing the amount of crude oil they put up for sale. The objective is often thought to be an attempt to drive US oil fracking out of business. The price was expected to drop below the point where it was profitable to put in new wells and perhaps even close off many of those already in production. The oil rig count in October of last year was 1608 and it now stands at 747 Telegraph has posted : “Oil slump may deepen as US shale fights Opec to a standstill” gives a current status in this battle. And it seems to be going pretty well for the US and not so good for Saudi Arabia and the other OPEC members. From the Telegraph posting:

“There was a strong expectation that the US system would crash. It hasn’t,” said Atul Arya, from IHS. “The freight train of North American tight oil has just kept on coming. This is a classic price discovery exercise,” said Rex Tillerson, head of Exxon Mobil, the big brother of the Western oil industry. Mr. Tillerson said shale producers are more agile than critics expected, which means that the price war will go on. “This is going to last for a while,” he said, warning that any rallies are likely to prove false dawns.

The US “rig count” – suddenly the most-watched indicator in global energy – has fallen from 1,608 in October to 747 last week. Yet output has to continued to rise, stabilizing only over the past five weeks.”

usrigcountandcrudeproduction by bloomberg etc

Others are noting that innovation is cutting costs of new wells:

“We’ve really only begun to scratch the surface. Shale can keep growing by 500,000 to 700,000 b/d easily,” said Harold Hamm, founder of Continental Resources. His company has cut costs by 20pc to 25pc over the past four months.

US shale will “roll over” to some degree as producers exhaust their one-year hedges and face the full shock of lower prices. But it is hazardous to bet too heavily on this assumption.

IHS said an astonishing thing is happening as frackers keep discovering cleverer ways to extract oil, and switch tactically to better wells. Costs may plummet by 45pc this year, and by 60pc to 70pc before the end of 2016. “Break-even prices are going down across the board,” said the group’s Raoul LeBlanc.

Shale bosses have been lining up at this year’s “Energy Davos” to proclaim the fracking Gospel. “We have just drilled an 18,000 ft well in 16 days in the Permian Basis. Last year it took 30 days,” said Scott Sheffield, head of Pioneer Natural Resources.”

We’ve cut spud-to-spud time to 19 days,” said Hess Corporation’s John Hess, referring to the turnaround time between drilling. This is half the level in 2012. “We’ve driven down drilling costs by 50pc, and we can see another 30pc ahead,” he said.”

Large scale frackng has precipitated a number of geopolitical issues such as the stability of Middle East nations and on some nations that rely on crude oil sales to balance their budgets.  My next posting will look at some of these problems.

One thing though noted in the Independent posting is that:

“The market is primed for a sudden spike in prices if anything goes wrong. It is more than ever at the mercy of geopolitical events. One thing is for sure. If and when prices rebound, US shale is ready to sweep in with lightning speed to snatch yet more market share. Opec has met its match.”

Thanks to the US oil industry ingenuity, OPEC seems to be losing the fight. cbdakota