Category Archives: Alternative Energy

More Range Anxiety From Tesla. Trip On Newly “Electrified” I 95 Falls Short Of Plan


Tesla planned, for  NY Times writer John Broder,  a trip using their model S top of the line all-electric car.  The plan was to test out Tesla’s newly “electrified I 95 corridor” that has two charging stations along the way.  The idea here is that these two station should allow for a trip from Washington DC to the Boston area. Things did not work out.

The model S is a $101,000 vehicle with a 85 Kilowatt-hour battery that Tesla reports has a range of 300 miles between charges. The EPA rates the range at 265 miles.  The distance from Broder’s home to the first charging station in Newark, DE was about 114 miles and the distance to the second charging station in Milford, CN is about 200 miles.  So the trip should be easy. Below is a NYTimes graphic of the trip.  The numbers represent the each new phase of the journey.

Continue reading

Slow January Sales For EVs And Hybrids And Obama Backs Off 1Million EV Forecast.


According to Detroit News, “ Electric vehicles and plug-in electric hybrids are off to a tough start in January after a disappointing 2012”.
The Volt had sales of 1,140 units in January,  a drop from the December sales of 2,633.
GM says it was due to low inventories in California caused by a rush to buy the Volt in December because of tax incentives—-$7,500 in Federal Tax Credit as well as some State incentives——which owners claim on the following year’s taxes.  Not only that but last year, in order to pick up slow sales, GM offered a discount of $10,000 on Volt leases.
Nissan Leaf January sales were only 650.  The Leaf sales were 1,489 in December probably buoyed up at the end of the year by tax credits.  The Nissan Smyrna, Tennessee Leaf manufacturing plant came on-line in January making the new 2013 model. The 2013 model’s price has been lowered to $28,800, about 18% lower than last years model.

US PRODUCED 83% OF THE ENERGY IT CONSUMED IN 2012


The US is making progress in becoming self-sufficient energy-wise.  The posting “Energy Charts of the Day” on the American Enterprise Institute blog site shows a projection  that 83% of the energy used in the US was produced in the US.  Behind this improvement has been State and private ownership of oil and gas plays.  To achieve a permit to drill in North Dakota takes 10 days.  The federal government take 307 days to process a permit to drill.

aeichartenergyprodcons

From the AEI blog we have:

1. Thanks largely to the recent significant increases in the domestic production of fossil fuel energy (oil and natural gas), the U.S. was more energy self-sufficient in 2012 than at any time in the last two decades.  Based on data for the first nine months of 2012, the U.S. last year produced more than 83% of the energy it consumed for the first time since 1991 (see chart above).

GovoilPermits

2. From the article “Economics of the Bakken Oil Boom: What the Rest of the Nation is Missing,” in today’s Canada Free Press:

The Bakken development in North Dakota should be an example for the nation, indicating what could be accomplished with the right energy policies to decrease unemployment, raise government revenues, increase per capita income, decrease poverty, and help produce the nation’s major energy source.

So far, the hydraulic fracturing revolution that has created these positive economic developments is largely confined to production on private and state lands, due to governmental policies reducing opportunities on federal lands and a punitive federal regulatory environment. Even though there are massive shale oil and oil shale resources on federal lands, federal policies are choking off any production increases. Here’s one illustrious example: it takes the federal government 307 days to process a permit to drill, but it only takes North Dakota 10 days (see chart below)

See also “President’s Pants On Fire……”

cbdakota

The Warmers Are Punishing The Poor


A recent posting on WUWT by Willis Eschenbach titled “We Have Met The 1%, and He Is Us” illustrates that the  people that get hurt the most by energy rationing are the poor.   Eschenbach’s experiences as a sailor got him to many parts of the globe where living is a daily struggle and the high cost of energy, if it is even available, doom those people to suffering and short lifespans. I recommend that you read his posting which can be accessed by clicking here.
I recently ran across a story that helps illustrate how the zeal of the warmers is punishing the poor. The West Bengal government wants to provide electricity to 1076 Sundarbans villages. The government believes there will be a 10 to 20 fold increase in electricity demand between 2010 and 2020. However the environmental groups oppose this action because the grid will supply coal based electricity.

2012 Volt and Leaf Sales


The 2012 Volt sales were 23,461 which surpassed by a wide margin the 2011 sales of 7,671.  As reported, Californians were responsible for more than half of the 2012 sales. The HOV (high occupancy vehicle) lanes now allow the Volt even if there is only one person in the vehicle.  Initially, the Volt emission levels weren’t low enough when operating on gasoline to qualify for driving in the HOV lanes. This problem was corrected. If you have ever driven in California, you know just how packed roads can be out there.

My wife and I have been driving South several times a year. We use the HOV lanes when driving south out of Washington, DC, around Charlotte, North Carolina and through downtown Atlanta, Georgia.  Two things are noticeable;  one is that we hardly have to slow down from normal interstate driving speeds and  the other is that ours is often the only vehicle in the HOV lane. The vast, and I mean vast majority of the cars, trucks, etc, have only one person in the them. I can understand the allure that driving in the HOV lane must have in Los Angles.

In addition GM worked up an attractive leasing program for the Volt.  According to Money.CNN website:”….. the Volt has also been helped by aggressive leasing incentives offered in 2012. Last year, GM was offering the car for $289 a month with a $2,800 down payment. That was far less than a car with the Volt’s nearly $40,000 purchase price would ordinarily lease for, even factoring in a $7,500 plug-in car tax credit.”

The Nissan Leaf improved over last years sales by about 1.5% with total 2012 sales of about 9,800 vehicles.

The sales of the Volt,  along with the Toyota Prius are the most successful hybrids on the market, are really not that impressive when you consider  2012 total vehicle sales in the US of 14.5 million. EVs, like the Leaf, are even less impressive.  My guess is that gasoline prices are not going to skyrocket in the near term because of the continued world-wide recession and the introduction of a lot of new fossil fuels from fracking.  Low fuel prices will depress hybrid and EV sales.  And one has to wonder how long GM will be willing to subsidize the Volt.

cbdakota

Russia’s Federal Budget Depends On High Price Crude Sales


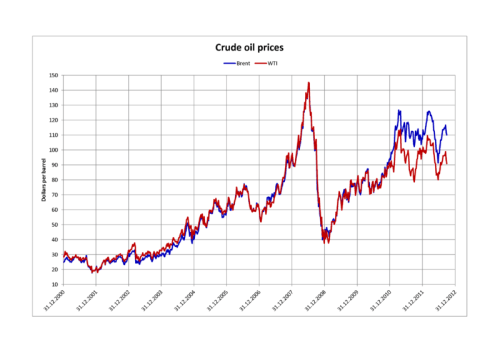
A summary of the Russian Federal budget was posted by Reuters in July of this year.  It said that Russian crude oil had to be sold at or above $116 per barrel or the budget would show a deficit for the year.  A cursory look at the Ural blend (Russian Trading System, comparable to the WTI or Brent) crude pricing for the year suggests that it probably fell short of the goal.  To get some feel for whether or not they accomplished the price requirement, understand that the Ural and Brent crude price indices have been essentially the same for 2012.  The posting tables the Draft Three Year Budget:

DRAFT THREE-YEAR BUDGET 2013-2015 (in trillion roubles unless

stated)

Year                                         2012    2013     2014      2015

Break-even oil price ($)  116.2    113.9     106.0    105.4

Average oil price ($)              115      97        101      104

Nominal GDP                         60.6     65.8      73.4     81.5

Revenues                                  12.7     12.4      13.6     15.2

Expenditures                          12.7     13.4      14.1     15.3

Deficit (% GDP)                      – 0.1      1.5       0.6      0.11

Non-oil deficit (% GDP)     10.6     10.1      8.9      8.6

$1  =  31 rubles

By 2015, the draft budget forecasts break even price at $105.4.

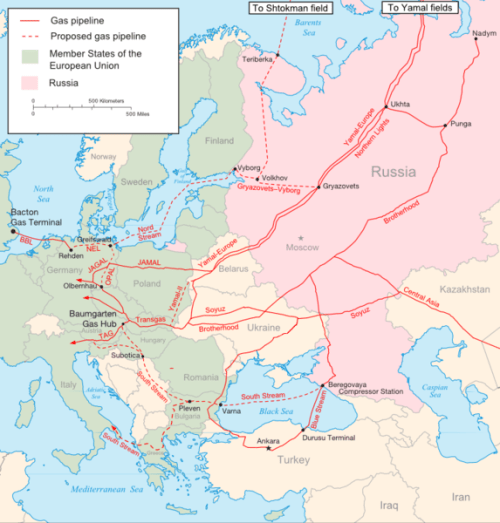
Both Poland and Romania have shale oil and natural gas potential and are known to be evaluating whether it can be profitably exploited.  This is a real threat to Russia.  Any development of Western European shale is a major problem for Russia.  Like crude oil sales, natural gas sales are a major source of income for Russia.  Russia currently provides most of the natural gas and much of the oil to Western Europe.  Russia has not been reluctant to shut off supplies.  In 2009 a dispute between the Ukraine and Russia over unpaid bills resulted in shutting off natural gas to the Ukraine.  Other countries felt the effect with low  pressure or no  pressure in their pipelines.  While the official story was about unpaid bills there was a belief that Russia’s real reason was to warn neighboring countries not to join NATO. They probably are prepared to put pressure on these nations to persuade them to not develop shale gas or oil.

Below is a 2009 map of the Russian natural gas pipelines supplying European nations.

Russiannaturalgassupplylines573px-Major_russian_gas_pipelines_to_europe

Stefano Casertano,  managing director of the Berlin based “The Energy Affairs Company” posted “From Fracks to Riches” on the Stratfor website.  A number of countries are dependent on sale of oil and natural gas to provide the revenue to balance their budgets. In addition to the numbers above for Russia,  Casertano lists what he says are the crude oil prices (in dollars per barrel) to achieve the needed revenue for several other countries as follows:

Iran——-$117

Libya —-$117

Algeria–$105

Iraq—–$112

The US economy can get an enormous boost from an ample supply of low priced fossil fuels. The fear is that the President does not really see this boost as aligning with his political objectives.  He can use his rigged fracking safety study group to impose many “safety” restrictions as a means to cut short this very beneficial exploitation of our shale.  The consequence of slowing or even stopping the US shale boom will be appreciated by Russia and OPEC.

cbdakota

Why Is US Crude Oil Priced Lower Than European Crude?


The price standard for US crude oil is West Texas Intermediate (WTI). WTI is called light and sweet referring to its density and relatively low sulfur content.  It is often considered the premium crude and historically has been the benchmark for global oil pricing.  Brent Crude from the North Sea and an OPEC Reference Basket are other standards by which crude is valued.  WTI should carry a wellhead price premium over other crude sources.  But about two years ago,  Brent and WTI prices began separating and the price today, 26 December 2012,(at 4 pmEST) for Brent per barrel is $108.80 and WTI is $88.75.  The  Wikipedia chart below shows the historic trend since the beginning of 2001 through the later part of 2012.   (Click on Charts for clarity.)

Comments On COP18 Doha, Qatar Meeting—Kyoto II And Reparations


 The 18th Conference of Parties (COP) met in Doha, Qatar from 26 November to 7 December. Initially the purpose of these COPs was to monitor the Kyoto treaty which was designed to control greenhouse gas emissions. The people who set up this treaty hoped that it would give global governance of world’s energy to the UN bureaucracy.  It has failed to do that. The Kyoto Treaty  expires on 31 December 2012.  Undeterred, the attendees replaced it with  Kyoto II. The response to Kyoto II by the COP 18 attendees was underwhelming.  And this new version has even less chance of accomplishing their desired result.The COP meetings have a new raison d’etre that alleges that the developed nations have damaged or will damage the undeveloped nations and thus owe them reparations. The idea is that developed nations send money to the UN who then decide what to do with it. Surpassed only by a few despots such as Duvalier and Amin, UN bureaucrats have mastered the art of siphoning money out of similar programs into their own Swiss bank accounts.  The “OIL FOR FOOD”  program is an example.  Do you want give your money to the UN?  I don’t. Continue reading

WindTurbines Regularly Fail In Weather Extremes


The 12th of December was a cold day in the UK.  Power demand was up, about 20% more than normal.  How much contribution to the total load did renewable wind power provide—–0.6%.  That amounts to about 3% of the wind renewable’s rated capacity.   The fact that these wind farms failed to come through when the weather was cold is nothing out of the ordinary.  It happens all over the world.  The wind farms also fail to provide power in the hotest weather.  This is owing to the fact that during very cold and very hot weather, the wind is very likely not blowing. Read this posting from the Institute for Energy Research to see performance during weather extremes. 
And this from a previous posting on Climate Change Sanity   
 
The Brits are mandated to have, by 2020,  30% of their electrical energy provided by renewables.  For the year 2011,  renewables provided 9.7% of the total.  Wind’s contribution to that was 4.4% and solar’s 0.1%.   To read the full posting “Just Enough To Boil The Kettle” the blog that provided most of this information, click here.
 
I wish them the best, which means, that they elect politicians that recognize that the current course is unsustainable.   
cbdakota

Green Energy Stock In Free Fall


The Renewable Energy Industrial Index (RENIXX ®World), is composed of the world’s 30 largest renewable energy companies.  The 30 companies get the majority of their income from wind, solar, biofuel, geothermal, hydropower or fuel cells.  The stock index was set up  to allow the shareholder to profit by the expected surge in value of these companies as the green revolution unfolded. Unfortunately for the investors, the stock value which surged, peaked in the 2007 -2008 timeframe, has been a downhill ride since then.  The glib promises of the performance of these renewables has not materialized and the Nations that have heavily subsidized these renewables can no longer afford them.  
A Washington Times-Community posting authored by Steve Goreham titled “So, how’s your green energy stock doing?” discusses the history of the Index.  For instance,  in a private meeting, Al Gore impressed the Deutsche Bank Asset Management  team causing them to establish the RENIXX and the rest is history. One wonders how many investors have lost money believing that Gore knew some real science. On the other hand,  Mr Gore is rumored to have made $200 to 300 million himself selling carbon offsets and his stake in the Chicago Merc’s Carbon Market. He may be weak on science but he knows how to make a buck.
 
The posting is a good read that I recommend to you. The whole story with the chart of the Index’s rise and fall are in his article. Also he talks of the thirty companies,  of which 10 are headquartered in China, 10 in Europe, and 7 in the US.  Click here to read his posting.
cbdakota