
The price standard for US crude oil is West Texas Intermediate (WTI). WTI is called light and sweet referring to its density and relatively low sulfur content. It is often considered the premium crude and historically has been the benchmark for global oil pricing. Brent Crude from the North Sea and an OPEC Reference Basket are other standards by which crude is valued. WTI should carry a wellhead price premium over other crude sources. But about two years ago, Brent and WTI prices began separating and the price today, 26 December 2012,(at 4 pmEST) for Brent per barrel is $108.80 and WTI is $88.75. The Wikipedia chart below shows the historic trend since the beginning of 2001 through the later part of 2012. (Click on Charts for clarity.)
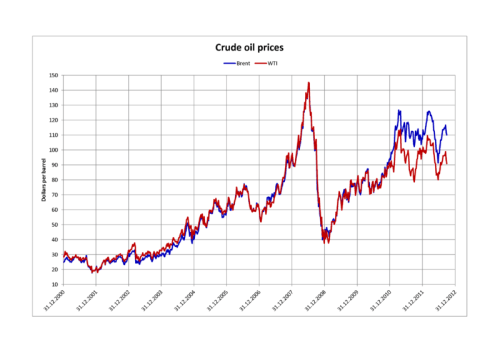
The turmoil in the Middle East is probably part of the reason, but the separation of the prices may correspond better with the advent of fracked crude and fracked natural gas.
The Bakken Field in North Dakota produced 3,000 barrels per day of crude in 2005. By 2010 the field was producing 225,000 barrels per day. Some estimates are that it will produce 1,000,000 barrels per day by 2020. Texas Eagle Ford shale oil production was 12,000 barrels per day for the year 2010. For the first 10 months of 2012, it has risen to an average of 327,000 barrels per day.
The Department of Energy commissioned INTEK, inc. to make a shale oil assessment. The assessment reported that there are 23.9 billion barrels of technically recoverable shale oil in the Lower 48 states. The largest reservoir is the Monterey shale play (see map below) in the Santa Maria and San Joaquin Basins of southern California. INTEK estimated that this reservoir contained 15.4 billion barrels of crude.

How much crude did we produce in 2011 the US? About 5.7 million barrels per day (MMbd). We do have energy sources other than the crude oil that we produce. Liquid fuels captured in the processing of natural gas, biofuels etc also add to the US energy production.
We have a large appetite for petroleum products. The US consumed 18.8 (MMbd) of petroleum products during 2011. The US imported 11.4 MMbd of crude and refined products. But we also export 3 MMbd of crude oil and petroleum products. So our net imports (imports minus exports) equaled 8.4 MMbd. The import of 8.4 MMbd represent 45% of our consumption of 18.8MMdb. If shale oil delivers 1+MMbd of crude this decade, it could represent about 20% of our Nation’s crude oil production.
See the Energy Information Administrations graph below:

The supply of fracked natural gas is very large. Natural gas does not often compete directly with oil except for building/home heating where many are making the switch to natural gas. Natural gas is having a very large impact as the new fuel in electrical generating plants replacing coal. Currently, natural gas doesn’t have much impact in the transportation market. However it could, if electrical vehicles begin to displace gasoline powered vehicles. Despite huge governmental subsidies and media promotion, that scenario does not look likely in the near term.
The cost and time to put in a new natural gas distribution and delivery system for the US transportation fleet would be problematic. Even so, a glut of natural gas with correspondingly low prices could make T. Boone Pickens’ plan to convert our vehicles to natural gas a reality. Most of the design issues have been resolved for natural gas vehicles, so that should not be a major impediment.
It is not clear to me that there is a single thing that is causing the WTI price to fall so far below the Brent price, but it is probably driven by the newly found abundance of fossil fuels supplies. Oil-Price.net forecasts WTI at $105 per barrel a year from now. So I guess we wont want to get too comfortable with the idea of continuing decline of crude oil price.
cbdakota
