
Wind and solar in Europe 2 December 2022
European countries have installed wind and solar systems to various degrees. The energy crisis that these countries are encountering is primarily due to a shortage of natural gas. If the Alarmists get their way, no one will be allowed to use natural gas. How are we to manage without natural gas. Certainly, the EU nations have thought this through as several EU nations have passed laws that will outlaw natural gas. Or have they?
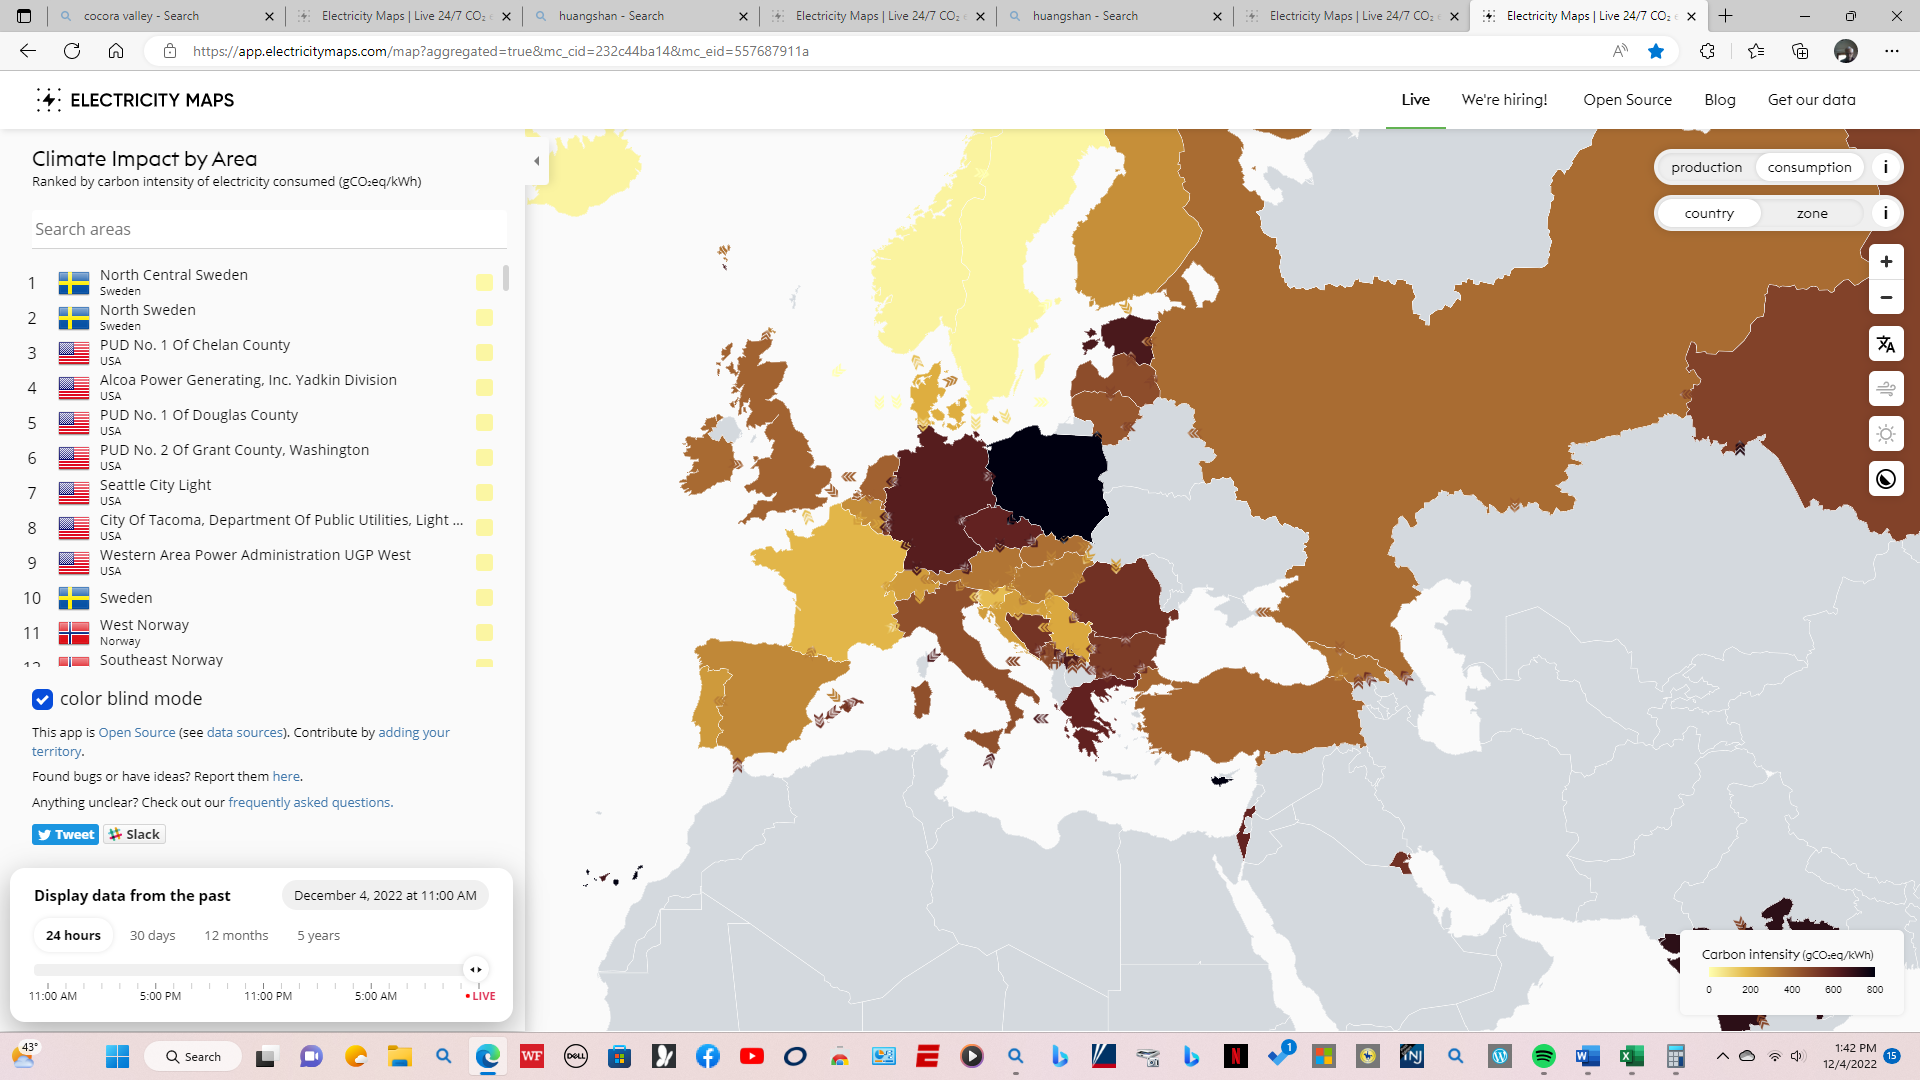
In Europe, and perhaps globally, Germany is leading the way to banish fossil fuels. The idea is to install wind and solar electricity generating facilities. Germany has installed wind and solar facilities that have name plate capacity of 127.4 GWs. That much capacity exceeds their electrical demand by almost double. So why do they care if the Russians have cut off natural gas? Name plate capacity for wind and solar over states the actual performance by about 3-fold. It’s worse than that really but they will be something for latter discussion. There is an app “The ELECTRICITY MAPs” that allows you to look at daily demand for electricity and what systems are creating the electricity. Not just renewables, but nuclear, natural gas and coal production systems.
I chose to look at the maps for a number of countries in the EU, on December 2, 2022, at 12 pm. I assembled a chart that demonstrates the problem by focusing on the rated capacity of wind and solar and their actual performance. The chart has the nation, the demand for electricity at that hour, the name plate capacity (NPC) combined for wind and solar generators and the actual production (column 4) by those generators. The last column (5) is the percentage of the electricity demand being supplied by wind and solar. Great Britain looks odd, but at the time this reading was made could have been windless and overcast. Because the Alarmist tell us that wind and solar are the least expensive forms of power generation, you would think every country would be maxing out those units. Oh yes, they forgot to tell you that because they are dependent on the weather, they only function, on average, about a 1/3 of the time.
| Column1 | Column2 | Column3 | Column4 | Column5 |
| Europe | December 2, 2022 | |||
| 12pm | ||||
| Electricity | Wind and Solar | Electricity | ||
| Demand | NPC | Production | ||
| Nation | GW | GW | GW | % |
| Germany | 77.3 | 127.4 | 17.8 | 24 |
| Great Britain | 30.7 | 38.5 | 0 | 0 |
| France | 69.4 | 32.7 | 3.8 | 5.5 |
| Italy | 43.9 | 32.6 | 1.8 | 4.2 |
| Netherlands | 17.2 | 22.2 | 5.2 | 30 |
| Belgium | 14.9 | 11.2 | 2.4 | 16 |
| Poland | 25.7 | 11 | 1.2 | 3.9 |
| Denmark | 6.22 | 8.5 | 2.8 | 45 |
| Slovakia | 6.1 | 6.1 | 0 | 0 |
| Austria | 11.6 | 6 | 0.4 | 4 |
| Romania | 7.88 | 4.4 | 0.5 | 6 |
| Switzerland | 14 | 3.1 | 0 | 0 |
| Czech Republic | 12.9 | 2.4 | 0.04 | 0.3 |
| Hungary | 6.4 | 2.1 | 0.2 | 0.3 |
| Bulgaria | 7.12 | 1.8 | 0.16 | 9 |
| Spain**** | 28.7 | 48.5 | 7 | 24 |
Down at the bottom of the chart is Spain. I forgot Spain on 2 December. So, I looked it up, today the 4th of December. Spain also has put in more wind and solar capacity than the demand requirements. The app said 7 GW were being produced at 10am.
The chart numbers, in many cases, are rounded off.
Wind and solar are not the answer.
cbdakota
