
“Visual Capitalist” is an interesting site. It provides charts and some dialog on a broad range of topics. A partial list of the categories are Markets, Technology, Money, Health Care, Energy, etc. Often you get a new chart every weekday on some topic or other. It is easy to subscribe to the site.
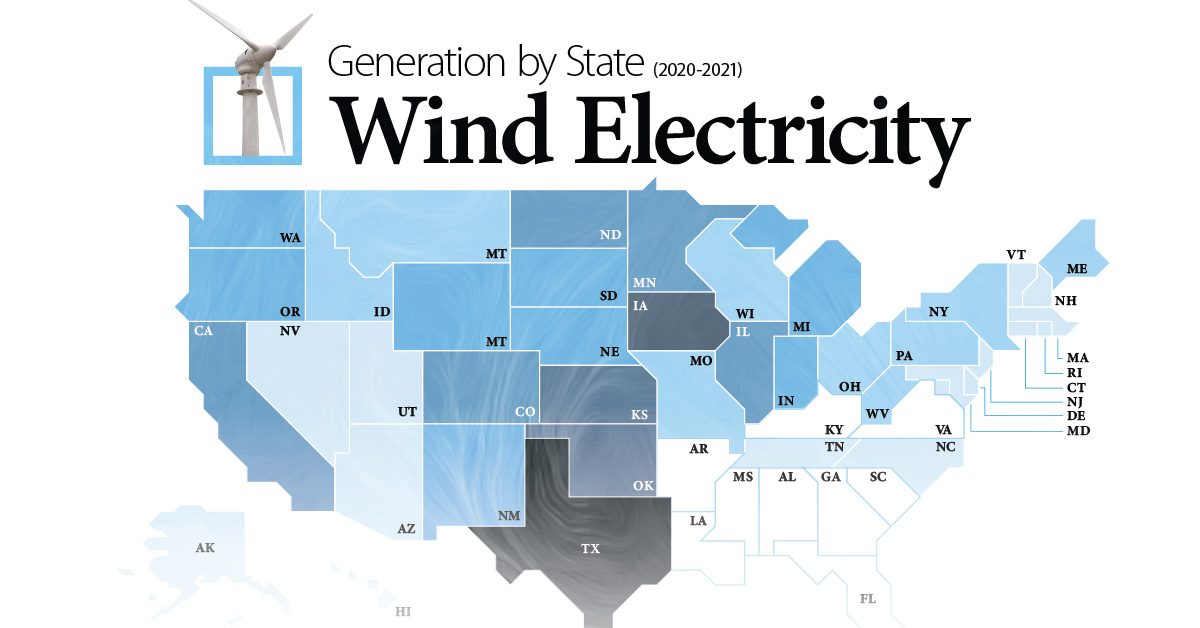
Even though it has a man-made global warming bias, its a useful site. I am providing a link to this site and it will come up with visualizations of Wind, Solar and Nuclear energy. These topics are covered often, and usually of interest. The site predicts that by the year 2026 wind and solar will produce more electricity than natural gas, coal and nuclear combined. This 8 June 2022 prediction will not be realized.
You can link with the site by clicking here.
cbdakota
