
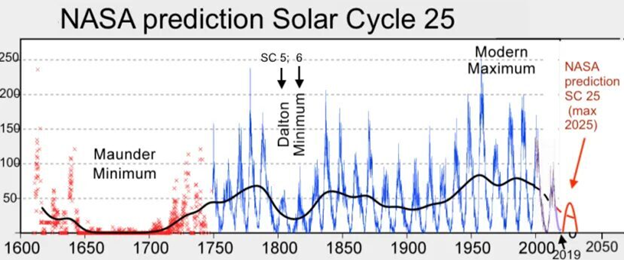
We can see that Solar Cycle (SC) activity is pretty closely reflected in Global Temperature. Look at the chart below. The Y axis indicates the number of sunspots. Sunspots are a proxy for solar activity. The more spots the more active the SC is. The blue peaks shown on the chart are representative of the 25 SCs that have been well charted over the years. Charting began when Galileo looked at the Sun through his telescope on 1610. Sunspots were observed and counted. But scientific counting was instituted about 1755.
Here is what the NASA Earth Observatory had to say about SCs and global temperature:
“From 1650 to 1710, temperatures across much of the Northern Hemisphere plunged when the Sun entered a quiet phase now called the Maunder Minimum. During this period, very few sunspots appeared on the surface of the Sun, and the overall brightness of the Sun decreased slightly. Already in the midst of a colder-than-average period called the Little Ice Age, Europe and North America went into a deep freeze: alpine glaciers extended over valley farmland; sea ice crept south from the Arctic; and the famous canals in the Netherlands froze regularly—an event that is rare today:”
The Dalton Minimum is also shown on this chart. Some solar scientists believe that the period containing the Maunder and Dalton Minimums continued on until the 1940s and they call it the “little ice age. Solar activity was waning. Temperatures followed.
Then came the Modern Maximum. Global temperatures began rising from roughly 1940-1950s until 2000.
The path from cooling to warming is shown on this NOAA chart below. The warming is closely related to the Modern Maximum.
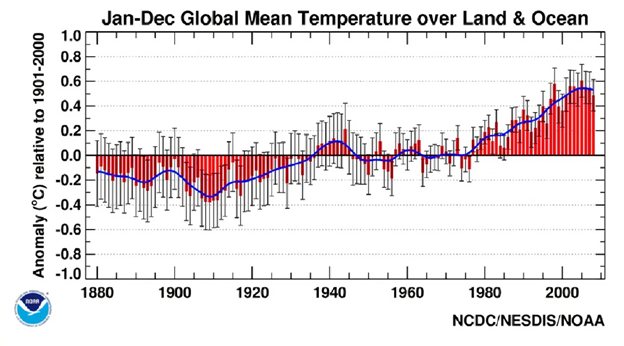
Then for a period of about 20 years, the global temperatures plateaued. The two very powerful El Ninos occurred, one right after another. That is shown on the chart below.

Carbon Dioxide was still rising during this period of hardly any growth in the global temperature. The solar cycles were becoming less active.
What is to say about El Ninos? This is what Wikipedia says:
It is believed that El Niño has occurred for thousands of years.[11] For example, it is thought that El Niño affected the Moche in modern-day Peru. Scientists have also found chemical signatures of warmer sea surface temperatures and increased rainfall caused by El Niño in coral specimens that are around 13,000 years old.[12] Around 1525, when Francisco Pizarro made landfall in Peru, he noted rainfall in the deserts, the first written record of the impacts of El Niño.[12] Modern day research and reanalysis techniques have managed to find at least 26 El Niño events since 1900, with the 1982–83, 1997–98 and 2014–16 events among the strongest on record.[13][14][15]
I have highlighted two sentences in bold.
First, El Ninos have been going on for thousands of years before the industrial use of fossil fuels. They are natural occurrences.
Second, the strongest El Ninos on record have occurred during and following the Modern Maximum.
I have been warned that correlation does not necessarily mean causation. But it does not mean that correlation can’t mean causation
I have quoted NASA saying that the Maunder minimum was caused by exceptionally low solar activity. NASA’s chart expects SC 25 activity to drop.
Examination of the charts seem to correlate SC activity to global temperatures. Rising when the Modern Maximum occurs and falling when low activity SC occur.
The plateau in the early part of this century suggests that Solar activity is more likely to be controlling the global temperature than is CO2. The fact that El Ninos are natural rather that caused by CO2 accumulation is important information. Further, the most powerful El Ninos have come at a time of very active SCs.
Different theories are being proposed as to why global temperature fall when SC activity is low. Cosmic rays, change in solar UV emission, solar irradiance variation etc. While the warmers are quick to tell you that the irradiance only changes about 0.15% so that it has no effect. When you learn that accurate measurement of irradiance was first accomplished in 1979 you realize that is a small sample.
I am certain that someone will precisely show that the peaks and valleys do not exactly coincide with my assertions. But they are close enough to tell the story. And NASA seems to be on board. We do not know a lot about the sun. Lags and leads may result from the activity changes of the sun. The oceans are a key factor. They make their effects in slow motion.
This blog’s charter is that solar activity is what controls global temperatures, and I am sticking to it.
cbdakota
For your information, I have a Wikipedia chart detailing SCs for you, below.
| Solar Cycle | Start (Minimum) | Smoothed minimum ISN (start of cycle) | Maximum | Smoothed maximum ISN | Average spots per day | Time of Rise (years) | Duration (years) | Spotless days[10][11] |
| Solar cycle 1 | 1755-02 | 14.0 | 1761-06 | 144 | 6.3 | 11.3 | ||
| Solar cycle 2 | 1766-06 | 18.6 | 1769-09 | 193 | 3.3 | 9.0 | ||
| Solar cycle 3 | 1775-06 | 12.0 | 1778-05 | 264 | 2.9 | 9.3 | ||
| Solar cycle 4 | 1784-09 | 15.9 | 1788-02 | 235 | 3.4 | 13.6 | ||
| Solar cycle 5 | 1798-04 | 5.3 | 1805-02 | 82 | 6.8 | 12.3 | ||
| Solar cycle 6 | 1810-08 | 0.0 | 1816-05 | 81 | 5.8 | 12.8 | ||
| Solar cycle 7 | 1823-05 | 0.2 | 1829-11 | 119 | 6.5 | 10.5 | ||
| Solar cycle 8 | 1833-11 | 12.2 | 1837-03 | 245 | 3.3 | 9.7 | ||
| Solar cycle 9 | 1843-07 | 17.6 | 1848-02 | 220 | 4.6 | 12.4 | ||
| Solar cycle 10 | 1855-12 | 6.0 | 1860-02 | 186 | 92 | 4.2 | 11.3 | 561 |
| Solar cycle 11 | 1867-03 | 9.9 | 1870-08 | 234 | 89 | 3.4 | 11.8 | 942 |
| Solar cycle 12 | 1878-12 | 3.7 | 1883-12 | 124 | 57 | 5.0 | 11.3 | 872 |
| Solar cycle 13 | 1890-03 | 8.3 | 1894-01 | 147 | 65 | 3.8 | 11.8 | 782 |
| Solar cycle 14 | 1902-01 | 4.5 | 1906-02 | 107 | 54 | 4.1 | 11.5 | 1007 |
| Solar cycle 15 | 1913-07 | 2.5 | 1917-08 | 176 | 73 | 4.1 | 10.1 | 640 |
| Solar cycle 16 | 1923-08 | 9.4 | 1928-04 | 130 | 68 | 4.7 | 10.1 | 514 |
| Solar cycle 17 | 1933-09 | 5.8 | 1937-04 | 199 | 96 | 3.6 | 10.4 | 384 |
| Solar cycle 18 | 1944-02 | 12.9 | 1947-05 | 219 | 109 | 3.3 | 10.2 | 382 |
| Solar cycle 19 | 1954-04 | 5.1 | 1958-03 | 285 | 129 | 3.9 | 10.5 | 337 |
| Solar cycle 20 | 1964-10 | 14.3 | 1968-11 | 157 | 86 | 4.1 | 11.4 | 285 |
| Solar cycle 21 | 1976-03 | 17.8 | 1979-12 | 233 | 111 | 3.8 | 10.5 | 283 |
| Solar cycle 22 | 1986-09 | 13.5 | 1989-11 | 214 | 106 | 3.2 | 9.9 | 257 |
| Solar cycle 23 | 1996-08 | 11.2 | 2001-11 | 180 | 82 | 5.3 | 12.3 | 619 |
| Solar cycle 24 | 2008-12 | 2.2 | 2014-04 | 116 | 49 | 5.3 | 11.0 | 914 |
| Solar cycle 25 | 2019-12 | 1.8 | Progressive: 25 (Apr 2021) [Same point last cycle: 21] | 267 (Nov 9, 2021) (Same point last cycle: 331) | ||||
| Average | 9.0 | 178.7 | 4.4 | 11.04 |
