
German solar scientists, Frank Bosse and Fritz Vahrenholt say that Solar Cycle 24 is the “..third weakest cycle since observations began in 1755.” The Accumulated Sunspot Anomaly until 97 months after cycle start is shown on the figure below:

Figure 2: Comparison of all the solar cycles. The chart shows the accumulated sunspot number anomaly from the mean value.
The mean value is noted at zero and Cycle 24 is running 3817 spots less than the mean and only two other Cycle had fewer. Note that the seven Cycles that preceded Cycle 24 had more sunspots than the mean.
While the connection between sunspots and global temperatures has been attacked as not very accurate by some very respectable solar scientist, the connection still works for me.
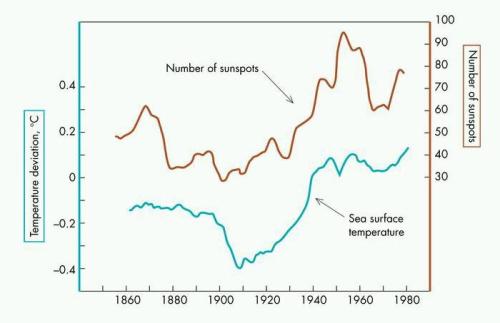
Look at those charts. Are the Cycles and the global temperatures always exactly in sync? Probably not, but there are likely other forcings that modify the solar activity’s effect on the global temperature. In general, I think sunspots, which are just a proxy for solar activity, are good enough indicators to keep me believing that solar activity is the primary driver of global temperature. It is clear, that prior to 1940, the impact of CO2 had to be minimal. And prior to 1940 the sea surface temperature and the Solar Cycles followed one another.
Bosse and Vahrenholt are using the solar polar magnetic field as the way to predict the subsequent Cycle strength and they are on board with the majority that are now predicting Cycle 25 will be about the same size as Cycle 24 or, they think, perhaps somewhat smaller. Their full paper “The sun in December 2016, and a look ahead” gives their view about reading the solar polar magnetic field and you can see it by clicking on the link. (To read the posting, you will have to page down until your reach it. The No Tricks Zone has translated the posting from German to English.)
They do provide some new thinking about the Solar polar field. From their posting:
“In solar cycle 23, there was a switch in solar fields, which is normal. But during the current cycle there has been no switch in strength as the southern pole was the stronger pole over the entire time. This has never happened since satellite observations began in 1977, and means that the fields appear to be quite decoupled.
What does this decoupling mean? Could it be a sign for SC 25? The answer to this question is unknown because the satellite observations began only in 1977.
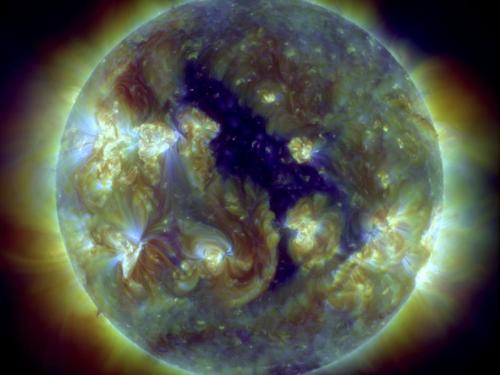
Yet, recently the results of a new study by Kalevi Mursula et al of the University in Oulu in Finland allow us to look back 100 years. Here the authors looked at the strength of coronal holes in order to get information about the polar fields since 1910. Coronal holes, like solar flares, are sources of plasma discharges from the sun and act to strengthen solar winds, which in turn impact the earth’s magnetic fields. What follows is an example image made by a space craft:
In solar cycle 23, there was a switch in solar fields, which is normal. But during the current cycle there has been no switch in strength as the southern pole was the stronger pole over the entire time. This has never happened since satellite observations began in 1977, and means that the fields appear to be quite decoupled.
What does this decoupling mean? Could it be a sign for SC 25? The answer to this question is unknown because the satellite observations began only in 1977.
Yet, recently the results of a new study by Kalevi Mursula et al of the University in Oulu in Finland allow us to look back 100 years. Here the authors looked at the strength of coronal holes in order to get information about the polar fields since 1910. Coronal holes, like solar flares, are sources of plasma discharges from the sun and act to strengthen solar winds, which in turn impact the earth’s magnetic fields. What follows is an example image made by a space craft:
Examining archives on polar lights, which are caused by flares and coronal holes, the authors were able to trace back the strengths of the solar polar coronal holes. The result: they were predominant on the downside of the SC 18 and SC 19, with the peak in 1957 – and then followed the most active cycle of the systematic observation record.
The situation was entirely different after the peak of solar cycle 23, starting at about 2002. The authors conclude that both events mark records for the period since 1910 and are at the start and end of the long-term maximum of solar activity (see Figure 2) in the second half of the 20th century. With regards to the polar fields, solar activity shifted up a gear in the 1950s and then shifted down at the end of the century.
All that is pretty interesting. If Solar Cycle 25 is like Cycle 24, we should expect cooling to become evident—so evident that the people that massage global temperature numbers will not be able to cover it up.
cbdakota
PS: Watching the GB vs Falcons NFC championship game has made checks for errors problematic. Hope it is ok)
