
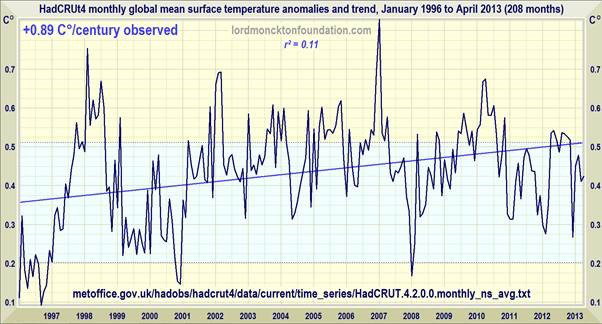
Christopher Monckton adds a guest posting at WattsUpWithThat which takes on Dr Santer’s requirement of a period of 17 years with no significant global warming to disprove the man-made global warming theory. Using the HadCru monthly mean surface temperature anomalies, Monckton’s first chart shows that a period of 17 years and 4 months has been realized with no statistically significant global warming. (Click on charts to get better view.)
Dr. Santer, as you probably know is strong supporter of the man-made global warming theory. Skeptics anticipate that the warmers will move the goal posts again. Perhaps the new “proof years” will be revised to 20 or more. What ever it takes to keep their dream alive (sarc).
Monckton also provided a chart that shows that over the last 100 months the global anomaly is negative. His chart includes the climate model predicted temperature anomaly. Monckton says: “The variance between prediction and observation over the 100 months from January 2005 to April 2013 is thus equivalent to 3.2 Cº/century.”

He knows that this period is too short to draw any real conclusions but it is interesting that HadCru data indicates a decline in global temperatures.
cbdakota
