
Solar Cycle 24 is nearing its maximum after which the solar activity will decline. The maximum is often pegged as the time when the Sun’s north and south poles swap. The chart below shows the current position of the poles. Projecting their current position suggests that the swap will occur early next year.
(Click on Charts to improve clarity)

Solar Polar Field 1966 to Present –Wilcox Solar Observatory
The Sun’s magnetic activity describes how active the Sun is. Sunspots and F-10.7cm radio flux are proxies for the strength of the magnetic field. As the field strength begins to decline, we can see it by recording the Sunspots and F-10.7 flux. The following charts are the record of these proxies.
Note that the projection of peak Sunspot and flux shown by the smooth red line has not be reached by the smoothed blue line– Sunspot and Flux measurements. My guess is that they wont.

The following chart is compares Cycle 24 with previous Solar Cycles, 21,22, and 23. .
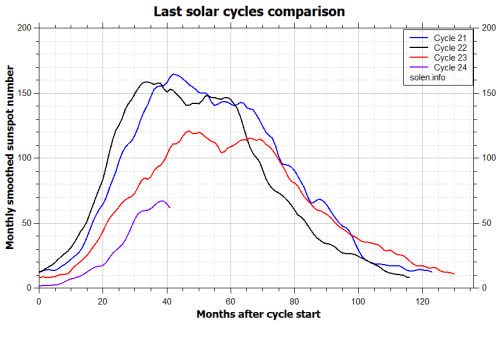
Chart by Solen Data
One unique indicator of the weak Cycle 24 has been reported by Penn and Livingston. The charts below cover their readings principally from Cycle 23 and Cycle 24. They show that the Sunspots are becoming less magnetic and are not as dark as prior Sunspots. They speculate that if the magnetic fields weaken to 1500 gauss, Sunspots would be too weak to appear. They would become so intense as not to be distinguishable from the normal Sun surface. Many are forecasting that Solar Cycle 25 will be even less active than Cycle 24. If so, the globe could be in for some significant cooling such as been experienced in previous periods called Minimums. The Minimums were times when few Sunspots were seen.
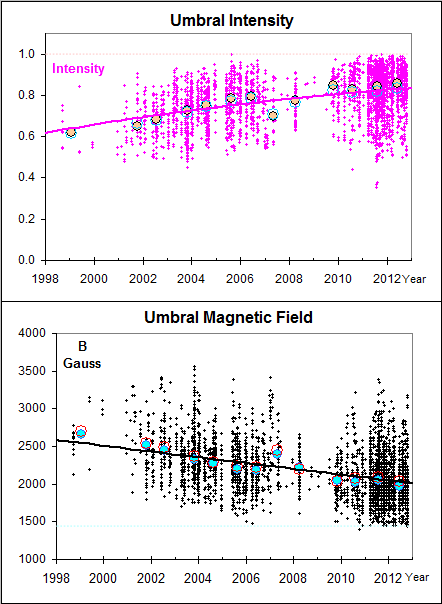
Livingston and Penn Umbral Intensity and Magnetic Field Charts
For additional background on this topic, you might find the following useful:
