
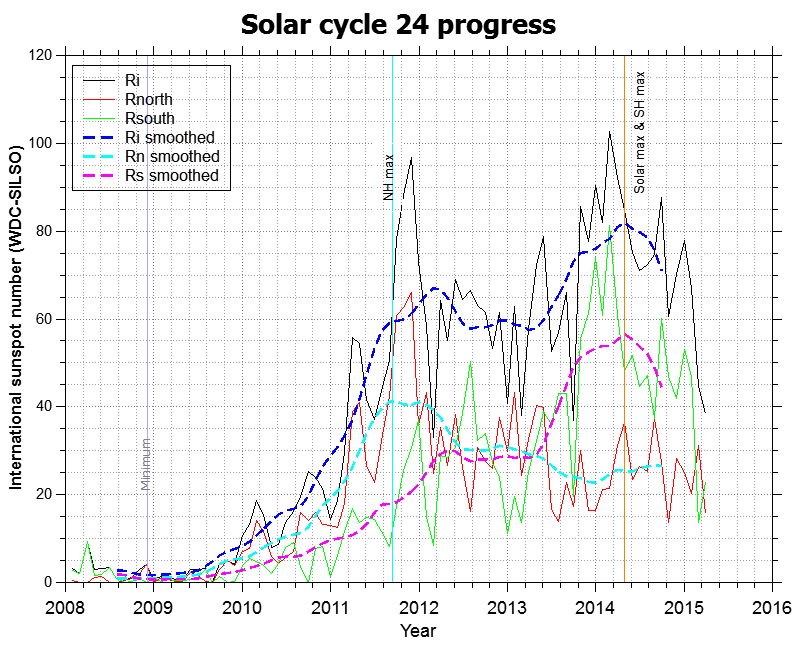
Solar Cycle 24 activity, using Sunspots as the proxy, is slowing down considerably. The International number for March was 38.4. The smoothed International Sunspot number is estimated at 56.1. The March number will not be official for another 6 months. The chart below, the black line, labeled Ri is the International number which is the sum of the Rnorth (red) and Rsouth (green) Sunspot numbers.
This morning, 3 April 2015 the side of the Sun facing Earth was pretty quiet.
Note the two Sunspot clusters, 2305 and 2317 on the right hand limb. (Limb is edge in astronomy talk.)
The NOAA Solar Cycle 24 Prediction Panel are forecasting Solar Cycle 24 activity to continue to decline and be at 4 or so International Sunspot number by December, 2019. That is exactly 11 from the start of Cycle 24. That is playing it safe.
Solar Storm
Earth is in the path of a recent ejection of plasma known as solar wind.
A solar wind stream hit Earth’s magnetic field during the late hours of April 2nd. The initial impact did not spark a geomagnetic storm. The peak velocity is scheduled for 3, 4 and 5 April.
The velocity and density of this storm is shown in the model WSA-ENLIL below.
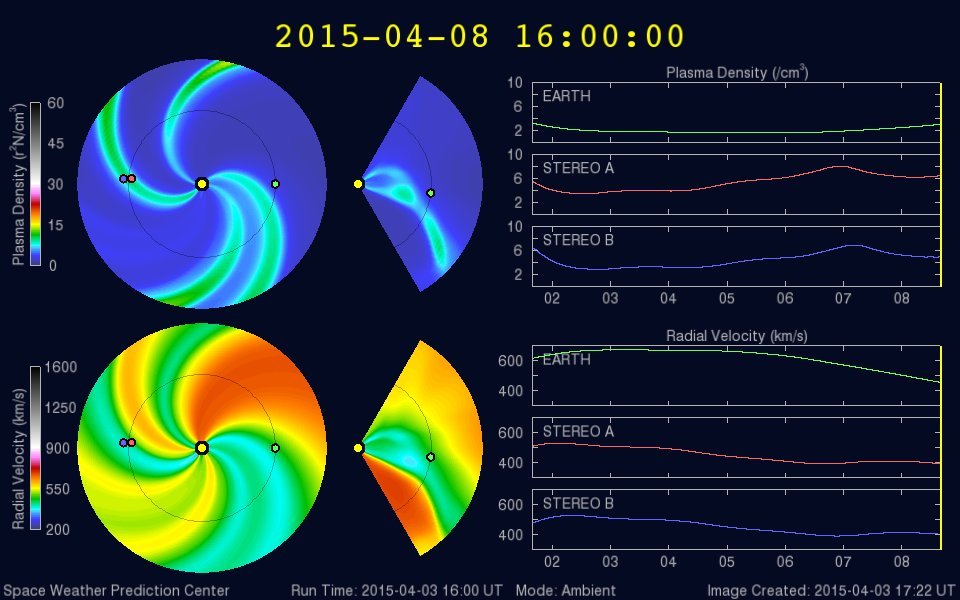
The chart on the left shows the dates of 2 April through 9 April. The peak velocity is scheduled for 3, 4 and 5 April. This chart can be seen in animation by clicking here .
The pictorial on the left side shows the Earth and Sun positions and the spiraling plasma. The following provides background on the WSA-ENLIL model:
The WSA-ENLIL model is essential for modeling and predicting the effects of solar winds and coronal mass ejections (CMEs) on human instruments. Solar winds are streams of charged particles that flow constantly from the sun. They form a spiral shape coming off the sun due to the sun’s rotation. Solar winds can fluctuate from ambient to strong, and they can affect human instruments around Earth and on other planets if the timing and intensity are right. CMEs are fast, strong eruptions of material from the Sun that can reach Earth in three or four days. These eruptions are not always Earth-directed, but they do travel to the farthest reaches of the heliosphere. CMEs also cause geomagnetic storms on Earth, which result in aurora and can also interfere with aviation technology, GPS systems, power grids, and other technology.
The WSA-ENLIL model allows scientists to predict what impacts certain solar wind and CME levels can have throughout the inner planets (Mercury, Venus, Earth, and Mars). Scientists can use the model to simulate scenarios in which certain satellites and/or planets are affected by solar winds and CMEs. Also, the model can be use to determine the reaches of an Earth-directed CME to understand what impacts the CME could possibly have. The model is very important in preparing for any type of space weather scenario.
The model is named after Wang-Sheeley-Arge (WSA), three important scientists in space weather, and the Sumerian god of winds and storms (ENLIL). The WSA-ENLIL model can give us a lot of information, such as velocity, density, and dynamic pressure of solar winds and CMEs. The model is available to the public through the Integrated Space Weather Analysis System (iSWA) from the Community Coordinated Modeling Center (CCMC). To access the iSWA layout seen in the video, follow this link.
Clicking on the link takes you to animated models of Velocity and Density. You can set the model times to 4 April 2015, if you wish.
cbdakota
http://commons.wikimedia.org/wiki/File:Magnetosphere_Levels.svg#/media/File:Magnetosphere_Levels.svg
